

On page 4891, the color scale in Figure 2 and the color key in the figure legend were incorrect. The corrected Figure 2 and legend are shown below. The errors have been corrected in the published article.
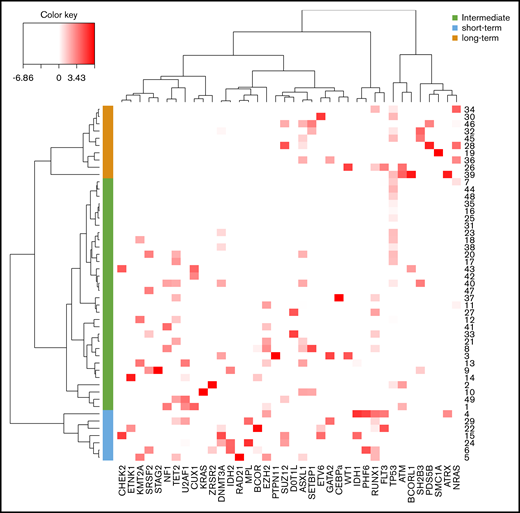
Classification of post-PV/ET AML according to their mutational landscape. Heat map based on the Euclidean distance, displaying the VAF of additional mutations. Genes are listed on the x-axis, and each row corresponds to a patient. The color scale represents the scaled abundance of each variable and is proportional to the allele burden (darker red represents higher allele burden). Three groups were identified for short-term (blue), long-term (orange), and intermediate (green) transformation.
Classification of post-PV/ET AML according to their mutational landscape. Heat map based on the Euclidean distance, displaying the VAF of additional mutations. Genes are listed on the x-axis, and each row corresponds to a patient. The color scale represents the scaled abundance of each variable and is proportional to the allele burden (darker red represents higher allele burden). Three groups were identified for short-term (blue), long-term (orange), and intermediate (green) transformation.

