

Key Points
Che-1 correlates with progression of MM and with its poorer clinical outcomes.
Che-1 contributes to chromatin organization by modulating histone acetylation.

Abstract
Multiple myeloma (MM) is a hematologic malignancy produced by a clonal expansion of plasma cells and characterized by abnormal production and secretion of monoclonal antibodies. This pathology exhibits an enormous heterogeneity resulting not only from genetic alterations but also from several epigenetic dysregulations. Here we provide evidence that Che-1/AATF (Che-1), an interactor of RNA polymerase II, promotes MM proliferation by affecting chromatin structure and sustaining global gene expression. We found that Che-1 depletion leads to a reduction of “active chromatin” by inducing a global decrease of histone acetylation. In this context, Che-1 directly interacts with histones and displaces histone deacetylase class I members from them. Strikingly, transgenic mice expressing human Che-1 in plasma cells develop MM with clinical features resembling those observed in the human disease. Finally, Che-1 downregulation decreases BRD4 chromatin accumulation to further sensitize MM cells to bromodomain and external domain inhibitors. These findings identify Che-1 as a promising target for MM therapy, alone or in combination with bromodomain and external domain inhibitors.
Introduction
Multiple myeloma (MM) is a neoplasm characterized by the accumulation of proliferating antibodies producing plasma cells in the bone marrow.1 Despite several improvements in therapeutics, MM remains incurable, with patients subject to relapses.2 This disease is characterized by a high frequency of structural variants and copy number abnormalities.3,4 In addition, an increasing number of studies provide evidence of numerous regulatory shifts in the genomic organization during the development of MM.5-7 Importantly, several undifferentiated MMs show reorganization of the chromatin, including upregulation of euchromatic histone marks.5,8-10 Consistent with these findings, an increase in the accessibility of chromatin compared with normal plasma cells was observed in MM cells, with a significant conversion of heterochromatic regions into accessible “active chromatin.”11
Che-1/AATF (Che-1) is a protein identified by its ability to bind RNA polymerase II (Pol II).12 Several studies have described the involvement of Che-1 in the regulation of gene transcription and tumor cell proliferation.13-16 It is present in the histone acetyltransferase complexes SAGA and ATAC through its interaction with the transcriptional coactivators ADA2, ADA3, and GCN5,17,18 and it acts as an endogenous histone deacetylase 1 (HDAC1) inhibitor through its ability to disrupt the binding of pRb and Sp1 proteins to this enzyme.13,19 In addition, Che-1 plays an important role in the cellular response to DNA damage or to other cellular stressors,20-22 and it sustains cell survival in MM cells by inhibiting mTORC1 activity and inducing autophagy.23
In the current study, we show that Che-1 plays a crucial role in the transformation and proliferation of MM cells by increasing chromatin accessibility at both proximal and distal regulatory elements in in vitro and in vivo MM models. Using a comprehensive plethora of low- and high-throughput approaches coupled with ad hoc bioinformatics analysis, we observed a linear relationship between Che-1 and general histone acetylation in patients with MM. Strikingly, Che-1 depletion induces a global transcription shut-off by systematically reducing histone acetylation. These results contribute to further elucidate the role of Che-1 as an essential component of the transcription machinery in MM, as well as in confirming Che-1 as a possible target for enhancing the efficacy of antitumor agents.
Materials and methods
The detailed description of the study materials and methods is presented in the supplemental Methods.
Cell lines
Human MM cell lines Kms27, Kms18, U266, RPMI-8226, and Molp8 were cultured in Opti-MEM (Thermo Fisher Scientific) supplemented with 15% inactivated fetal bovine serum (Thermo Fisher Scientific), 2 mM glutamine, and 40 μg/mL gentamicin. Patient-derived MM cell lines (MM196 and MM217) were derived from clinical bone marrow samples.
Human specimens
A cohort of monoclonal gammopathies of undetermined clinical significance and MM patient samples were collected as part of routine clinical examination. The study was approved by the Regina Elena Cancer Institute Ethics Committee (CE 422/14), and written informed consent to participate in this study was provided by all subjects. Forty-three patients were studied at different stages of disease without limitation of sex, age, or geographic location. Bone marrow aspirates were enriched for plasma cells by magnetic cell separation using human CD138+ selection and Macs Separator kits (Miltenyi Biotec). For the immunohistochemistry (IHC) analysis, Che-1 protein expression was examined in a series of 55 cases of MM, diagnosed according to the World Health Organization classification. We also examined 22 cases of patients with monoclonal gammopathies of undetermined clinical significance matched for age and sex.
Mice
All the procedures involving animals and their care were approved by the Italian Ministry of Health (Prot. 130/2015-PR) and were conformed to the relevant regulatory standards in accordance with the Italian legislation. For transplantation experiments, CD138+ cells from Vk*Myc mice were transfected by Lipofectamine 3000 and treated with 100 nM JQ1 for 2 days; an equal number of viable cells were then injected into the lateral tail vein of the male C57BL/6J (4 weeks old) wild-type recipient mice, sublethally irradiated with 6 Gy, and randomly assigned to the different experimental groups (n = 5 per group). At the end of treatment, mice were bled for serum protein electrophoresis analysis, euthanized, and examined for bone marrow infiltration by using flow cytometry and IHC.
For Vk*Che-1 mice production, transgenic DNA vector was kindly donated by Marta Chesi (Mayo Clinic, Arizona) and used to clone human Che-1 open reading frame. Vk*Che-1 transgenic mice were generated by microinjecting transgenic DNA into the pronuclei of zygotes derived from B6D2F1 (BDF1) mice, following previously described standard procedures.24 Mice were euthanized between 16 and 19 months of age by cervical dislocation. Samples of spleen, liver, kidney, and possible tumor masses were collected in 4% paraformaldehyde in phosphate-buffered saline for histologic examination or snap frozen in liquid nitrogen for protein and RNA analyses. Fresh bone marrow cells from both femoral bones of euthanized animals were flushed with phosphate-buffered saline.
Western blot and coimmunoprecipitation
Immunoblotting and coimmunoprecipitation were performed as previously described.23
ChIP and ChIP-seq
The chromatin immunoprecipitation (ChIP) protocol was performed as previously described,23 with minor modifications. Equal amounts of precleared chromatin were added to antibody-bound Dynabeads, together with Drosophila internal spike-in (Active Motif). ChIP-sequencing (ChIP-seq) experiments were performed following the ChIPmentation protocol25 in duplicate for H3K27ac. The final libraries were controlled on an Agilent 2100 Bioanalyzer (Agilent Technologies) and sequenced on a NextSeq 500 (Illumina) using a 50-cycle single-end mode. Data analysis is described in the Computational Methods section of the supplemental Methods.
ATAC-Seq
Assay for transposase-accessible chromatin using sequencing (ATAC-seq) analyses were performed following the protocol developed by Buenrostro et al,26 with minor modifications. Data analysis is described in the Computational Methods section of the supplemental Methods.
RNA-Seq
Total RNA was extracted from the same number of viable cells using QIAzol Lysis Reagent (Qiagen). ERCC ExFold RNA Spike-In Mixes (Thermo Fisher Scientific) were added to each sample for normalizing gene expression. RNA libraries for sequencing were generated in triplicate by using the same amount of RNA for each sample according to the Illumina TruSeq Stranded Total RNA kit with an initial ribosomal depletion step using Ribo Zero Gold (Illumina). The libraries were quantified by quantitative reverse transcription polymerase chain reaction and sequenced in paired-end mode (2 × 75 bp) with NextSeq 500 (Illumina). Data analysis is described in the Computational Methods section of the supplemental Methods.
Mass spectrometry analysis
Mass spectrometry analysis was performed by Active Motif as a Mod Spec service. The methods are described in supplemental Table 1.
Results
Che-1 overexpression correlates with progression of MM and with poorer clinical outcomes in MM
In a previous study, we analyzed several ONCOMINE databases and found a direct correlation between the expression of Che-1 and the progression of MM in patients.23 To extend these results, we took advantage of the gene expression and clinical data, including the International Staging System (ISS), available in the CoMMpass data set. Remarkably, Che-1 (AATF gene) expression was significantly higher in ISS stage 3 compared with both the other stages (Figure 1A). Collectively, these data reinforce the notion that Che-1 expression increases during MM progression.
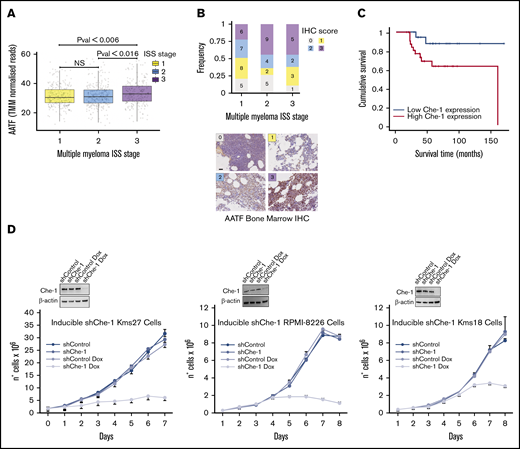
Che-1 overexpression correlates with progression of MM and with poorer clinical outcomes of patients. (A) AATF (ENSG00000108270) gene expression of CoMMpass patient cohort assigned to their relative ISS. Data were obtained from CoMMpass (table IA13a_E74GTF). Raw read counts normalized with the weighted trimmed mean of M-values (TMM). Color scheme: yellow = ISS 1; blue = ISS 2; violet = ISS 3. P value obtained by applying Student t test. (B) Top: The stacked bar plot summarizes the IHC scores associated with the patient samples stained for AATF. x-axis = ISS score, y-axis = frequency; legend = IHC scores. Numbers inside the plot show the available samples per group. Bottom: Representative IHC analysis of the bone marrow of patients with MM analyzed with anti–Che-1 antibody. Scale bar, 100 µm. (C) Kaplan-Meier survival curves for overall survival of 77 patients with MM separated according to Che-1 expression levels. P = .016. (D) Bottom: Cell proliferation analysis of Kms27 (1 × 10⁶), Kms18, and RPMI-8226 (2 × 10⁵) cells infected with LV-THsh/Che-1 (shChe-1) or LV-THsh/Control (shControl), and LV-tTR_KRAB lentiviruses and induced or not with doxycycline (Dox). Error bars represent the standard deviation of triplicate experiments. Top: western blot analysis with the indicated antibodies of total cell extracts from inducible cells treated as above. See also supplemental Figure 1.
Che-1 overexpression correlates with progression of MM and with poorer clinical outcomes of patients. (A) AATF (ENSG00000108270) gene expression of CoMMpass patient cohort assigned to their relative ISS. Data were obtained from CoMMpass (table IA13a_E74GTF). Raw read counts normalized with the weighted trimmed mean of M-values (TMM). Color scheme: yellow = ISS 1; blue = ISS 2; violet = ISS 3. P value obtained by applying Student t test. (B) Top: The stacked bar plot summarizes the IHC scores associated with the patient samples stained for AATF. x-axis = ISS score, y-axis = frequency; legend = IHC scores. Numbers inside the plot show the available samples per group. Bottom: Representative IHC analysis of the bone marrow of patients with MM analyzed with anti–Che-1 antibody. Scale bar, 100 µm. (C) Kaplan-Meier survival curves for overall survival of 77 patients with MM separated according to Che-1 expression levels. P = .016. (D) Bottom: Cell proliferation analysis of Kms27 (1 × 10⁶), Kms18, and RPMI-8226 (2 × 10⁵) cells infected with LV-THsh/Che-1 (shChe-1) or LV-THsh/Control (shControl), and LV-tTR_KRAB lentiviruses and induced or not with doxycycline (Dox). Error bars represent the standard deviation of triplicate experiments. Top: western blot analysis with the indicated antibodies of total cell extracts from inducible cells treated as above. See also supplemental Figure 1.
To further confirm the relevance of Che-1 in MM, we assessed the expression of Che-1 by IHC in single biopsy specimens from a cohort of 77 clinically well‐characterized cases, of which 55 samples were assigned to their relative high-confidence ISS and IHC score (Figure 1B). Overall, Che-1 displayed a nuclear and partially cytoplasmic positivity (Figure 1B), and remarkably, high IHC score frequency at ISS stages 2 and 3 was observed in our patient cohort. The univariate analysis revealed that increased Che-1 expression was associated with reduced event‐free and overall survival in these patients with MM (Figure 1C). Furthermore, survival analysis of 542 patients with MM (GSE2658)27 confirmed that high expression of Che-1 is strongly associated with poorer prognosis in MM (supplemental Figure 1A).
To directly test whether Che-1 is required for MM cell proliferation, we produced 3 MM cell lines (Kms27, RPMI-8226, and Kms18) in which Che-1 short hairpin RNA can be induced by doxycycline. Strikingly, when treated with doxycycline, ind-shChe-1 cells exhibited a dramatic decrease in cell proliferation compared with control cells (Figure 1D). These results were confirmed by subjecting 2 patient-derived MM cell lines (MM196 and MM217) to nucleofection (supplemental Figure 1B) and by using a short hairpin RNA vector targeting a different region of Che-1 messenger RNA (mRNA) (pSuper shChe-1_2) (supplemental Figure 1C), whereas Myc-tagged Che-1 (Myc Che-1) overexpression produced an increase in cell proliferation in several MM cell lines (supplemental Figure 1D). Together, these observations strongly indicate a fundamental role of Che-1 in sustaining MM proliferation and progression.
Che-1 sustains histone acetylation
Che-1 is known to interact with several components of histone acetyltransferase complexes.17,18 Herein, we broadly estimate whether Che-1 was required for correct histone acetylation on different lysine residues by performing a mass spectrometry analysis quantifying the majority of histone modifications in Che-1–depleted or not Kms27 cells. Because Che-1 depletion induces apoptosis in MM cells,23 all subsequent analyses were performed 48 hours after small interfering RNA (siRNA) Che-1 transfection or doxycycline treatment (shChe-1 activation), when the apoptotic process was not yet activated (supplemental Figure 2A-C). Remarkably, Che-1 knockout produced a global reduction of histone acetylation (Figure 2A; supplemental Table 1). These results were confirmed by western blot analysis on several lysine residue-acetylation associated with transcription and “active chromatin”28 (supplemental Figure 2D). In agreement, we detected a consistent sharp decrease in histone lysine-acetylation in response to Che-1 downregulation in Kms27, Kms18, MM196, and MM217 cells (supplemental Figure 2E-G).
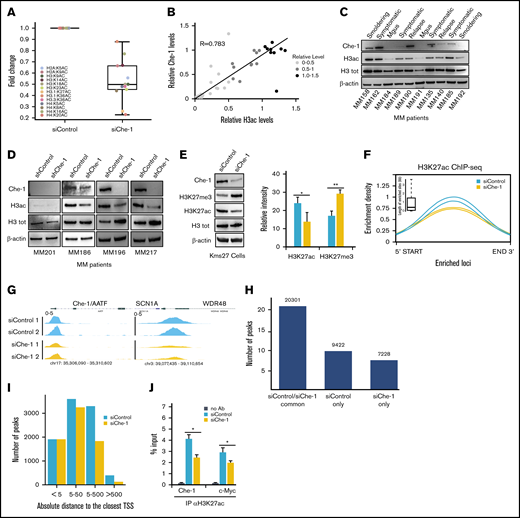
Che-1 sustains histone acetylation. (A) Histone acetylation analysis by mass spectrometry from Kms27 cells transiently transfected with siRNA control (siControl) or siRNA Che-1 (siChe-1). (B) Che-1/H3ac correlation in 37 MM samples evaluated by using western blot (WB) analysis and densitometric analysis. R score, 0.783; P < .0001. (C) Representative WB analysis with the indicated antibodies of total cell extracts from CD138+ purified plasma cells of primary tumors. (D) CD138+ neoplastic cells from patients with symptomatic myeloma were cocultured with stromal cells from the same patient for 24 hours before infecting them with shChe-1 or shControl lentiviral vectors. After 48 hours, total cell extracts from infected MM primary cells were analyzed by WB with the indicated antibodies. (E) Decreased levels of H3K27ac and increased levels of H3K27me3 were found in Kms27 cells transiently transfected with siChe-1 compared with siControl. The bar plot shows the average modulation of histone H3 modifications observed in these experiments (n = 3). P value was calculated by Student t test; *P = .043, **P = .0039. (F) Enrichment density of H3K27ac ChIP-seq significant peaks identified in siControl (blue) and siChe-1 (yellow) samples. Enrichment density was calculated on the relative size of each peak, with 2 replicates per group. Boxplot shows the peak sizes. (G) H3K27ac ChIP-seq signal in siControl (blue) and siChe-1 (yellow) samples at AATF, SCN1A, WDR48 loci. Signal enrichment scale, 0 to 5. (H) Bar plot showing the number of H3K27ac ChIP-seq peaks in common and specific to siControl and siChe-1 samples. (I) Boxplot showing the relative distance of each significant peak to the closest gene in siControl (blue) and siChe-1 (yellow). Distance calculated as absolute value and expressed in kilobase. (J) Kms27 cells transiently transfected with siControl or siChe-1 were subjected to ChIP–quantitative polymerase chain reaction (ChIP-qRT) using anti-H3K27ac antibody (Ab). Data are expressed as percentage of input. Data represent the mean ± standard deviation. P value was calculated by Student t test (n = 3; *P < .023). See also supplemental Figure 2. Mgus, monoclonal gammopathy of undetermined clinical significance.
Che-1 sustains histone acetylation. (A) Histone acetylation analysis by mass spectrometry from Kms27 cells transiently transfected with siRNA control (siControl) or siRNA Che-1 (siChe-1). (B) Che-1/H3ac correlation in 37 MM samples evaluated by using western blot (WB) analysis and densitometric analysis. R score, 0.783; P < .0001. (C) Representative WB analysis with the indicated antibodies of total cell extracts from CD138+ purified plasma cells of primary tumors. (D) CD138+ neoplastic cells from patients with symptomatic myeloma were cocultured with stromal cells from the same patient for 24 hours before infecting them with shChe-1 or shControl lentiviral vectors. After 48 hours, total cell extracts from infected MM primary cells were analyzed by WB with the indicated antibodies. (E) Decreased levels of H3K27ac and increased levels of H3K27me3 were found in Kms27 cells transiently transfected with siChe-1 compared with siControl. The bar plot shows the average modulation of histone H3 modifications observed in these experiments (n = 3). P value was calculated by Student t test; *P = .043, **P = .0039. (F) Enrichment density of H3K27ac ChIP-seq significant peaks identified in siControl (blue) and siChe-1 (yellow) samples. Enrichment density was calculated on the relative size of each peak, with 2 replicates per group. Boxplot shows the peak sizes. (G) H3K27ac ChIP-seq signal in siControl (blue) and siChe-1 (yellow) samples at AATF, SCN1A, WDR48 loci. Signal enrichment scale, 0 to 5. (H) Bar plot showing the number of H3K27ac ChIP-seq peaks in common and specific to siControl and siChe-1 samples. (I) Boxplot showing the relative distance of each significant peak to the closest gene in siControl (blue) and siChe-1 (yellow). Distance calculated as absolute value and expressed in kilobase. (J) Kms27 cells transiently transfected with siControl or siChe-1 were subjected to ChIP–quantitative polymerase chain reaction (ChIP-qRT) using anti-H3K27ac antibody (Ab). Data are expressed as percentage of input. Data represent the mean ± standard deviation. P value was calculated by Student t test (n = 3; *P < .023). See also supplemental Figure 2. Mgus, monoclonal gammopathy of undetermined clinical significance.
We confirmed these data by western blot analysis of Che-1 and histone H3 acetylation levels in an additional cohort of 43 primary MM patients. These samples showed a marked linear relationship between Che-1 expression and acetylation levels (Figure 2B-C; supplemental Figure 2I). Moreover, Che-1 and histone H3–acetylated levels strongly increased in MM cells compared with normal plasma cells (supplemental Figure 2H). To further explore these findings, CD138+ cells from patients with MM were infected with shChe-1 or shControl lentiviral vectors (supplemental Figure 2J-K). As shown in Figure 2D, shChe-1 transduction strongly inhibited H3 acetylation in patients with high Che-1 expression. Accordingly, H3K27ac decrease was compensated by the relative gain of H3K27me3, a marker commonly associated with heterochromatin26 (Figure 2E). In agreement with these results, H3K27ac ChIP-seq revealed a global reduction of this histone modification in Che-1 knockdown cells (Figure 2F-I), and these findings were confirmed by ChIP–quantitative polymerase chain reaction (Figure 2J). Collectively, these data show that Che-1 sustains global histone acetylation in MM cells.
Che-1 displaces HDAC proteins from histones
The global reduction of histone acetylation after Che-1 depletion prompted us to evaluate whether Che-1 interacts with histone proteins. As shown in Figure 3A, coimmunoprecipitation with anti–Che-1 suggested a strong interaction with histones H3, H4, and H2B. These findings were corroborated by independent in vitro binding experiments using a bacterial glutathione S-transferase (GST)-Che-1 fusion protein incubated with purified histones, ultimately showing a direct interaction between Che-1 and core histone proteins (Figure 3B). Che-1 and HDAC class I members share a region of high homology required for their binding to pRb13 (Figure 3C). This region (Che-1 aa 308-325) is also required for the binding of Che-1 to histones, as the mutant Myc Che-1Δ 308-325 lacking this particular region did not interact with histone H3 (Figure 3D). Consequently, we evaluated whether the interactions of Che-1 and HDAC1 with histones may be mutually exclusive. As shown in Figure 3E, Che-1 knockdown increased the amount of HDAC1 bound to histone H3, whereas Che-1 308-325 peptide produced a remarkable reduction of histones bound to GST-HDAC1 (Figure 3F). To confirm these results, we extracted 4 consecutive protein fractions with increasing detergent concentration from Che-1–depleted and control cells and evaluated the distribution of HDAC class I members. As shown in supplemental Figure 3A, Che-1 downregulation produced an accumulation of all three members of the HDAC class I in the chromatin fraction (IV), accompanied by a decrease in histone H3 acetylation.
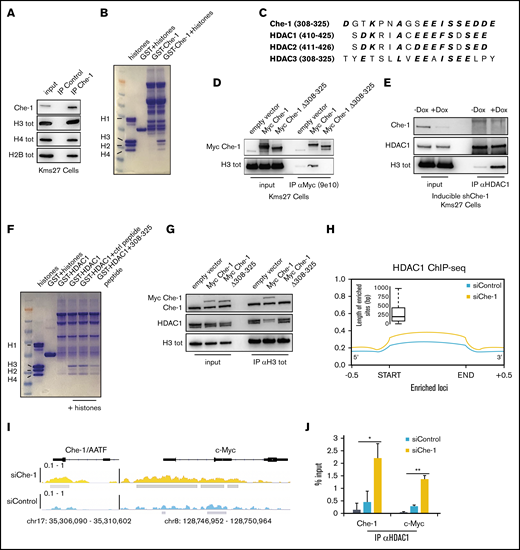
Che-1 displaces HDAC proteins from histones. (A) Kms27 nuclear extracts were immunoprecipitated with anti–Che-1 polyclonal antibody and analyzed by western blot (WB) analysis with the indicated antibodies. (B) Coomassie blue stain of histone proteins incubated with purified GST-Che-1 fusion protein or control GST agarose beads. (C) Sequence alignment of Che-1 and HDAC class I proteins. Conserved amino acid residues are in bold and italic. (D) Nuclear extracts from Kms27 cells transiently transfected with the indicated expression vectors were immunoprecipitated with anti-Myc 9e10 monoclonal antibody and analyzed by WB with the indicated antibodies. (E) Nuclear extracts from inducible ind-shChe-1 Kms27 cells treated or not with doxycycline (Dox) were immunoprecipitated with anti-HDAC1 polyclonal antibody and analyzed by WB with the indicated antibodies. (F) Coomassie blue stain of histone proteins incubated with purified GST-HDAC1 fusion protein or control GST agarose beads in the presence or absence of the indicated peptides. (G) Nuclear extracts from Kms27 cells transiently transfected with the indicated expression vectors were immunoprecipitated with anti-histone H3 antibody and analyzed by WB with the indicated antibodies. (H) Enrichment density of HDAC1 ChIP-seq significant peaks identified in siRNA control (siControl) (blue) and siRNA Che-1 (siChe-1) (yellow) samples. Enrichment density was calculated on the relative size of each peak (start to end of each fragment) extended 500 bp upstream and downstream. Boxplot shows the peak sizes. (I) HDAC1 ChIP-seq signal in siControl (blue) and siChe-1 (yellow) samples at AATF and c-Myc loci. Signal enrichment scale on the y-axis of each site. (J) Kms27 cells transiently transfected with siControl or siChe-1 were subjected to ChIP-qRT using anti-HDAC1 antibody followed by qRT. Data are expressed as percentage of input. Data represent the mean ± standard deviation. P value was calculated by Student t test (n = 3, *P < .0018, **P = .00034). See also supplemental Figure 3.
Che-1 displaces HDAC proteins from histones. (A) Kms27 nuclear extracts were immunoprecipitated with anti–Che-1 polyclonal antibody and analyzed by western blot (WB) analysis with the indicated antibodies. (B) Coomassie blue stain of histone proteins incubated with purified GST-Che-1 fusion protein or control GST agarose beads. (C) Sequence alignment of Che-1 and HDAC class I proteins. Conserved amino acid residues are in bold and italic. (D) Nuclear extracts from Kms27 cells transiently transfected with the indicated expression vectors were immunoprecipitated with anti-Myc 9e10 monoclonal antibody and analyzed by WB with the indicated antibodies. (E) Nuclear extracts from inducible ind-shChe-1 Kms27 cells treated or not with doxycycline (Dox) were immunoprecipitated with anti-HDAC1 polyclonal antibody and analyzed by WB with the indicated antibodies. (F) Coomassie blue stain of histone proteins incubated with purified GST-HDAC1 fusion protein or control GST agarose beads in the presence or absence of the indicated peptides. (G) Nuclear extracts from Kms27 cells transiently transfected with the indicated expression vectors were immunoprecipitated with anti-histone H3 antibody and analyzed by WB with the indicated antibodies. (H) Enrichment density of HDAC1 ChIP-seq significant peaks identified in siRNA control (siControl) (blue) and siRNA Che-1 (siChe-1) (yellow) samples. Enrichment density was calculated on the relative size of each peak (start to end of each fragment) extended 500 bp upstream and downstream. Boxplot shows the peak sizes. (I) HDAC1 ChIP-seq signal in siControl (blue) and siChe-1 (yellow) samples at AATF and c-Myc loci. Signal enrichment scale on the y-axis of each site. (J) Kms27 cells transiently transfected with siControl or siChe-1 were subjected to ChIP-qRT using anti-HDAC1 antibody followed by qRT. Data are expressed as percentage of input. Data represent the mean ± standard deviation. P value was calculated by Student t test (n = 3, *P < .0018, **P = .00034). See also supplemental Figure 3.
We next took advantage of the Myc Che-1Δ 308-325 mutant to test whether the binding of Che-1 to histones and the subsequent removal of HDACs from the latter were the mechanisms underlying the results shown in Figure 2. As shown in Figure 3G, Myc Che-1 wild-type overexpression was able to reduce the amount of HDAC1 bound to histone H3. Conversely, this result was not replicated using Myc Che-1Δ 308-325. In addition, this mutant was defective in modulating histone acetylation and cell proliferation (supplemental Figure 3B-C). Notably, Myc Che-1Δ 308-325 did not rescue the effects produced by Che-1 depletion in Kms27 cells (supplemental Figure 3D-E). Finally, these results were confirmed by HDAC1 ChIP-seq analysis, which significantly linked a global increase in HDAC1 occupancy with Che-1 depletion at global (Figure 3H) and single (Figure 3I) loci resolution. Low-throughput ChIP–quantitative polymerase chain reaction experiments supported these findings (Figure 3J). Altogether, this new evidence shows the role of Che-1 in sustaining global histone acetylation by displacing HDAC class I members from chromatin.
Che-1 modulates active chromatin and global transcription in MM cells
To ascribe a potential functional role to Che-1 in sustaining chromatin organization, we assessed micrococcal nuclease activity and performed a comprehensive profiling of DNA accessibility by using ATAC-seq26 in MM cells. We observed that Che-1 depletion in Kms27 cells decreased enzymatic digestion, indicating a more compacted overall chromatin structure (Figure 4A). Conversely, Myc Che-1 wild-type but not Myc Che-1Δ 308−325 overexpression induced a more digested chromatin (supplemental Figure 4A). In agreement, ATAC-seq revealed a global reduction of chromatin accessibility sites after Che-1 downregulation (Figure 4B-C). Remarkably, ∼40 000 significant peaks in control cells were not more accessible in Che-1–depleted cells. In addition, 12 132 regions exhibited a reduced accessibility, and only 578 new open regions were detected (Figure 4D). Peaks store regulatory information in the form of the transcription factor motif, which is generally bound by the cognate transcription factor when accessible. The application of motif enrichment analysis of peaks lost upon Che-1 depletion revealed distinct regulatory information compared with the peaks maintained. Remarkably, Che-1 depletion induced a chromatin shift significantly targeting IRF binding motifs, a family of transcription factors that plays a master role in MM-specific gene expression.29,30 Moreover, we conducted a rigorous investigation of the ontologies associated with the depleted peaks. This analysis provided evidence regarding the systematic relationship of signal loss upon Che-1 inhibition with mechanistic disease and pathways classification, which includes inferred hematopoietic system, bone marrow diseases, and, remarkably, MM (Figure 4E). Conversely, the same sites exhibited enrichment for factors and pathways associated with cell cycle, transcription, and immune response (Figure 4F), in line with our experimental and computationally inferred novel insights.
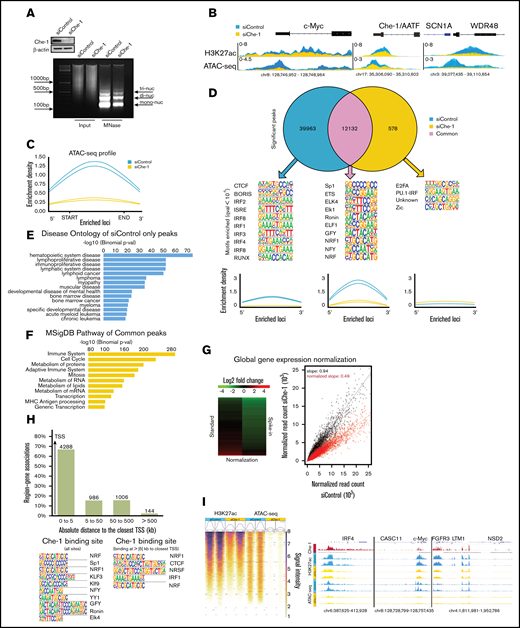
Che-1 modulates active chromatin and global transcription in MM cells. (A) Line traces of representative gel lanes of micrococcal nuclease (MNase) assay (bottom) and corresponding WB analysis with the indicated antibodies of total cell extracts (top) from Kms27 cells transfected with siRNA control (siControl) or siRNA Che-1 (siChe-1). (B) ATAC-seq and H3K27ac signal in siControl (blue) and siChe-1 (yellow) samples at c-Myc, AATF, SCN1A, and WDR48 loci. Signals of each replicate in the 2 categories are overlaid and fitted with transparency. Signal enrichment scale is given on the y-axis of each site. (C) Enrichment density of ATAC-seq significant peaks identified in siControl (blue) and siChe-1 (yellow) samples. Enrichment density was calculated on the relative size of each peak. (D) Top: Venn diagram showing shared and unique peaks in the 2 categories siControl (blue) and siChe-1 (yellow) samples. Middle: Motifs of the top 10 most enriched transcription factors for each category. Q value <10−3. Bottom: Enrichment density of ATAC-seq significant peaks of each category identified in siControl (blue) and siChe-1 (yellow) samples. Enrichment density was calculated on the relative size of each peak. (E) Disease ontology enrichment analysis of the only siControl (blue) significant peaks with the relative P value associated with each entry. Test statistic for binomial distribution. (F) Pathway enrichment analysis of the shared peaks between siControl (blue) and siChe-1 (yellow) samples with the relative P value associated with each entry. Test statistic for binomial distribution. (G) Heat map representation of normalized fold change in RNA spike-in normalized gene expression in Kms27 cells after siChe-1 transfection (left). Spike-in normalized transcriptional output of Kms27 cells transfected as in A (right). (H) Top: Bar chart of Che-1 ChIP-seq signals to the closest gene. Bar chart is representing the absolute distances of Che-1 signals (N = 6000) to the closest gene. x-axis: Absolute distance expressed in kilobase (kb) to the closest transcription start site (TSS). y-axis: Percentage of peak association to the closest genes. Bottom: Motif analysis of Che-1 ChIP signals. Left: Top 10 most significant motifs obtained from the 6000 Che-1 ChIP binding sites (Q value <10−41). Right: Significant motifs of Che-1 binding signals at >5 kb to the closest TSS (Q value <0.05). (I) Left: ATAC and H3K27ac signal intensity of siControl (blue) and siChe (yellow) at 6000 Che-1 ChIP binding sites. Signal intensity from 1 (weak) to 8 (strongest). Right: Normalized Che-1 ChIP (red), H3K27ac ChIP and ATAC-seq signal at IRF4, CASC11, c-Myc, FGFR3, LTM1, and NSD2 genes. See also supplemental Figure 4. MSigDB, Molecular Signature Database.
Che-1 modulates active chromatin and global transcription in MM cells. (A) Line traces of representative gel lanes of micrococcal nuclease (MNase) assay (bottom) and corresponding WB analysis with the indicated antibodies of total cell extracts (top) from Kms27 cells transfected with siRNA control (siControl) or siRNA Che-1 (siChe-1). (B) ATAC-seq and H3K27ac signal in siControl (blue) and siChe-1 (yellow) samples at c-Myc, AATF, SCN1A, and WDR48 loci. Signals of each replicate in the 2 categories are overlaid and fitted with transparency. Signal enrichment scale is given on the y-axis of each site. (C) Enrichment density of ATAC-seq significant peaks identified in siControl (blue) and siChe-1 (yellow) samples. Enrichment density was calculated on the relative size of each peak. (D) Top: Venn diagram showing shared and unique peaks in the 2 categories siControl (blue) and siChe-1 (yellow) samples. Middle: Motifs of the top 10 most enriched transcription factors for each category. Q value <10−3. Bottom: Enrichment density of ATAC-seq significant peaks of each category identified in siControl (blue) and siChe-1 (yellow) samples. Enrichment density was calculated on the relative size of each peak. (E) Disease ontology enrichment analysis of the only siControl (blue) significant peaks with the relative P value associated with each entry. Test statistic for binomial distribution. (F) Pathway enrichment analysis of the shared peaks between siControl (blue) and siChe-1 (yellow) samples with the relative P value associated with each entry. Test statistic for binomial distribution. (G) Heat map representation of normalized fold change in RNA spike-in normalized gene expression in Kms27 cells after siChe-1 transfection (left). Spike-in normalized transcriptional output of Kms27 cells transfected as in A (right). (H) Top: Bar chart of Che-1 ChIP-seq signals to the closest gene. Bar chart is representing the absolute distances of Che-1 signals (N = 6000) to the closest gene. x-axis: Absolute distance expressed in kilobase (kb) to the closest transcription start site (TSS). y-axis: Percentage of peak association to the closest genes. Bottom: Motif analysis of Che-1 ChIP signals. Left: Top 10 most significant motifs obtained from the 6000 Che-1 ChIP binding sites (Q value <10−41). Right: Significant motifs of Che-1 binding signals at >5 kb to the closest TSS (Q value <0.05). (I) Left: ATAC and H3K27ac signal intensity of siControl (blue) and siChe (yellow) at 6000 Che-1 ChIP binding sites. Signal intensity from 1 (weak) to 8 (strongest). Right: Normalized Che-1 ChIP (red), H3K27ac ChIP and ATAC-seq signal at IRF4, CASC11, c-Myc, FGFR3, LTM1, and NSD2 genes. See also supplemental Figure 4. MSigDB, Molecular Signature Database.
The results shown here prompted us to verify whether Che-1 regulates transcriptional activity. Total RNA was isolated from equal numbers of Kms27 cells depleted or not by siRNA for Che-1, and, as shown in supplemental Figure 4B and 4C, Che-1–depleted cells exhibited 55% less total RNA compared with control cells. Similar results were obtained in Kms18 cells and ind-shChe-1 Kms27 cells (supplemental Figure 4D), as well as in Kms27 cells transfected with pSuper short hairpin RNA Che-1_2 (supplemental Figure 4E). In agreement, Myc-Che-1 but not Myc Che-1Δ 308−325 overexpression increased total RNA content in MM cells and rescued the effects of Che-1 depletion (supplemental Figure 4F-G). To extend these results, we performed RNA-sequencing (RNA-seq) experiments by adding synthetic spike-in RNAs for downstream normalization.31,32 The analysis for this experiment showed that 47% of all expressed genes were strongly downregulated in Che-1–depleted cells (log2 fold change < −1) (Figure 4G). The gene ontology analysis revealed that among the most significantly downregulated genes, there were genes involved in the general transcription and translation processes and, as expected from MM cells, in protein processing and secretion (supplemental Figure 4H). Notably, several important genes involved in MM pathogenesis, including c-Myc, FGFR3, IRF4, CCND1, and MMSET,33 were downregulated in Che-1–depleted cells (supplemental Figure 4I). Our results were validated by cell number–normalized quantitative reverse transcription polymerase chain reaction of a group of genes with dynamically regulated expression in Kms27 cells, with or without Che-1 depletion (supplemental Figure 4J). Indeed, transcriptional inhibition in Che-1–depleted cells was already detected at pre-mRNA levels, indicating that Che-1 could regulate RNA pol II activity. Consistent with these results, compared with control cells, Che-1 depletion induced a significant reduction of chromatin-associated RNA Pol II and of the initiation-associated Ser5-phosphorylated Pol II levels34 (supplemental Figure 4K-L). Moreover, Che-1 overexpression rescued the effects of Che-1 depletion on Ser5-phosphorylated Pol II (supplemental Figure 4M).
To further confirm these findings, we performed Che-1 ChIP-seq experiment in Kms27 cells, showing a strong enrichment of Che-1 peaks on promoters (Figure 4H). The analysis of transcription factor motifs enriched at Che-1 bound peaks showed binding motifs of factors involved in cell growth and proliferation such Sp1, NFY, or NFR1, whereas IRF binding motifs were found distant from the closest TSS, probably on specific tissue regulatory sites. Importantly, Che-1 ChIP-seq exhibited a strong correlation between Che-1 binding on chromatin and ATAC-seq and H3K27ac signals, in particular on genes important in the pathogenesis of MM such as IRF4, c-Myc, FGFR3, and MMSET (Figure 4I). Furthermore, we evaluated the role of Che-1 on specific enhancers involved in c-Myc dysregulation in MM.35 As shown in supplemental Figure 4N, Che-1 was found on several enhancers, including IgH/L. At these sites, Che-1 depletion produced a reduction in ATAC-seq and H3K27ac signals. Altogether, these results clearly show that Che-1 is required for maintaining an active state of chromatin and transcription in MM cells.
Che-1 drives MM pathogenesis
Patient data and in vitro experiments suggested that Che-1 sustains global acetylation and chromatin accessibility ultimately supporting MM progression. We thus leveraged our ability to produce conditional Che-1 transgenic mice (Vk*Che-1) for investigating in vivo the role of Che-1 in the transformation of plasma cells. In this system, the activation of human Che-1, under the control of the expression of the κ light chain gene, occurs sporadically in germinal center B cells by the activity of the activation-induced deaminase36 (supplemental Figure 5A). One founder was obtained for Vk*Che-1 transgene (supplemental Figure 5B), and the resulting line showed normal gestation; it was viable and was used for further characterization. Among the several tissues analyzed, human Che-1 transgenic expression was detectable only in bone marrow and spleen (supplemental Figure 5C). The western blot analysis of wild-type and Vk*Che-1 bone marrow confirmed both that human Che-1 protein is expressed (human Che-1 has an extra exon compared with the murine counterpart and a size >10 kDa) and increases histone acetylation (supplemental Figure 5J). Compared with control littermates, Vk*Che-1 mice exhibited a marked elevation in serum immunoglobulin levels after 40 to 60 weeks of age (supplemental Figure 5D) and a significantly shorter median survival of 60 weeks (Figure 5A). The flow cytometry analysis revealed that Vk*Che-1 mice accumulated CD138+ plasma cells in the bone marrow (Figure 5B), and these results were confirmed by the IHC analysis (supplemental Figure 5E). Consistent with these findings, the macroscopic analysis of organs exhibited important splenomegaly (Figure 5C), and histologic examination revealed infiltration of CD138+ plasma cells on the spleen, liver, and kidney (Figure 5D). DNA accessibility profiles of plasma cells obtained by using ATAC-seq in wild-type and Vk*Che-1 animals revealed a marked dynamic shift of the chromatin landscape (Figure 5E). Specifically, Vk*Che-1 animals exhibited a comprehensive chromatin reorganization, with a significant increase in accessible regions containing motifs associated with IRF family transcription factors, with a concomitant decrease in motifs associated with PU.1, a repressor of IRF4 activity37 (Figure 5F). Nevertheless, this shift leads to the exposure of regulatory regions strongly associated with immune system disorders, spleen size increase, and MM (Figure 5G). Strikingly, Che-1 induction drove chromatin shifts accounting for the majority of the signal depleted after Che-1 inhibition in Kms27 cells.
![Che-1 drives MM pathogenesis. (A) Overall survival in weeks of a cohort of 30 wild-type (WT) and 30 Vk*Che-1 mice. P value is shown. (B) Fluorescence-activated cell sorter analysis of the bone marrow (BM) from Vk*Che-1 transgenic mice and control littermates. Percentages of CD138+ cells are indicated. (C) Splenomegaly in Vk*Che-1 mice relative to age-matched nontransgenic littermate control mice. (D) Representative images of the spleen, liver, and kidney biopsy samples from Vk*Che-1 mice were analyzed by light microscopy (hematoxylin and eosin [H&E]) (left) and by immunohistochemical analysis for CD138+ positive cells (right) to reveal plasma cell infiltrates. Scale bar, 100 μm. (E) Boxplot showing the relative enrichment of differentially downregulated (left) and upregulated (right) ATAC-seq sites obtained from WT and Vk*Che-1 mice. X-axis: Sites split in downregulated (Down), not differential (Stable), and upregulated (Up) categories. Y-axis: Raw read counts normalized with the weighted trimmed mean of M-values (TMM). Color scheme: blue = WT; red = Vk*Che-1. (F) Heatmap of the top 10 significant enriched motifs in the Down and Up categories obtained from the ATAC-seq differential analysis (WT vs Vk*Che-1). Color proportional to the relative fold enrichment (observed/expected) of each motif in the 2 categories. Blue = WT; red = Vk*Che-1; white = not significant. All colored motifs exhibit a P < 10−10. (G) Heatmap of the top significant ontologies observed in the Down and Up categories. Entries are a compendium of the most significant Mouse Genome Informatics Phenotype58 and Molecular Signature Database59 pathway ontologies. Color proportional to the relative significance of each entry in the 2 categories. Blue = WT; red = Vk*Che-1. P < 10−5 from the hypergeometric test. (H) Top: Differential analysis of WT vs Vk*Che-1 transcriptome. Volcano plot shows 2507 significantly upregulated (red) and 2009 downregulated (blue) genes. x-axis: B value, which is an approximation of fold change obtained from the Wald test. y-axis: -log10 (false discovery rate [FDR]) of significant genes. Bottom: Gene Set Enrichment Analysis (GSEA) of upregulated (right) and downregulated (left) significant differential genes with associated legend to interpret the color scheme. See also supplemental Figure 5. FITC, fluorescein isothiocyanate; TF, transcription factor.](https://ash.silverchair-cdn.com/ash/content_public/journal/bloodadvances/4/22/10.1182_bloodadvances.2020002566/2/m_advancesadv2020002566f5.png?Expires=1767766585&Signature=dXfpyCJQU1FQClVGOYHFC0oZuElk4veCZq3BCvTbA-mkKkVe0skdnmS7ShSYuH-DoAZjFOe-kfIr5ID2LfqAnb3CyoJ4yxNPt~tGeUf0p7E4jSTPpp0JlNbESX2eOAwiNA-b08D-IufpxDgrfPViiuyniWa8pUSGZ2unh3p7LcLEn5PGMLzrQoJjD3k1Af3K41OSpfAG0b8E0Cz1zKqxRnQYPsrlsDegv46ERigWFWVDelSvWoVf58skL6MukZwQ2WpJIeXhQpXs-I14dXcAcfPC9vT7G6B-32VTQ6Vg2rhiJ-7nvy3nevE-lZQP8Pq~bblhZmv~YgzLxHJFR07sYQ__&Key-Pair-Id=APKAIE5G5CRDK6RD3PGA)
Che-1 drives MM pathogenesis. (A) Overall survival in weeks of a cohort of 30 wild-type (WT) and 30 Vk*Che-1 mice. P value is shown. (B) Fluorescence-activated cell sorter analysis of the bone marrow (BM) from Vk*Che-1 transgenic mice and control littermates. Percentages of CD138+ cells are indicated. (C) Splenomegaly in Vk*Che-1 mice relative to age-matched nontransgenic littermate control mice. (D) Representative images of the spleen, liver, and kidney biopsy samples from Vk*Che-1 mice were analyzed by light microscopy (hematoxylin and eosin [H&E]) (left) and by immunohistochemical analysis for CD138+ positive cells (right) to reveal plasma cell infiltrates. Scale bar, 100 μm. (E) Boxplot showing the relative enrichment of differentially downregulated (left) and upregulated (right) ATAC-seq sites obtained from WT and Vk*Che-1 mice. X-axis: Sites split in downregulated (Down), not differential (Stable), and upregulated (Up) categories. Y-axis: Raw read counts normalized with the weighted trimmed mean of M-values (TMM). Color scheme: blue = WT; red = Vk*Che-1. (F) Heatmap of the top 10 significant enriched motifs in the Down and Up categories obtained from the ATAC-seq differential analysis (WT vs Vk*Che-1). Color proportional to the relative fold enrichment (observed/expected) of each motif in the 2 categories. Blue = WT; red = Vk*Che-1; white = not significant. All colored motifs exhibit a P < 10−10. (G) Heatmap of the top significant ontologies observed in the Down and Up categories. Entries are a compendium of the most significant Mouse Genome Informatics Phenotype58 and Molecular Signature Database59 pathway ontologies. Color proportional to the relative significance of each entry in the 2 categories. Blue = WT; red = Vk*Che-1. P < 10−5 from the hypergeometric test. (H) Top: Differential analysis of WT vs Vk*Che-1 transcriptome. Volcano plot shows 2507 significantly upregulated (red) and 2009 downregulated (blue) genes. x-axis: B value, which is an approximation of fold change obtained from the Wald test. y-axis: -log10 (false discovery rate [FDR]) of significant genes. Bottom: Gene Set Enrichment Analysis (GSEA) of upregulated (right) and downregulated (left) significant differential genes with associated legend to interpret the color scheme. See also supplemental Figure 5. FITC, fluorescein isothiocyanate; TF, transcription factor.
Che-1 drives MM pathogenesis. (A) Overall survival in weeks of a cohort of 30 wild-type (WT) and 30 Vk*Che-1 mice. P value is shown. (B) Fluorescence-activated cell sorter analysis of the bone marrow (BM) from Vk*Che-1 transgenic mice and control littermates. Percentages of CD138+ cells are indicated. (C) Splenomegaly in Vk*Che-1 mice relative to age-matched nontransgenic littermate control mice. (D) Representative images of the spleen, liver, and kidney biopsy samples from Vk*Che-1 mice were analyzed by light microscopy (hematoxylin and eosin [H&E]) (left) and by immunohistochemical analysis for CD138+ positive cells (right) to reveal plasma cell infiltrates. Scale bar, 100 μm. (E) Boxplot showing the relative enrichment of differentially downregulated (left) and upregulated (right) ATAC-seq sites obtained from WT and Vk*Che-1 mice. X-axis: Sites split in downregulated (Down), not differential (Stable), and upregulated (Up) categories. Y-axis: Raw read counts normalized with the weighted trimmed mean of M-values (TMM). Color scheme: blue = WT; red = Vk*Che-1. (F) Heatmap of the top 10 significant enriched motifs in the Down and Up categories obtained from the ATAC-seq differential analysis (WT vs Vk*Che-1). Color proportional to the relative fold enrichment (observed/expected) of each motif in the 2 categories. Blue = WT; red = Vk*Che-1; white = not significant. All colored motifs exhibit a P < 10−10. (G) Heatmap of the top significant ontologies observed in the Down and Up categories. Entries are a compendium of the most significant Mouse Genome Informatics Phenotype58 and Molecular Signature Database59 pathway ontologies. Color proportional to the relative significance of each entry in the 2 categories. Blue = WT; red = Vk*Che-1. P < 10−5 from the hypergeometric test. (H) Top: Differential analysis of WT vs Vk*Che-1 transcriptome. Volcano plot shows 2507 significantly upregulated (red) and 2009 downregulated (blue) genes. x-axis: B value, which is an approximation of fold change obtained from the Wald test. y-axis: -log10 (false discovery rate [FDR]) of significant genes. Bottom: Gene Set Enrichment Analysis (GSEA) of upregulated (right) and downregulated (left) significant differential genes with associated legend to interpret the color scheme. See also supplemental Figure 5. FITC, fluorescein isothiocyanate; TF, transcription factor.
Overall, these data imply that the Vk*Che-1 model recapitulates the cardinal features of MM disease and links increased chromatin accessibility upon Che-1 induction to IRF role in MM progression. Furthermore, we examined the spleen tissue of the Vk*Che-1 mouse model compared with the wild type. RNA-seq of fresh frozen tissues showed that Vk*Che-1 spleen exhibited a remarkable increase in total RNA levels compared with wild type (supplemental Figure 5F). Specifically, spike-in normalization of RNA-seq experiments revealed an approximately twofold increased induction in global mRNA expression of Vk*Che-1 spleen (supplemental Figure 5G). RNA-seq differential analysis (Figure 5H) revealed a marked shift of the transcriptome landscape of Vk*Che-1 mice toward hematologic cancer–associated pathways balanced by a downregulation of the gene set sustaining the normal phenotypic characteristics of the tissue. The gene ontology analysis confirmed that genes involved in cell proliferation processes were among the most significantly upregulated genes (supplemental Figure 5H). In particular, in Vk*Che-1 mice, we observed an upregulation of several genes such as IRF4, c-Myc, MMSET, FGFR3, and Cyclin D1 (supplemental Figure 5I), and these results were confirmed by using western blot analysis (supplemental Figure 5J). Altogether, these results show an important role for sustained Che-1 expression in the pathogenesis of MM, performed through the maintenance of chromatin accessibility coupled with elevated and aberrant global transcription activity.
Che-1 depletion sensitizes MM cells to BET inhibitors
BRD4 is a member of the bromodomain and external domain (BET) protein family. It plays a role in transcriptional activation through its interaction with acetylated histones,38 and specific BET inhibitors such as JQ1 bind BRD4, disrupting this binding.39 Interestingly, JQ1 usage was found to be an effective treatment in hematologic malignancies.40-42 The observation that Che-1 effectively modulates histone acetylation prompted us to evaluate whether it could also influence BRD4 activity by modulating its recruitment onto the chromatin. Strikingly, Che-1 depletion in MM196 primary cells greatly decreased the presence of BRD4 in the chromatin fraction (Figure 6A), whereas Che-1 overexpression was able to increase BRD4 levels bound to chromatin (supplemental Figure 6A). Similar observations were taken after ChIP-seq analysis performed in Che-1–depleted or not Kms27 cells (Figure 6B). Indeed, the depletion of Che-1 produced the disappearance of more than one-half of BRD4 peaks, most of which were located at the transcription start site (supplemental Figure 6B). In agreement, Che-1 silencing increased JQ1 sensitivity of MM196 cells (Figure 6C), and similar results were obtained when inducible shChe-1 Kms27 cells were treated with doxycycline and JQ1 (supplemental Figure 6C). BRD4 was found recruited on the promoter of active genes in MM.42 Consistent with this observation, MM196 cells treated with different doses of JQ1 exhibited a proliferation decrease (supplemental Figure 6D) together with a significant reduction of total RNA (supplemental Figure 6E), and these effects were increased in Che-1–depleted cells. On the contrary, Che-1 overexpression protected MM196 cells from the effect of this drug by counteracting the reduction of proliferation and total RNA (supplemental Figure 6F-G). In agreement with these findings, Che-1 expression strongly correlated with JQ1 resistance in several MM cell lines43 (supplemental Figure 6H), leading to hypothesize that Che-1 expression could play a role in the resistance mechanisms. To further investigate the correlation between Che-1 and BET inhibitors in MM, we used the Vk*Myc transgenic mouse model, which, through activating c-Myc oncogene in maturing B cells, induces MM transformation.36 CD138+ neoplastic cells were isolated from the bone marrow of these mice and transfected with siRNA Che-1 or siRNA control oligonucleotides. Recipient C57BL/6 mice were injected with transfected cells treated or not with JQ1. As shown in Figure 6D and 6E, Che-1 depletion significantly contributed to the sensitivity of JQ1 compared with single treatments in vivo. Altogether, these findings strongly suggest Che-1 inhibition as a therapeutic strategy for MM treatment, as a monotherapy or in combination to establish synergism with BET inhibitor activity.
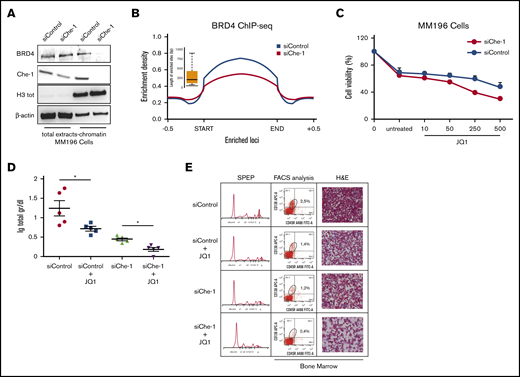
Che-1 depletion sensitizes MM cells to BET inhibitors. (A) Western blot (WB) analysis with the indicated antibodies of total cell extracts and chromatin extracts of MM196 cells nucleofected with siRNA control (siControl) or siRNA Che-1 (siChe-1) oligonucleotides. (B) Enrichment density of BRD4 ChIP-seq significant peaks identified in siControl (blue) and siChe-1 (yellow) samples. Enrichment density was calculated on the relative size of each peak extended 500 bp upstream and downstream. (C) JQ1 sensitivity of MM196 cells nucleofected as in A calculated by measurement of cell viability after 72 hours of treatment with JQ1 (10, 50, 250, or 500 nM). Error bars represent the standard deviation of triplicate experiments. (D) Total levels of serum Ig in recipient C57BL/6J mice transplanted with CD138+ MM cells isolated from bone marrow of Vk*Myc mice, transfected with siChe-1 or siControl oligonucleotides and treated with 100 nM JQ1 for 2 days. In vivo treatment with JQ1 (or vehicle control) was initiated at day 10 after transplantation. *P < .0001. (E) Representative serum protein electrophoresis (SPEP) (left), fluorescence-activated cell sorter (FACS) analysis (middle), and bone marrow hematoxylin and eosin (H&E) analysis (right) of recipient C57BL/6J mice transplanted and treated as in D. Scale bar, 100 μm. See also supplemental Figure 6.
Che-1 depletion sensitizes MM cells to BET inhibitors. (A) Western blot (WB) analysis with the indicated antibodies of total cell extracts and chromatin extracts of MM196 cells nucleofected with siRNA control (siControl) or siRNA Che-1 (siChe-1) oligonucleotides. (B) Enrichment density of BRD4 ChIP-seq significant peaks identified in siControl (blue) and siChe-1 (yellow) samples. Enrichment density was calculated on the relative size of each peak extended 500 bp upstream and downstream. (C) JQ1 sensitivity of MM196 cells nucleofected as in A calculated by measurement of cell viability after 72 hours of treatment with JQ1 (10, 50, 250, or 500 nM). Error bars represent the standard deviation of triplicate experiments. (D) Total levels of serum Ig in recipient C57BL/6J mice transplanted with CD138+ MM cells isolated from bone marrow of Vk*Myc mice, transfected with siChe-1 or siControl oligonucleotides and treated with 100 nM JQ1 for 2 days. In vivo treatment with JQ1 (or vehicle control) was initiated at day 10 after transplantation. *P < .0001. (E) Representative serum protein electrophoresis (SPEP) (left), fluorescence-activated cell sorter (FACS) analysis (middle), and bone marrow hematoxylin and eosin (H&E) analysis (right) of recipient C57BL/6J mice transplanted and treated as in D. Scale bar, 100 μm. See also supplemental Figure 6.
Discussion
Mounting evidence shows that alterations (loss-of-function or gain-of-function) in factors and enzymes able to affect transcription and genome stability by modifying the chromatin state are frequently associated with transformation, in both solid and hematologic tumors,44,45 thus contributing to the “transcriptional addiction” observed in cancer.46,47 In particular, several studies have reported a close correlation between chromatin activation and MM pathogenesis,5,6,8-11 and specific inhibitors of BET proteins showed significant efficacy in preclinical MM models.48-50 In the current study, we provide evidence that Che-1 is required for the proliferation of MM cells by sustaining histone acetylation and “active chromatin.” We describe a correlation between Che-1 expression and global histone acetylation in several patients with MM and show that histone acetylation reduction occurs in response to Che-1 inhibition. We also show that Che-1 competes with HDACs for histone binding. Strikingly, we found that human Che-1 overexpression produces plasma cell transformation in transgenic mice. Finally, we provide evidence that Che-1 depletion enhances BET inhibitors activity in MM.
Similar to Che-1, both c-Myc and Chd1 proteins showed the ability to maintain a more open state of chromatin,51-53 thus suggesting a correlation between this activity and global transcription regulation. Of particular interest, we have recently shown that Che-1 is a direct target of c-Myc in B-cell precursor acute lymphoblastic leukemia.54 Because the expression of this oncogene has been found to be highly deregulated in MM,55 it can be hypothesized that this phenomenon could cause the increase of Che-1 expression levels observed during the progression of this disease. This hypothesis is also supported by the increased levels of endogenous Che-1 in the bone marrow of Vk*Che-1 mice (supplemental Figure 5J). Moreover, on the basis of these results, Che-1 can be considered a transcriptional effector of c-Myc, sustaining this oncogene as an amplifier of its transcriptional program.53,56 In addition, it is possible to hypothesize a positive regulatory loop between c-Myc and Che-1, and this c-Myc/Che-1 axis could actively contribute to the “transcriptional addiction” observed in MM.
In previous studies, we have shown that Che-1 competes with HDAC1 for binding with pRb or Sp1, inducing histone acetylation and transcription at specific promoters.13,19 The results described in this study can therefore provide a model in which Che-1 performs a more general action, competing with class I HDACs for binding to histones and globally suppressing their deacetylation. Moreover, the observation that Che-1 inhibition results in a general decrease in histone acetylation is in agreement with competing with class I HDACs, as these enzymes, unlike the different acetylases, have shown a relaxed specificity.57
We report the generation of a mouse model in which the specific overexpression of Che-1 in plasma cells induces the development of MM. Compared with control plasma cells, tumor cells from Vk*Che-1 mice exhibited chromatin activation and a global increase in gene transcription. These results are consistent with recent findings that show chromatin activation and numerous alterations of specific super-enhancers in MM.11,42
Together, our results enable us to propose a model in which Che-1 plays an important role in regulating transcription, competing with HDACs for histone binding, and favoring in such way global histone acetylation and chromatin activation (Figure 7). In this context, and in response to different cellular stimuli, specific posttranslational modifications of this protein could regulate its interactions with transcriptional factors and its presence in regions of active transcription. Moreover, the elevated expression of Che-1 observed in MM could confer a proliferative advantage to cancer cells, sustaining important functions such as autophagy.23 Finally, our data indicate that the presence of Che-1 is required for BRD4 activity, and Che-1 inhibition increases the activity of the BET inhibitor JQ1. For this reason, further experiments are needed to better understand the mechanisms regulating these 2 important modulators of transcription, but our results unquestionably reinforce the concept of Che-1 as a putative therapeutic target for anticancer therapy.
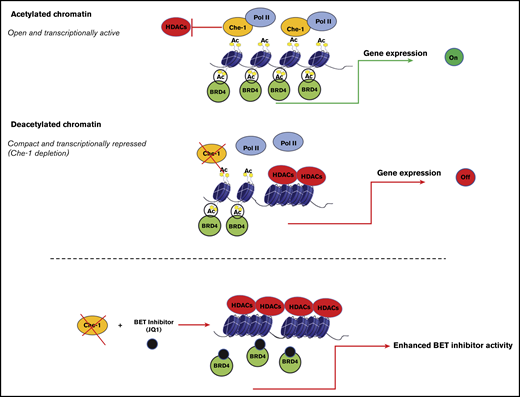
Model explaining how Che-1 sustains chromatin accessibility. Che-1 competition with HDAC1 for histone binding allows their higher acetylation, thus favoring a more open chromatin status, and activation of transcription (top). Che-1 depletion decreases BRD4 recruitment onto DNA and enhances JQ1 antiproliferative activity (bottom).
Model explaining how Che-1 sustains chromatin accessibility. Che-1 competition with HDAC1 for histone binding allows their higher acetylation, thus favoring a more open chromatin status, and activation of transcription (top). Che-1 depletion decreases BRD4 recruitment onto DNA and enhances JQ1 antiproliferative activity (bottom).
High-throughput sequencing data (RNA-seq, ChIP-seq, ATAC-seq) from this publication have been submitted to the National Cancer Center for Biotechnology Information Gene Expression Omnibus database (https://www.ncbi.nlm.nih.gov/geo; accession number GSE149031). All other data supporting the findings of this study are available from the corresponding authors on reasonable request.
Acknowledgments
These data were generated as part of the Multiple Myeloma Research Foundation Personalized Medicine Initiatives (https://research.themmrf.org and www.themmrf.org).
The authors thank Federica Lo Sardo for her technical help, Iros Barozzi for precious advice on ChIP-seq analysis, Giulio Pavesi for the thorough explanation of Pscan-ChIP, Mattia D’Antonio for the support of the spike-in module on the RAP pipeline, and Josè Manuel Garcia Manteiga for the valuable discussion on ATAC-seq. The authors also thank Katherine Melanie Schächter and Tania Merlino for the English revision of the paper, Mauro Biffoni and Alessandra Boe for their help in fluorescence-activated cell sorter analyses, and Stefano Scalera and Sara D’Errigo for their assistance with the bioinformatics analyses. The transgenic DNA vector for the production of Vk*Che-1 mice was a kind gift from Marta Chesi (Mayo Clinic, Phoenix, AZ).
The authors acknowledge the CINECA award under the ISCRA initiative, for the availability of high-performance computing resources and support (project: IscrC_ROCIMM). This work was supported by the Italian Association for Cancer Research (AIRC) (15255 [M.F.] and 14455 [G. Blandino]). G. Corleone has received funding from AIRC and from the European Union’s Horizon 2020 research and innovation program under the Marie Skłodowska-Curie grant agreement No. 800924.
Authorship
Contribution: T.B., V.C., and C.S. performed most of the experiments and analyzed data; F.D.N. and F.G. performed RNA-seq, ATAC-seq, and ChIP-seq analyses; G. Corleone and M.P. performed the bioinformatics and statistical analyses; A.B. and U.G. conducted the IHC analysis; G. Bossi produced the MM-inducible cell lines; G. Cigliana conducted the serum electrophoresis analysis; B.A., G. Cortese, and E.P.S. performed experiments in Vk*Myc mice; E.M. isolated MEF cells from these animals and generated Vk*Che-1 mice; F.P., L.B., S.G., A.M., M.R.R., and M.T.P. provided patient material; B.V. performed Kaplan-Meier analysis; M.C. performed fluorescence-activated cell sorter experiments and analyzed patient data; R.M. purified CD138+ cells from patient bone marrow samples; C.P. cloned human Che-1 in transgene vector and participated in data analysis; S.I. performed many experiments and participated in writing the manuscript; K.H., T.B., A.F., and G. Blandino participated in data analysis and in writing the manuscript; M.F. conceived the project, obtained funding, supervised the experiments and wrote the manuscript; and all the authors discussed the experiments and contributed to the text of the manuscript.
Conflict-of-interest disclosure: The authors declare no competing financial interests.
Correspondence: Simona Iezzi, SAFU Laboratory, Department of Research, Advanced Diagnostics, and Technological Innovation, Translational Research Area, IRCCS Regina Elena National Cancer Institute, Via E. Chianesi 53, 00144 Rome, Italy; e-mail: simona.iezzi@ifo.gov.it; or Maurizio Fanciulli, SAFU Laboratory, Department of Research, Advanced Diagnostics, and Technological Innovation, Translational Research Area, IRCCS Regina Elena National Cancer Institute, Via E. Chianesi 53, 00144 Rome, Italy; e-mail: maurizio.fanciulli@ifo.gov.it.

