

Key Points
Forty-nine percent of relapses after CAR T-cell treatment in relapsed/refractory DLBCL occur within the first month.
Risk factors for early progression are extranodal sites ≥2, increased CRP, and high TMTV at the time of treatment.

Abstract
Chimeric antigen receptor (CAR) T-cell therapy has emerged as an option for relapsed/refractory aggressive B-cell lymphomas that have failed 2 lines of therapy. Failures usually occur early after infusion. The purpose of our study was to identify factors that may predict failure, particularly early progression (EP), within the first month after infusion. Characteristics of 116 patients were analyzed at the time of decision (TD) to use commercial CAR (axicabtagene ciloleucel, n = 49; tisagenlecleucel n = 67) and at the time of treatment (TT), together with total metabolic tumor volume (TMTV) at TT. With a median follow-up of 8.2 months, 55 patients failed treatment; 27 (49%) were early progressors. The estimated 12-month progression-free survival (PFS) and overall survival (OS) were 47.2% (95% confidence interval [CI], 38.0-58.6) and 67.0% (95% CI, 57-79), respectively. Univariate analyses for PFS and OS identified Eastern Cooperative Oncology Group Performance Status (ECOG PS) ≥2, stage III/IV disease, extranodal (EN) sites ≥2, elevated lactate dehydrogenase (LDH), increased C-reactive protein (CRP), high International Prognostic Index at TD and at TT, as well as increased CRP, bulky mass, and high TMTV at TT, as risk factors. Multivariate analyses for PFS, EP, and OS identified elevated LDH and EN sites ≥2 at TD and the same predictors at TT (ie, increased CRP, EN sites ≥2, and TMTV >80 mL). In summary, risk factors identified for early progression at TD and at TT were EN involvement (≥2 sites) and lymphoma burden (LDH, TMTV).
Introduction
Diffuse large B-cell lymphoma (DLBCL) and other non-Burkitt aggressive B-cell non-Hodgkin lymphomas (NHLs) are curable with front-line immunochemotherapy. However, patients with relapsed/refractory (R/R) disease face poor outcomes.1 Patients who are unable to achieve a response to second-line treatment, including platinum-containing salvage regimens, or who relapse after high-dose therapy and autologous stem cell transplantation had limited options prior to the approval of CD19-specific chimeric antigen receptor (CAR) T-cell therapy.2,3 Axicabtagene ciloleucel (axi-cel) and tisagenlecleucel (tisa-cel) have been approved by the US Food and Drug Administration for patients having received ≥2 prior lines of therapy for most aggressive B-cell NHLs.4,5 Data from pivotal trials suggest durable complete response (CR) rates around 30% to 40%, particularly for individuals with early CR.4-6
Little is known regarding the factors associated with nonresponse to CAR T-cell therapy. The identification of such factors may help to better select patients who will respond. Jacobson et al recently presented a real-world experience of patients with R/R DLBCL treated with axi-cel.7 In this series, low C-reactive protein (CRP) levels at day 0, associated with high absolute lymphocyte count at apheresis or low peak ferritin, was predictive of response to axi-cel and was highly predictive of patient groups with significantly superior survival.7 No correlation was found between patient response to axi-cel and International Prognostic Index (IPI), cell of origin, double/triple-hit cytogenetics, prior lines of therapy, bridging therapy, eligibility for ZUMA-1, high-grade cytokine release syndrome or neurotoxicity, or tocilizumab or steroid. However, inferior patient outcomes were linked to poor performance status and increased tumor bulk (>5 cm). In the JULIET trial, it has been reported that preinfusion elevated lactate dehydrogenase (LDH) was associated with poor outcome in patients receiving tisa-cel.8
In clinical practice, treatment decisions are based on patient factors, including age, comorbidities, and the aggressiveness of the disease. Markers predicting adverse outcome include bulky disease, high IPI, and biological features, such as double/triple-hit cytogenetics or overexpression of MYC and BCL2 proteins. The use of imaging techniques, such as fluorodeoxyglucose (FDG) positron emission tomography (PET)/computed tomography (CT), allows accurate determination of the anatomic extent and volume of the lymphoma. The baseline total metabolic tumor volume (TMTV), the sum of lesional volume on 18 FDG PET/CT, has been identified as 1 of the most accurate parameters associated with an adverse prognosis in DLBCL.9-11 In terms of biology, the germinal center (GC) B/activated B-cell cell-of-origin classification of DLBCL12 and its surrogate immunohistochemical algorithm, named GC/non-GC,13 as well as molecular heterogeneity14 has been associated with prognosis and is now recognized to provide therapeutic targets.
In this cohort study, we aimed to identify the clinical, biological, and imaging characteristics at the time of decision (TD) to proceed to CAR T-cell therapy, as well as at the time of infusion, that could predict relapse or progression and death in patients with R/R DLBCL.
Patients and methods
Study population
The study population included all consecutive patients presenting with R/R DLBCL treated in 5 French Lymphoma Study Association (LYSA) centers with commercialized anti-CD19 CAR T-cell therapy, tisa-cel (n = 67) or axi-cel (n = 49), between June 2018 and January 2020, with ≥1 response assessment at month 1, or before if progression. Real-world data were retrospectively collected from medical charts in these 116 patients by the treating physician. Histologic diagnoses were reviewed by expert pathologists (V.M. and C.B.). All patients were first screened in each CAR T-cell center to check the eligibility for the procedure (TD), with a median of 48 days of delay between TD and CAR infusion (including leukapheresis, bridging therapy, assessment of bridge efficacy). The lymphodepletion preconditioning prior to CAR T-cell infusion was performed according to manufacturer recommendations at the time of treatment (TT).
Clinical data and therapeutic evaluation
Patient disease characteristics, at TD and TT, including individual components of the IPI, CRP, ferritin, albumin, and lymphocyte count, were collected. The type of bridging, time for the manufacturing procedure, and survival data, were recorded. Progression-free survival (PFS) was defined according to revised National Cancer Institute criteria. Imaging evaluation was performed on each patient at TT. TMTV, evaluated on 18 FDG-PET, and tumor bulk, measured on CT, were analyzed at TT, after the last bridging treatment, if any, and before starting the lymphodepletion therapy.
At the TT with lymphodepletion and CAR T-cell infusion, PET imaging data, in an anonymized Digital Imaging and Communications in Medicine format, were collected for functional parameter measurements. Analysis of imaging data was performed by senior nuclear medicine physicians (L.V., C.B.-M., S.K., and P.O.) blinded to patient outcomes. Response was scored according to Lugano 2014 criteria at month 1, and then every 3 months for the first year, every 6 months for the second year, and then annually.15
Method for TMTV measurement
TMTV was computed with the 41% maximum standardized uptake value threshold method, as recommended by the European Association of Nuclear Medicine and published for various lymphoma subtypes.16 TMTV was measured by each center, as previously described9,11 ; briefly, using the free semiautomatic software Beth Israel Fiji20 (http://petctviewer.org),17 the regional volumes were automatically identified and checked by visual assessment to confirm inclusion of only pathological lesions. PET images were scaled to a fixed SUV display and color table. TMTV was obtained by summing the metabolic volumes of all local nodal and extranodal (EN) lesions.18,19 Bone marrow involvement was included in volume measurement, only if there were focal uptake. Spleen was considered involved and included if there were focal uptake or diffuse uptake >150% of the liver background.
Definition of relapse
Relapse or progression after CAR T-cell infusion was defined using Cheson criteria published in 2014 based on CT scan and 18 FDG-PET/CT.15 Because hypermetabolism on PET may be associated with inflammation as a result of expansion of CAR T cells, biopsy of the FDG-avid site of involvement was done if technically feasible. Histologically proven relapse/progression was identified in 26 of 55 (57.27%) patients. For patients not undergoing biopsy, the necessity of specific antilymphoma therapy treatment defined the lymphoma progression. Early progression was defined as progression within the first month after the CAR T-cell infusion.
Statistical analysis
Summary statistics (ie, median, interquartile range, and percentages) are reported. PFS was measured from the date of CAR T-cell infusion to the date of death from any cause, disease relapse, or progression or the date of last contact. Overall survival (OS) was calculated from the date of CAR T-cell infusion until the date of death from any cause or the date of last contact. OS and PFS were estimated using the Kaplan-Meier method. A Cox proportional-hazards model with a stepwise selection procedure was used to select prognostic covariates, based on their statistical significance (P < .05) on univariate analyses. We used splines to check the log-linearity assumption for continuous variables or identify cutoff levels otherwise. Proportional hazards assumption was checked using the Grambsch and Therneau statistics. Given the absence of censoring within the first month, analysis of predictors for early relapse (within 1 month) was based on univariate and then multivariable logistic regression models. Area under the receiver operating characteristic curve and Hosmer-Lemeshow statistics were computed as measures of model performances. The optimal cutoff point for TMTV41% for prediction of relapses and deaths was chosen based on Youden’s index, which is identical (from an optimization point of view) to maximizing the sum of sensitivity and specificity20 and to maximizing the concordance, which is a monotone function of the area under the receiver operating characteristic curve. All values with 2-sided P < .05 were considered statistically significant. All statistical analyses were performed using R (R Foundation for Statistical Computing).
Ethics and consent
This research was approved by the local ethics committee. Patients or their representatives provided written informed consent to the use of personal data.
Results
Characteristics of the population
A total of 116 patients was enrolled and received CAR T cells from June 2018 to March 2020 in 5 French centers. At TD, median age was 60.7 years (interquartile range [IQR], 49.2-67.6); 42 (36%) patients were older than 65 years. Most patients presented with a good Performance Status (PS; 0 or 1) (n = 104; 90%) and disseminated disease (stage III/IV, n = 89; 77%), with >2 EN sites in 33 (28%) patients. Elevated LDH was present in 55 (47%) patients. IPI was low in 35 (30.2%) patients, low-intermediate in 36 (31%) patients, high-intermediate in 28 (24%) patients, and high in 17 (14%) patients (supplemental Table 1). Lymphoma subtypes were DLBCL (80.17%), primary B-cell lymphoma (PMBL; 5.2%), and transformed follicular lymphoma (FL; 14.7%) and were classified as primary refractory in 66% of patients (77/106). Thirty-four (30%) had been treated with >4 prior lines, including high-dose therapy plus autologous stem cell transplantation in 33 (29%) patients and allograft in 3 other patients.
Characteristics of the procedure, including bridging therapy
Table 1 reports the characteristics of the procedure. Tisa-cel was infused in 49 (42%) patients, and axi-cel was given to 67 (58%) patients. Median time from decision and apheresis was 9 days (IQR, 5.5-16.5), and the median time between apheresis and infusion was 40 days (IQR, 36-45).
Characteristics of patients at TT, including lymphodepletion and CAR T-cell infusion according to relapse
| Nonrelapse (n = 61) | Relapse (n = 55) | HR (95% CI) | P | |
|---|---|---|---|---|
| Age ≥65 y | 24 (39) | 18 (33) | 0.74 (0.41 -1.33) | .24 |
| Males | 36 (59) | 39 (71) | 1.79 (0.97-3.29) | .06 |
| Lymphoma | ||||
| DLBCL | 44 (72) | 49 (89) | 1.00 | |
| PMBL | 3 (5) | 3 (6) | 0.92 (0.28-2.96) | .89 |
| Transformed FL | 14 (23) | 3 (5) | 0.34 (0.11-1.10) | .07 |
| BCL2 expression >70%, n | 14 | 5 | 0.60 (0.23-1.53) | .29 |
| MYC expression, n | ||||
| >40% | 10 | 11 | 1.07 (0.43-2.66) | .88 |
| >80% | 2 | 6 | 1.82 (0.66-5.08) | .25 |
| Missing data | 42 | 34 | ||
| Primary refractory | 42 (64) | 35 (70) | 1.19 (0.42-3.35) | .74 |
| Prior lines (IQR), n | 3 (2-4) | 3 (2-4) | 0.99 (0.82-1.18) | .89 |
| Prior lines ≥4 | 18 (29) | 16 (29) | 1.06 (0.59-1.90) | .85 |
| Prior autograft | 18 (29) | 15 (27) | 0.84 (0.46-1.52) | .56 |
| ECOG PS | ||||
| 0 | 30 (49) | 20 (36) | 1.00 | |
| 1 | 27 (44) | 25 (45) | 1.37 (0.77-2.44) | .28 |
| 2 | 4 (7) | 10 (18) | 2.05 (0.87-4.84) | 0.10 |
| Ann Arbor | ||||
| Stage 0-I-II | 20 (33) | 7 (13 | ||
| Stage III | 6 (10) | 7 (13) | 1.00 | |
| Stage IV | 35 (57) | 41 (75) | 1.96 (1.05-3.66) | .034 |
| EN sites (IQR), n | 1 (0-1) | 1 (1-2) | 1.54 (1.26-1.90) | <.0001 |
| EN sites ≥2 | 10 (16) | 23 (42) | ||
| Elevated LDH at day 0 | 21 (34) | 34 (62) | 4.03 (2.34-6.94) | <.0001 |
| IPI | ||||
| Low IPI | 24 (39) | 12 (22) | 0.21 (0.09-0.49) | <.0001 |
| Low-intermediate IPI | 20 (33) | 15 (27) | 0.28 (0.13-0.63) | .002 |
| High-intermediate IPI | 13 (21) | 15 (27) | 0.51 (0.24-1.10) | .086 |
| High IPI | 4 (6) | 13 (24) | 1.00 | |
| R-IPI | ||||
| Very good R-IPI | 8 (13) | 2 (4) | 0.25 (0.03-1.88) | .18 |
| Good R-IPI | 36 (59) | 25 (45) | 1.00 | |
| Poor R-IPI | 17 (28) | 28 (51) | 2.91 (1.66-5.11) | .0002 |
| CRP at day 0 >30 mg/L | 8 (13) | 29 (57) | 5.57 (3.10-10.0) | <.0001 |
| Bulky mass >5 cm | 20 (33) | 34 (62) | 2.83 (1.62-4.93) | .0003 |
| Bulky mass >10 cm | 5 (8) | 10 (18) | 1.80 (0.87-3.68) | .11 |
| Time between enrollment and apheresis (IQR), d | 10 (7-18) | 7 (3.5-13.5) | 1.00 (0.99-1.01) | .83 |
| Time between apheresis and delivery (IQR), d | 31 (29-34) | 35 (29-38) | 1.00 (0.98-1.01) | .58 |
| Time between delivery and infusion (IQR), d | 7 (6-8.5) | 7 (5-8) | 1.00 (0.95-1.04) | .72 |
| CAR T-cell | .005 | |||
| Kymriah | 16 (26) | 33 (60) | 1.00 | |
| Yescarta | 45 (74) | 22 (40) | 0.47 (0.27-0.60) | |
| Bridging therapy | 47 (77) | 54 (98) | 10.2 (1.42-74.1) | .021 |
| Type of bridging therapy | .006 | |||
| High | 35 (57) | 43 (78) | 1.00 | |
| Low | 26 (43) | 12 (22) | 0.39 (0.20-0.76) | |
| Cycles during bridging therapy, median (range), n | 1.5 (1-2) | 2 (2-3) | 1.51 (1.20-1.91) | .0005 |
| Status at infusion | ||||
| Partial response | 12 (20) | 10 (18) | 1.00 | |
| Stable disease | 16 (26) | 2 (4) | 0.26 (0.06-1.24) | .092 |
| Progressive disease | 33 (54) | 43 (78) | 1.98 (0.93-4.22) | .076 |
Unless otherwise noted, data are n (%). TT includes lymphodepletion and CAR T-cell infusion.
CI, confidence interval; ECOG, Eastern Cooperative Oncology Group; R-IPI, revised IPI.
Between apheresis and lymphodepletion, 87% of patients received bridging therapy with a median of 2 cycles (range, 1-4; IQR, 1-2). Bridging therapy consisted of various immunochemotherapy or chemotherapy regimens for 72 (62%) patients, including ifosfamide-VP16 with or without rituximab, ifosfamide-cyclophosphamide-etoposide with or without brentuximab vedotin, gemcitabine-oxaliplatin-rituximab, ifosfamide-cyclophosphamide-etoposide-rituximab, and vinorelbine. Twenty-two patients received immunotherapy, including rituximab, rituximab-dexamethasone, brentuximab vedotin, or lenalidomide. One patient received radiotherapy, and 1 patient received corticosteroids only. Because of lymphoma progression, 31% (31/101) received >1 line of bridging therapy. At the end of bridging, 76 (65.5%) patients were evaluated as having progressive disease, and 18 (15.5%) had stable disease.
Characteristics of the patients at TT
At TT, 12% of patients presented with Eastern Cooperative Oncology Group (ECOG) PS2. Ann Arbor stage III/IV disease,2 EN sites, and elevated LDH at infusion (day 0) were present in 75%, 32%, and 32.5% of patients, respectively. IPI was scored as high in 16% of patients, and revised IPI (R-IPI) was scored as poor in 46% of patients. Tumor size was classified as bulky >5 cm or >10 cm in 46.5% and 13% of patients, respectively. Median TMTV was 52.2 mL (IQR, 15.72-179). At the day of infusion (day 0), median lymphocyte count was 0.05 G/L (IQR, 0-0.350), median albumin was 38 g/L (IQR, 33-40), and median ferritin was 682 µg/L (IQR, 353-1218). Table 1 describes the characteristics of patients according to relapse.
Description of progression or relapse and predictive factors with associated progression or relapse
Overall, 55 patients relapsed. All but 1 relapse occurred between day 4 and 4 months after infusion (median, 30.5 days), with 27 (49%) events within the first month and 1 delayed relapse at 1 year. Two patients died free from relapse or progression at 7.5 and 12 months. Median PFS was estimated as 7.4 months (95% confidence interval [CI], 3.0–not available) (Figure 1).
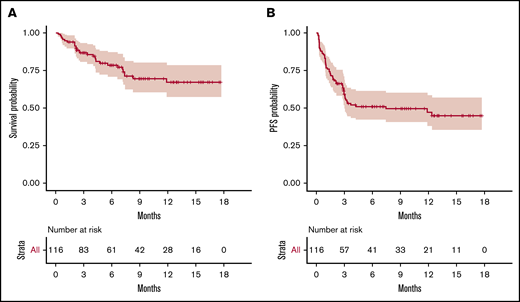
OS and PFS of the 116 patients treated with commercialized CAR T cells (tisa-cel, n = 49; axi-cel, n = 67). (A) OS probability. (B) PFS probability.
OS and PFS of the 116 patients treated with commercialized CAR T cells (tisa-cel, n = 49; axi-cel, n = 67). (A) OS probability. (B) PFS probability.
Results of univariate analyses are summarized in Table 1. At TD, poor PS, elevated LDH, Ann Arbor stage III/ IV disease, high IPI, and poor R-IPI were associated with a higher risk for relapse. At TT, elevated LDH at day 6 and at day 0, CRP, low albumin, high ferritin, high IPI and poor R-IPI, and tumor size measured on CT scan with diameter at >5 cm or at >10 cm, or tumor volume evaluated by TMVT41, were predictive factors for relapse. Age and lymphoma subtypes were not associated with any increase in progression risk.
Predictive factors associated with early progression (occurring before the first month)
Among the patients who failed treatment, 49% of failures occurred during the first month after infusion. This prompted us to identify the predictive factors specifically associated with early relapse or progression. In univariate analysis, parameters predictive of early relapse were identical to those predicting relapse, with the exception of PS at TD and ferritin at TT.
The TMTV cutoff associated with early progression was 80 mL. Based on this cutoff, 21 of the 27 early relapses were correctly predicted (ie, a sensitivity of 78%), whereas 60 of the 88 nonprogressing patients were also correctly predicted.
OS and predictive factors of death related to lymphoma
Overall, 29 patients died, including 27 after disease progression/relapse. Two died of a cause other than lymphoma at 7.5 and 12 months. The estimated 6-month and 12-month survival rates were 78.5% (95% CI, 71-87) and 67% (95% CI, 57-79), respectively (Figure 1).
Univariate prognostic analyses selected male sex. At TD, ECOG PS ≥2, elevated LDH, number of EN sites ≥2, high IPI, and high R-IPI were identified risk factors. At TT, risks were elevated LDH, low lymphocyte count and albumin, high levels of ferritin and CRP, and bulky mass measured with the diameter at >5 cm or >10 cm or evaluated using TMTV (41%) (TMTV41%).
With regard to TMTV, the optimal cutoff for discriminating survival was 55 mL, with 24 of 29 deaths and 56 of 86 survivors correctly predicted (sensitivity of 83%, specificity of 65%). Using 80 mL as previously, the sensitivity and specificity were 72% and 67%, respectively.
Multivariate analyses
We performed 2 multivariate analyses considering 2 different time points in the CAR T-cell journey: (1) including only the parameters measured at the TD where the patients are selected for the CAR T-cell procedure, and (2) including the same parameters at the time of effective treatment (TT) (reinfusion of the product) (Table 2).
Multivariate analysis of parameters at TD and TT, including lymphodepletion and CAR T-cell infusion
| Relapse HR (95% CI) | Early relapse HR (95% CI) | Death HR (95% CI) | |
|---|---|---|---|
| Parameters at TD | |||
| Age ≥65 y | |||
| Lymphoma subtypes (DLBCL, PMBL, FL) | |||
| GC/non-GC | |||
| ECOG PS ≥2 | 2.95 (1.03-8.45); P = .044 | ||
| B symptoms | 1.85 (1.01-3.41); P = .0470 | ||
| Elevated LDH | 2.04 (1.19-3.49); P = .00933 | 9.61 (1.23-75.41); P = .031 | |
| Ann Arbor stage III/IV | |||
| EN sites ≥2 | 4.17 (1.99-8.72); P = .000148 | ||
| IPI high vs other | |||
| R-IPI poor vs other | |||
| Parameters at TT | |||
| Age >65 y | |||
| Males | |||
| ECOG PS | |||
| Ann Arbor stage III /IV | |||
| EN sites ≥2 | 2.50 (1.44-4.35); P = .00111 | 4.67 (1.55-14.11); P = .0063 | 3.61 (1.55-8.38); P = .00283 |
| IPI high vs other | |||
| R-IPI poor vs other | |||
| Progressive disease at infusion | |||
| High bridging therapy | |||
| Elevated LDH | |||
| CRP | 1.12 (1.07-1.17); P < .0001 | 1.15 (1.03-1.29); P = .016 | 1.12 (1.06-1.17); P < .0001 |
| Ferritin | |||
| Albumin | |||
| Lymphocytes | |||
| Bulky mass >5 cm | |||
| TMTV41% >80.42 mL | 2.18 (1.23-3.89); P = .00794 | 4.35 (1.32-14.37); P = .016 | 3.41 (1.41-8.26); P = .00651 |
HR, hazard ratio; OR, odds ratio.
At TD, independent factors of relapse were B symptoms and elevated LDH; for early relapses, independent factors were elevated LDH and number of ECOG PS ≥2, despite the subsequent attempt to improve outcomes with a bridging therapy.
At TT, the independent factors predicting relapse and early relapse were the number of EN sites >2, high CRP, and TMTV >80 mL; the highest hazard ratio was for the number of extranodal sites ≥2 and TMTV.
We then considered 3 groups of patients, based on the number of EN sites ≥2 and metabolic volume >80 mL, and classified them as having 0, 1, or 2 parameters. This allowed us to discriminate 3 prognostic (PFS and OS) groups, even more distinctly than with R-IPI (Figure 2). Although the IPI failed to discriminate patients with a very good prognosis (only 6 patients), our model was able to differentiate 3 well-balanced groups with equivalent performance, making it a better suited risk classifier for CAR T-cell strategies.

PFS and OS considering 3 groups of patients (ie, patients with EN sites ≥2 and TMTV >80 mL, those presenting neither of these parameters, or those presenting only 1 parameter compared with discrimination by the R-IPI. Our model is able to differentiate 3 well-balanced groups with equivalent performance. (A) PFS. (B) OS.
PFS and OS considering 3 groups of patients (ie, patients with EN sites ≥2 and TMTV >80 mL, those presenting neither of these parameters, or those presenting only 1 parameter compared with discrimination by the R-IPI. Our model is able to differentiate 3 well-balanced groups with equivalent performance. (A) PFS. (B) OS.
Discussion
In this multicenter cohort of patients with R/R DLBCL treated with commercial CAR T cells, we aimed to predict progression, early progression (occurring during the first month), and death using factors measured at TD (ie, patients’ selection) and at TT (ie, product infusion), separately. The most significant prognostic markers analyzed were related to the lymphoma, including the EN extension and the metabolic activity of the lymphoma. Among these parameters, high TMTV was 1 of the most discriminative factors of outcome, especially for predicting early relapse. In comparison, bulky mass, defined as a diameter >5 cm or >10 cm, did not independently predict progression or relapse (data not shown). Using the TMTV41% method, the optimal threshold for early relapse, in terms of false-positive and false-negative predictions, in our series was 80 mL. The putative prognostic impact of TMTV in patients treated with CAR T cells has been suggested in a series of only 19 patients,21 in which TMTV tended to be lower in responding patients. Interestingly, median TMTV in this study was 72 mL and, thus, very close to our own data. In another series with only 7 patients, metabolic response assessed at 1 month was correlated with long-term survival.22 To our knowledge, our study is the first to emphasize the importance of TMTV evaluation to guide clinicians at the TD and at the time of infusion of CAR T cells. New biological classifications have emerged that are associated with distinct gene expression profiles, immune microenvironments, and therapeutic responses.14 It will be interesting to merge these multi-omics data with radiomics measures done by FDG-PET.
Interestingly, we could not determine a single factor associated specifically with early failure. However, combining high TMTV and number of EN sites ≥2, we were able to propose a risk model that was able to identify 3 groups of patients with significantly different outcomes. This model was fairly balanced and also more discriminatory than IPI and R-IPI scores, notably by identifying a group with very good prognosis.
For long-term PFS, parameters of extension of the disease and LDH level (a surrogate of metabolic tumor burden) were predictive at the time of treatment and at the TD (ie, early in the selection process of patients). In the recent report on the real-world data of the US Lymphoma CAR T Consortium by Nastoupil et al, elevated LDH and poor PS were associated with shorter PFS and OS on univariate and multivariate analyses.23 Those variables (IPI or LDH) that correlate with TMTV41% could appear to be good candidates for prognostication, avoiding the need for TMTV assessment; however, they lost their prognostic significance when introduced into the multivariate models, even in the place of TMTV. An international harmonization project is ongoing for routine TMTV measurement.24
One missing component of our analysis is the analysis of the product itself, the CAR T cells. Indeed, we could not imagine that the function of the CAR T cells, their expansion after infusion, and their persistence would not have major influences on the response to treatment. This has been well reported in acute leukemia but has been less well analyzed in NHL.25 However, this was not the objective of this study, which focused on the outcomes of those patients, regardless of the product available at the time of treatment decision. This should be analyzed in future studies, focusing on a comparison with an adequate sample size and causal inference methods of analyses to correct for potential confounding by indication bias.
Anti-CD19 CAR T-cell therapy presents a promising option for the treatment of R/R aggressive B-cell NHL. Early retrospective data from the commercial use of CAR T-cell therapy suggest that the efficacy and toxicity rates seen in early trials are maintained in a less stringently selected patient population than those eligible in clinical trials. Currently, there are no validated pretreatment clinical factors that are predictive of efficacy. Therefore, eligibility for the procedure is focused on assessing a patient’s ability to withstand the potential treatment-related toxicities, including baseline organ function and comorbidities (“toxicity-predicting factors”). These factors are usually based on expert assessment and collaborative group consensus, when deviations from clinical trial criteria are considered (such as the use of bridging therapy for instance). However, it is of utmost importance to identify those patients who are most likely to fail CAR T-cell therapy because of early relapse. Considering toxicity, as well as efficacy, will undoubtedly improve the outcome of these patients and the translational and clinical research in this field. Thus, our risk model should be evaluated in other centers, together with the discovery of new biomarkers.
In summary, this study highlights factors assessed at the TD and the TT that are associated with progression, early progression, and death after CAR T-cell therapy in patients with R/R DLBCL. Our risk model identifying early failure should assist in better selection of these patients for CAR T-cell therapy.
Data sharing requests should be sent to Catherine Thieblemont (e-mail: catherine.thieblemont@aphp.fr).
Acknowledgments
The authors thank the patients and their families, as well as all of the investigators and staff who were involved in data collection and analyses.
Authorship
Contribution: C.T. conceived and designed the study; C.T., L.V., R.D.B., S.C., and M.M. wrote the manuscript; and all authors provided study material or patients, assembled data, analyzed and interpreted data, approved the manuscript, and are accountable for all aspects of the work.
Conflict-of-interest disclosure: R.D.B. has served on advisory boards for and received honoraria from Gilead Sciences and Novartis. L.O. has served on an advisory board for and received honoraria from Janssen Pharmaceuticals outside of the submitted work. P.F. has received honoraria from, had travel accommodations paid by, and has acted in a consulting/advisory role for Roche/Genentech, Janssen Pharmaceuticals, Gilead Sciences, and AbbVie. S.L.G. has acted in an advisory role for and received honoraria from Celgene, Roche, Gilead Sciences, Epizyme, Bristol Myers Squibb, Bayer, and Novartis and has received honoraria from Janssen Pharmaceuticals. L.Y. has received honoraria from, had travel accommodations paid by, and has acted in a consulting/advisory role for Roche/Genentech, Janssen Pharmaceuticals, Gilead Sciences, and AbbVie. O.C. has received research funding from Roche, Takeda, and Gilead Sciences and has served on advisory boards for and received honoraria from Celgene, Roche, Takeda, Gilead Sciences, Bristol Myers Squibb, Merck, AbbVie, and Janssen Pharmaceuticals outside of the submitted work. C.T. has received honoraria from Roche, Amgen, Janssen Pharmaceuticals, Celgene, and Gilead Sciences/Kyte; has acted in a consulting/advisory role from Roche, Gilead Sciences, Janssen Pharmaceuticals, Celgene, and Novartis; and has received research funding from and had travel, accommodation, and expenses paid by Roche and Novartis. The remaining authors declare no competing financial interests.
Correspondence: Catherine Thieblemont, AP-HP, Hôpital Saint-Louis, Hemato-Oncologie, 1 Av Claude Vellefaux, 75010 Paris, France; e-mail: catherine.thieblemont@aphp.fr; and Michel Meignan, LYSA Image, Hôpital Henri Mondor, 51 Av Maréchal de Lattre de Tassigny, 94010 Créteil, France; e-mail: michel.meignan-ext@aphp.fr.

