

Key Points
Mogamulizumab exerted clinically meaningful antitumor activity in adult T-cell leukemia-lymphoma.
The patient’s immunological status before mogamulizumab was significantly associated with the treatment outcome.

Abstract
Monitoring of Immune Responses Following Mogamulizumab-Containing Treatment in Patients with Adult T-Cell Leukemia-Lymphoma (ATL) (MIMOGA) is a multicenter prospective observational study to establish the most effective and safe treatment strategy using mogamulizumab for ATL patients (UMIN000008696). Mogamulizumab-naive patients were enrolled (n = 102), of whom 101 received mogamulizumab-containing treatment (68 acute, 18 lymphoma, 12 chronic, and 3 smoldering subtypes). At enrollment, there was a significant inverse correlation between serum soluble interleukin-2 receptor (sIL-2R) levels and percentages of Tax-specific cytotoxic T lymphocytes (Tax-CTLs) in the entire lymphocyte population or in the CD8+ T cell subset, but there was not a correlation with cytomegalovirus pp65–specific cytotoxic T lymphocytes (CMV-CTLs). The overall response rate was 65%, and median progression-free survival and overall survival (OS) were 7.4 and 16.0 months, respectively. A higher percentage of Tax-CTLs, but not CMV-CTLs, within the entire lymphocyte population or in the CD8+ T cell subset was significantly associated with longer survival. Multivariate analysis identified the clinical subtype (acute or lymphoma type), a higher sIL-2R level, and a lower percentage of CD2−CD19+ B cells in peripheral blood mononuclear cells as significant independent unfavorable prognostic factors for OS. This indicates that a higher percentage of B cells might reflect some aspect of a favorable immune status leading to a good outcome with mogamulizumab treatment. In conclusion, the MIMOGA study has demonstrated that mogamulizumab exerts clinically meaningful antitumor activity in ATL. The patient’s immunological status before mogamulizumab was significantly associated with treatment outcome. Further time series immunological analyses, in addition to comprehensive genomic analyses, are warranted.
Introduction
CCR4 is expressed by tumor cells from most patients with adult T-cell leukemia-lymphoma (ATL),1,2 as well as by a subgroup of patients with peripheral T-cell lymphoma.3,4 Mogamulizumab is a defucosylated humanized antibody that kills CCR4+ cells by enhanced antibody-dependent cellular cytotoxicity (ADCC).5-7 Mogamulizumab was approved for the treatment of relapsed/refractory ATL in 2012, and it was approved for newly diagnosed ATL in 2014 in Japan.8,9 However, mogamulizumab-induced adverse events (AEs), such as severe skin disorders or viral infection, have been found to be clinically problematic.10-12 On the other hand, quite puzzlingly, moderate skin-related AEs after mogamulizumab were associated with a favorable prognosis.13,14 These AEs are considered to be associated with the depletion of CCR4+ cells,15,16 especially regulatory T cells (Tregs),17,18 but data on the detailed immune alterations resulting from mogamulizumab treatment are not yet available. Accordingly, we planned a prospective study of mogamulizumab-naive ATL patients who subsequently received mogamulizumab-containing treatment. Herein, we report a part of that study, focusing on patients’ clinical and immunological parameters before mogamulizumab and on their relationships with treatment outcome.
Methods
Patients and study design
The Monitoring of Immune Responses Following Mogamulizumab-Containing Treatment in Patients with ATL (MIMOGA) study is a multicenter prospective observational study (UMIN000008696). The primary end point was to clarify the immune dynamics of various lymphocyte subsets, including Tregs, in blood following mogamulizumab-containing treatment. The secondary end point was to reveal the immunological and molecular mechanisms determining treatment efficacy or provocation of AEs by mogamulizumab in these ATL patients. Taken together, the ultimate goal of the study was to establish the most effective and safe treatment strategy for using mogamulizumab in ATL patients. Diagnoses and assignment of clinical subtypes of ATL in the study were made according to the criteria proposed by the Japan Lymphoma Study Group.19-21 Inclusion criteria included patients with CCR4+ ATL planned to receive mogamulizumab-containing treatment. Exclusion criteria were having received previous mogamulizumab or allogeneic hematopoietic stem cell transplantation (HSCT).22,23 After enrollment, the treatment strategy, which included mogamulizumab, was left to the clinical discretion of each investigator. The details are available in supplemental Methods.
Immune monitoring
The scheme for immune monitoring is shown in Figure 1. The details are available in supplemental Methods.
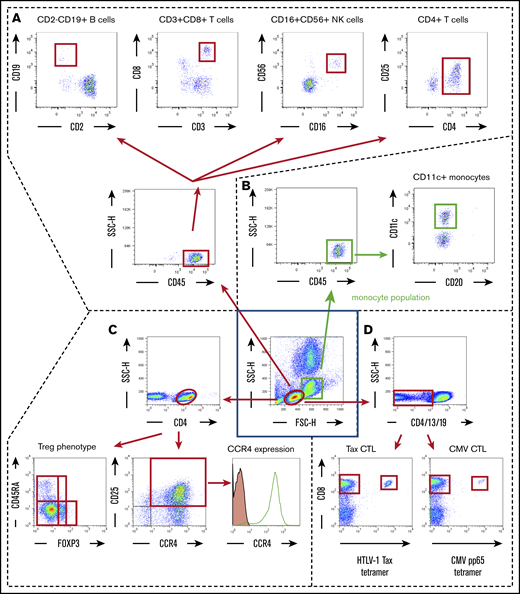
Scheme for immune monitoring. Lymphocyte and monocyte populations were determined by forward scatter height (FSC-H) and side scatter height (SSC-H) levels (inside the central blue square). The former were gated as shown by the red ovals, and the latter were gated as shown by the green squares. (A) In the lymphocyte population, CD45+ cells were plotted according to CD2 (x-axis) and CD19 (y-axis) positivity, and these B cells were gated by quadrant (upper far left panel); also plotted are CD3+ (x-axis) and CD8+ (y-axis) cells, gated by quadrant (upper near left panel); CD16+ (x-axis) and CD56+ (y-axis) natural killer (NK) cells, gated by quadrant (upper near right panel); and CD4+ (x-axis) and CD25+ (y-axis) cells plotted as CD4+CD25+dim-high cells gated by quadrant (upper far right panel). (B) In the monocyte population, CD45+ cells were plotted according to CD20 (x-axis) and CD11c (y-axis) positivity, and CD11c+ monocytes were gated by quadrant. (C) In the lymphocyte population, CD4+ cells were plotted according to FOXP3 (x-axis) and CD45RA (y-axis) positivity (lower left panel). Treg phenotypes of ATL cells were determined based on these data. CD4+ cells are also plotted according to CCR4 expression (x-axis) and CD25 (y-axis) positivity (lower middle panel). CD4 and CD25 double-positive cells are stained with anti-CCR4 monoclonal antibody (open graph) or isotype-control monoclonal antibody (filled graph) to show the level of CCR4 expression in ATL (CD4- and CD25-double positive) cells (lower right panel). (D) Within the lymphocyte population, CD4−, CD13−, and CD19− cells were plotted according to HTLV-1 Tax tetramer (x-axis) and CD8 (y-axis) positivity (lower left panel) or CMV pp65 tetramer (x-axis) and CD8 (y-axis) positivity (lower right panel). These data were obtained from patient number 001.
Scheme for immune monitoring. Lymphocyte and monocyte populations were determined by forward scatter height (FSC-H) and side scatter height (SSC-H) levels (inside the central blue square). The former were gated as shown by the red ovals, and the latter were gated as shown by the green squares. (A) In the lymphocyte population, CD45+ cells were plotted according to CD2 (x-axis) and CD19 (y-axis) positivity, and these B cells were gated by quadrant (upper far left panel); also plotted are CD3+ (x-axis) and CD8+ (y-axis) cells, gated by quadrant (upper near left panel); CD16+ (x-axis) and CD56+ (y-axis) natural killer (NK) cells, gated by quadrant (upper near right panel); and CD4+ (x-axis) and CD25+ (y-axis) cells plotted as CD4+CD25+dim-high cells gated by quadrant (upper far right panel). (B) In the monocyte population, CD45+ cells were plotted according to CD20 (x-axis) and CD11c (y-axis) positivity, and CD11c+ monocytes were gated by quadrant. (C) In the lymphocyte population, CD4+ cells were plotted according to FOXP3 (x-axis) and CD45RA (y-axis) positivity (lower left panel). Treg phenotypes of ATL cells were determined based on these data. CD4+ cells are also plotted according to CCR4 expression (x-axis) and CD25 (y-axis) positivity (lower middle panel). CD4 and CD25 double-positive cells are stained with anti-CCR4 monoclonal antibody (open graph) or isotype-control monoclonal antibody (filled graph) to show the level of CCR4 expression in ATL (CD4- and CD25-double positive) cells (lower right panel). (D) Within the lymphocyte population, CD4−, CD13−, and CD19− cells were plotted according to HTLV-1 Tax tetramer (x-axis) and CD8 (y-axis) positivity (lower left panel) or CMV pp65 tetramer (x-axis) and CD8 (y-axis) positivity (lower right panel). These data were obtained from patient number 001.
Statistical analysis
In some cases, the survival estimate was calculated with all transplanted patients censoring at the day of allogeneic HSCT. The details are available in supplemental Methods.
Study oversight
The protocol was approved by the Institutional Review Board at each participating site. The details are available in supplemental Methods.
Results
Patients
A total of 102 mogamulizumab-naive patients were enrolled in the study between August of 2012 and April of 2017, of whom 101 (59 men and 42 women) received mogamulizumab-containing treatment. The demographic data and clinical characteristics of these patients are summarized in Table 1. The median age was 69 years (range, 36 to 86). Disease subtypes included 68 acute, 18 lymphoma, 10 unfavorable chronic, 2 favorable chronic, and 3 smoldering ATLs. Seventeen patients had not been treated previously, but the remaining 84 had previously received systemic chemotherapy. After enrollment, 69 patients received mogamulizumab-containing combination therapies, such as a mogamulizumab plus modified LSG15 (mLSG15) regimen (vincristine, cyclophosphamide, doxorubicin and prednisolone; doxorubicin, ranimustine and prednisolone; and vindesine, etoposide, carboplatin and prednisolone),24 whereas 32 received mogamulizumab monotherapy. Patients received a mean of 6 mogamulizumab infusions (1 mg/kg), with a median of 5 (range, 1-42). Fifteen patients received allogeneic HSCT after mogamulizumab-containing treatment.
Patient demographics and clinical characteristics (N = 101)
| Characteristics | Data |
|---|---|
| Sex | |
| Female | 42 (42) |
| Male | 59 (58) |
| Age, y | |
| Mean | 67 |
| Median | 69 |
| Range | 36-86 |
| Clinical subtype | |
| Acute | 68 (67) |
| Lymphoma | 18 (18) |
| Unfavorable chronic | 10 (10) |
| Favorable chronic | 2 (2) |
| Smoldering | 3 (3) |
| Previous systemic chemotherapy | |
| No | 17 (17) |
| Yes | 84 (83) |
| ECOG PS | |
| 0 | 27 (27) |
| 1 | 46 (45) |
| 2 | 16 (16) |
| 3 | 9 (9) |
| 4 | 3 (3) |
| Serum sIL-2R (U/mL) | |
| Mean | 14 491 |
| Median | 5 530 |
| Range | 516-192 000 |
| HTLV-1 load (copies/1000 PBMCs) | |
| Mean | 505.4 |
| Median | 382.1 |
| Range | 0.5-3 093.7 |
| Serum Ca, mg/dL*,† | |
| Mean | 9.5 |
| Median | 9.3 |
| Range | 5.8-16.2 |
| Serum Alb, g/dL† | |
| Mean | 3.5 |
| Median | 3.6 |
| Range | 2.0-4.6 |
Unless otherwise noted, data are n (%).
Alb, albumin; Ca, calcium; ECOG PS, Eastern Cooperative Oncology Group Performance Status; HTLV-1, human T-cell lymphotropic virus type 1; PBMC, peripheral blood mononuclear cell; sIL-2R, soluble interleukin-2 receptor.
When serum Alb level was <4.0 g/dL, serum Ca was adjusted by the concentration of serum Alb as follows: adjusted Ca level (mg/dL) = measured Ca level (mg/dL) + (4 − Alb level [g/dL]).
Data were missing for 3 patients.
Clinical responses to mogamulizumab
Of the 101 patients in the trial, objective responses to mogamulizumab-containing treatment were noted in 66 (overall response rate [ORR], 65%; 95% confidence interval [CI], 55-75), including 44 complete responses (CRs). Seven patients were diagnosed as having stable disease (SD), and 28 had progressive disease (PD). Median progression-free survival (PFS) and overall survival (OS) were 7.4 months (95% CI, 5.7-9.1) (Figure 2A) and 16.0 months (95% CI, 10.3-21.8) (Figure 2B), respectively. Median PFS and OS of the cohort in which 15 patients were censored at the day of allogeneic HSCT were 7.0 months (95% CI, 5.3-8.8) (Figure 2C) and 16.0 months (95% CI, 10.2-21.9), respectively (Figure 2D).

PFS and OS of ATL patients. PFS (A) and OS (B) of all ATL patients in the study. PFS (C) and OS (D) after censoring patients at the day of allogeneic HSCT.
PFS and OS of ATL patients. PFS (A) and OS (B) of all ATL patients in the study. PFS (C) and OS (D) after censoring patients at the day of allogeneic HSCT.
Median PFS and OS, according to the clinical responses to mogamulizumab-containing treatment, are shown in supplemental Figure 2A and 2B, respectively. Median PFS and OS of HSCT-censored patients, according to the clinical responses, are shown in supplemental Figure 2C and 2D, respectively.
OS of patients according to their clinical parameters
Sex did not have a significant influence on OS (median OS, 16.0 months for men vs 18.8 months for women; P = .621) (Figure 3A). There was no significant difference according to age (median OS, 16.0 vs 18.1 months for patients > 70 years of age or ≤70 years of age, respectively; P = .592) (Figure 3B). OS of patients with acute or lymphoma subtype was significantly shorter than in those with chronic or smoldering subtype (median OS, 12.9 vs 41.9 months; P = .007) (Figure 3C). OS of patients with a poorer Eastern Cooperative Oncology Group Performance Status (ECOG PS)2-4 was significantly worse than for those with a better ECOG PS (0-1) (median OS, 8.2 vs 19.6 months; P = .003) (Figure 3D). OS of patients with a higher serum soluble interleukin-2 receptor (sIL-2R) level (>20 000 U/mL) was significantly shorter than in those with a lower level (≤20 000 U/mL) (median OS, 6.2 vs 19.7 months, respectively; P < .001) (Figure 3E). Furthermore, OS for those with a higher serum adjusted calcium (Ca) level (≥11.0 mg/dL) was significantly worse than for those with a lower level (<11.0 mg/dL) (median OS, 6.2 vs 18.1 months, respectively; P = .014) (Figure 3F). Finally, OS according to serum albumin (Alb) levels revealed that patients with a lower level (<3.5 g/dL) did worse than did those with a higher level (≥3.5 g/dL) (median OS, 8.3 vs 22.6 months, respectively; P = .004) (Figure 3G).
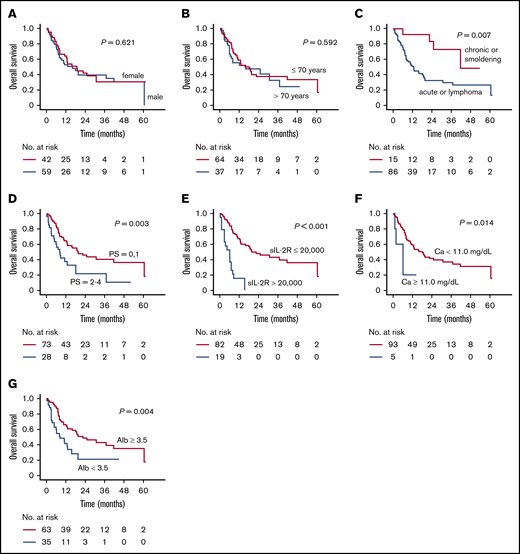
OS of patients stratified according to their clinical parameters. (A) OS of male and female patients separately. (B) OS of patients >70 and ≤70 years of age. (C) OS of patients with acute or lymphoma subtype vs chronic or smoldering subtype. (D) OS according to ECOG PS status (0,1 vs 2-4). (E) OS according to serum sIL-2R levels (>20 000 U/mL vs ≤20 000 U/mL). (F) OS according to serum-adjusted Ca level (≥11.0 mg/dL vs <11.0 mg/dL). (G) OS according to serum Alb level (≥3.5 g/dL vs <3.5 g/dL).
OS of patients stratified according to their clinical parameters. (A) OS of male and female patients separately. (B) OS of patients >70 and ≤70 years of age. (C) OS of patients with acute or lymphoma subtype vs chronic or smoldering subtype. (D) OS according to ECOG PS status (0,1 vs 2-4). (E) OS according to serum sIL-2R levels (>20 000 U/mL vs ≤20 000 U/mL). (F) OS according to serum-adjusted Ca level (≥11.0 mg/dL vs <11.0 mg/dL). (G) OS according to serum Alb level (≥3.5 g/dL vs <3.5 g/dL).
There were no significant differences in PFS or OS between previously untreated or treated patients (median PFS, 9.5 vs 6.9 months, respectively; P = .397; supplemental Figure 2A; median OS, 18.8 vs 15.7 months, respectively; P = .830; supplemental Figure 2B). Of the 17 previously untreated patients, objective responses were noted in 14 (ORR, 82%), whereas objective responses were noted in 52 of 84 previously treated patients (ORR, 62%). Thus, there also was no significant difference in ORR to mogamulizumab-containing treatment between these groups (P = .162). Additionally, of the previously treated patients, there was no significant difference in OS among those whose most recent regimen had been mLSG15-like,24 CHOP (cyclophosphamide, doxorubicin, vincristine, prednisolone)-like,25 or others (supplemental Figure 2C). Notably, also among those patients, OS on the present mogamulizumab-containing regimen in the second-line setting was significantly longer than when it was used as a third-line or later treatment (supplemental Figure 2D).
There also was no significant difference in OS between patients treated with mogamulizumab monotherapy or combination therapy (median OS, 30.9 vs 12.8 months, respectively; P = .156; supplemental Figure 2E). Additionally, in those patients, there was no significant difference in OS among those who received mogamulizumab combined with mLSG15-like,24 CHOP-like,25 or other regimens (supplemental Figure 2F). Furthermore, there was no significant difference in OS between patients with acute, lymphoma, or unfavorable chronic subtypes and those with favorable chronic or smoldering subtypes (median OS, 13.2 vs 41.9 months, respectively; P = .298; supplemental Figure 2G).
Impact of allogeneic HSCT after mogamulizumab-containing treatment
There were no significant differences in OS between patients subsequently going on to receive allogeneic HSCT and those who did not (median OS, not reached vs 15.7 months, respectively; P = .205) (Figure 4A). However, the OS of patients receiving HSCT within 60 days of the last mogamulizumab infusion was significantly shorter than of those transplanted >60 days after the last infusion (median OS, 8.0 months vs not reached; P = .049) (Figure 4B).
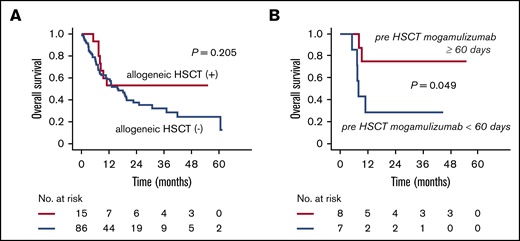
Impact of allogeneic HSCT after mogamulizumab-containing treatment. (A) OS of patients receiving or not receiving allogeneic HSCT. (B) OS of patients who received allogeneic HSCT ≥60 days or <60 days after the last mogamulizumab infusion.
Impact of allogeneic HSCT after mogamulizumab-containing treatment. (A) OS of patients receiving or not receiving allogeneic HSCT. (B) OS of patients who received allogeneic HSCT ≥60 days or <60 days after the last mogamulizumab infusion.
Treg phenotypes of ATL cells
Immunological parameters, including Treg phenotypes at enrollment, were evaluated in all 102 patients. This analysis revealed 24 patients with ATL cells of effector Treg (eTreg) phenotype, 19 patients with non-Treg phenotype, 31 patients with other phenotype, 27 patients with unclassified phenotypes, and 1 patient with missing data. Flow cytometry analyses for evaluating Treg phenotypes of ATL cells in all 101 patients are provided in supplemental Figure 3.
Immunological status of ATL patients before mogamulizumab
There was a significant positive correlation between the human T-cell lymphotropic virus type 1 (HTLV-1) provirus load (PVL) in peripheral blood mononuclear cells (PBMCs) and the serum sIL-2R level in the patients enrolled in the present study (Spearman rank correlation coefficient [Rs] = 0.368; P < .001; n = 102; data not shown). There was a significant inverse correlation between the HTLV-1 PVL in PBMCs and the percentage of HTLV-1 Tax-specific cytotoxic T lymphocytes (Tax-CTLs) within the entire lymphocyte population (Rs = −0.343; P = .010; Figure 5A, far left panel, n = 94 [Tax-CTL tetramer analyses could not be performed in 8 patients because of lack of an appropriate HLA type or missing data]). The same was also true for the correlation between HTLV-1 PVL and the percentage of cytomegalovirus pp65-specific cytotoxic T lymphocytes (CMV-CTLs; Rs = −0.279, P = .007; Figure 5A, near left panel; n = 94 [CMV-CTL tetramer analyses could not be performed in 8 patients for the same reason]). However, there was no significant correlation between the HTLV-1 PVL in PBMCs and the percentage of Tax-CTLs or CMV-CTLs within the CD8+ lymphocyte population (Figure 5A, near right and far right panels, respectively; n = 94 each).
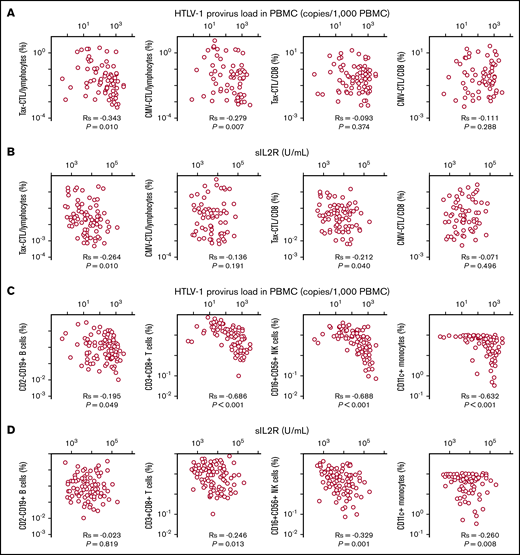
Relationships between HTLV-1 PVL in PBMCs or serum sIL-2R level and Tax-CTLs, CMV-CTLs, CD2−CD19+B cells, CD3+CD8+T cells, CD16+CD56+NK cells, or CD11c+monocytes. (A) Correlation between HTLV-1 PVL in PBMCs (x-axis) and the percentages of Tax-CTLs within lymphocytes (far left panel), CMV-CTLs within lymphocytes (near left panel), Tax-CTLs as a percentage of CD8+ lymphocytes (near right panel), and CMV-CTLs within CD8+ lymphocytes (far right panel). (B) Correlation between serum sIL-2R level (x-axis) and the percentage of Tax-CTLs within lymphocytes (far left panel), CMV-CTLs within lymphocytes (near left panel), Tax-CTLs as a percentage of CD8+ lymphocytes (near right panel), and CMV-CTLs within CD8+ lymphocytes (far right panel). (C) Correlation between HTLV-1 PVL in PBMCs (x-axis) and the percentages of CD2-CD19+ B cells within lymphocytes (far left panel), CD3+CD8+ T cells within lymphocytes (near left panel), CD16+CD56+ NK cells within lymphocytes (near right panel), and CD11c+ monocytes within the monocyte population (far right panel). (D) Correlation between serum sIL-2R level (x-axis) and the percentages of CD2−CD19+ B cells within lymphocytes (far left panel), CD3+CD8+ T cells within lymphocytes (near left panel), CD16+CD56+ NK cells within lymphocytes (near right panel), and CD11c+ monocytes within the monocyte population (far right panel).
Relationships between HTLV-1 PVL in PBMCs or serum sIL-2R level and Tax-CTLs, CMV-CTLs, CD2−CD19+B cells, CD3+CD8+T cells, CD16+CD56+NK cells, or CD11c+monocytes. (A) Correlation between HTLV-1 PVL in PBMCs (x-axis) and the percentages of Tax-CTLs within lymphocytes (far left panel), CMV-CTLs within lymphocytes (near left panel), Tax-CTLs as a percentage of CD8+ lymphocytes (near right panel), and CMV-CTLs within CD8+ lymphocytes (far right panel). (B) Correlation between serum sIL-2R level (x-axis) and the percentage of Tax-CTLs within lymphocytes (far left panel), CMV-CTLs within lymphocytes (near left panel), Tax-CTLs as a percentage of CD8+ lymphocytes (near right panel), and CMV-CTLs within CD8+ lymphocytes (far right panel). (C) Correlation between HTLV-1 PVL in PBMCs (x-axis) and the percentages of CD2-CD19+ B cells within lymphocytes (far left panel), CD3+CD8+ T cells within lymphocytes (near left panel), CD16+CD56+ NK cells within lymphocytes (near right panel), and CD11c+ monocytes within the monocyte population (far right panel). (D) Correlation between serum sIL-2R level (x-axis) and the percentages of CD2−CD19+ B cells within lymphocytes (far left panel), CD3+CD8+ T cells within lymphocytes (near left panel), CD16+CD56+ NK cells within lymphocytes (near right panel), and CD11c+ monocytes within the monocyte population (far right panel).
Further analysis revealed a significant inverse correlation between the serum sIL-2R level and the percentage of Tax-CTLs within the entire lymphocyte population (Rs = −0.264; P = .010; Figure 5B, far left panel; n = 94), but this did not apply to the CMV-CTLs (Figure 5B, near left panel; n = 94). In this instance, there was a significant inverse correlation between the serum sIL-2R level and the percentage of Tax-CTLs among CD8+ lymphocytes (Rs = −0.212, P = .040, Figure 5B, near right panel; n = 94), but, again, this was not the case for CMV-CTLs (Figure 5B, far right panel; n = 94). The percentages of Tax-CTLs and CMV-CTLs within the CD8+ lymphocyte subset did not correlate with each other (Rs = +0.129, P = .216, n = 94; data not shown). Flow cytometry analyses for Tax-CTLs and CMV-CTLs are shown in supplemental Figure 3.
Other analyses included associations between the HTLV-1 PVL in PBMCs and the percentages of other cell types, such as CD2−CD19+ B cells within the entire lymphocyte population (Rs = −0.195, P = .049, Figure 5C, far left panel; n = 102). There were significant inverse correlations between the HTLV-1 PVL in PBMCs and the percentages of CD3+CD8+ T cells among lymphocytes (Rs = −0.686, P < .001, Figure 5C, near left panel; n = 102), the percentages of CD16+CD56+ natural killer (NK) cells among lymphocytes (Rs = −0.688, P < .001, Figure 5C, near right panel; n = 102), and the percentages of CD11c+ monocytes within the monocyte population (Rs = −0.632, P < .001, Figure 5C, far right panel; n = 102). Other correlations assessed included associations between serum sIL-2R levels and the percentages of cells, such as CD2−CD19+ B cells within lymphocytes (Rs = −0.023, P = .819, Figure 5D, far left panel; n = 102), CD3+CD8+ T cells within lymphocytes (Rs = −0.246, P = .013, Figure 5D, near left panel; n = 102), CD16+CD56+ NK cells within lymphocytes (Rs = −0.329, P = .001, Figure 5D, near right panel; n = 102), and CD11c+ monocytes among all monocytes (Rs = −0.260, P = .008, Figure 5D, far right panel; n = 102).
There were also significant positive correlations among the different types of cells in PBMCs, particularly CD3+CD8+ T cells with CD16+CD56+ NK cells within lymphocytes (Rs = +0.778, P < .001), CD3+CD8+ T cells among lymphocytes with CD11c+ monocytes within monocytes (Rs = +0.600, P < .001), CD16+CD56+ NK cells within lymphocytes with CD11c+ monocytes (Rs = +0.516, P < .001), and CD2−CD19+ B cells with CD11c monocytes (Rs = 0.197, P = .047) (supplemental Table 1). In contrast, there was no significant correlation between the percentages of CD2−CD19+ B cells within lymphocytes and CD3+CD8+ T cells (Rs = +0.125, P = .210) or between CD2−CD19+ B cells and CD16+CD56+ NK cells (Rs = +0.139, P = .163) (supplemental Table 1). The flow cytometry data for all patients’ CD2−CD19+ B cells, CD3+CD8+ T cells, CD16+CD56+ NK cells, and CD4+ cells are shown in supplemental Figure 4 for PBMCs and in supplemental Figure 5 for monocytes.
OS according to the Treg phenotype of patients’ ATL cells
In the patient cohort censored at the day of allogeneic HSCT, there was no significant difference in OS among patients whose ATL cells were of the eTreg, non-Treg, other, or unclassified phenotypes (supplemental Figure 6A). However, OS of patients with other phenotypes were significantly shorter than in the pooled eTreg plus non-Treg group (median OS, 8.7 vs 18.8 months, P = .042) (supplemental Figure 6B).
OS of patients according to their immunological parameters
In the present study, the cutoff value for the percentage of Tax-CTLs within the entire lymphocyte population was set at 0.002 (supplemental Table 2), and this value for CMV-CTLs was set at 0.045 (supplemental Table 3). In the cohort of patients censored at the day of allogeneic HSCT, OS of those with a higher percentage of Tax-CTLs within lymphocytes (ie, >0.002%) was significantly better than of those with fewer Tax-CTLs (median OS, 19.6 vs 11.3 months; P = .028) (Figure 6A). However, there was no advantage to having a higher percentage of CMV-CTLs (median OS, 13.2 vs 18.8 months) (Figure 6B). Within CD8+ T cells, the cutoff value was set at 0.02% for Tax-CTLs (supplemental Table 4) and at 0.35% for CMV-CTLs (supplemental Table 5). OS of HSCT-censored patients showed that a higher Tax-CTL frequency within CD8+ lymphocytes conferred a significant survival advantage (median OS, 19.0 vs 7.1 months; P = .032) (Figure 6C). This was not the case for patients with a higher frequency of CMV-CTLs (median OS, 10.6 vs 18.8 months) (Figure 6D). With regard to Tax-CTLs or CMV-CTLs, the same trends were noted in a previously treated patient cohort (n = 84) (supplemental Figure 7).
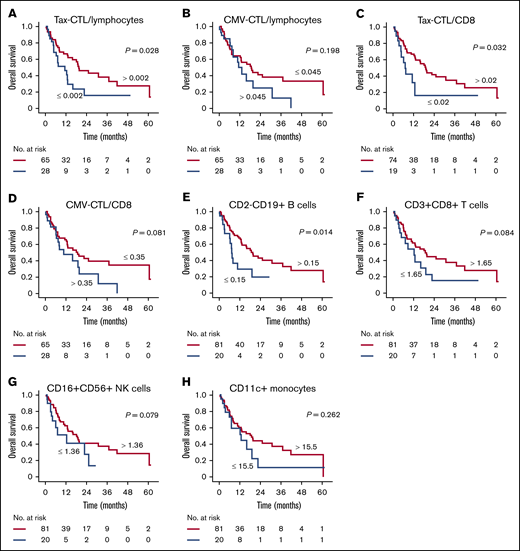
OS according to immunological parameters of the cohort in which patients were censored at the day of allogeneic HSCT. (A) OS according to higher or lower percentages of Tax-CTLs within all lymphocytes. (B) OS according to CMV-CTL percentages in all lymphocytes. (C) OS according to percentages of Tax-CTLs within CD8+ lymphocytes. (D) OS according to percentages of CMV-CTLs within CD8+ lymphocytes. (E) OS according to percentages of CD2-CD19+ B cells within lymphocytes. (F) OS according to CD3+CD8+ T cell levels. (G) OS according to CD16+CD56+ NK cell levels. (H) OS according to CD11c+ monocyte levels.
OS according to immunological parameters of the cohort in which patients were censored at the day of allogeneic HSCT. (A) OS according to higher or lower percentages of Tax-CTLs within all lymphocytes. (B) OS according to CMV-CTL percentages in all lymphocytes. (C) OS according to percentages of Tax-CTLs within CD8+ lymphocytes. (D) OS according to percentages of CMV-CTLs within CD8+ lymphocytes. (E) OS according to percentages of CD2-CD19+ B cells within lymphocytes. (F) OS according to CD3+CD8+ T cell levels. (G) OS according to CD16+CD56+ NK cell levels. (H) OS according to CD11c+ monocyte levels.
This type of analysis was extended to other cell subsets. Taking the cutoff value for the percentage of CD2−CD19+ B cells within lymphocytes as 0.15% (supplemental Table 6) showed that the OS of HSCT-censored patients with a higher B-cell level was significantly better than for those with fewer B cells (median OS, 19.6 vs 7.2 months, P = .014) (Figure 6E). Next, cutoff values for the percentages of CD3+CD8+ T cells and CD16+CD56+ NK cells within lymphocytes and of CD11c+ monocytes within all monocytes were set at 1.65% (supplemental Figure 7), 1.36% (supplemental Table 8), and 15.5% (supplemental Table 9), respectively. Survival analyses in the cohort censored for HSCT showed that there were no significant differences in OS between patients with higher or lower percentages of CD3+CD8+ T cells (median OS, 18.8 vs 12.4 months; Figure 6F), CD16+C56+ NK cells (median OS, 18.1 vs 12.4 months; Figure 6G), or CD11c+ monocytes (median OS, 18.8 vs 12.8 months; Figure 6H).
Multivariate analysis of factors influencing OS in ATL patients receiving mogamulizumab
Multivariate analysis of OS in the 101 patients with ATL censored at the day of allogeneic HSCT was performed using the following 9 variables: sex, age, clinical subtype, ECOG PS, sIL-2R, CD2−CD19+ B cells, CD3+CD8+ T cells, CD16+CD56+ NK cells, and CD11c+ monocytes. Of these, 3 variables significantly affected OS: the clinical subtype (acute or lymphoma type) (hazard ratio [HR], 3.727; 95% CI, 1.206-11.520), higher serum sIL-2R (HR, 3.970; 95% CI, 1.985-7.942), and fewer CD2−CD19+ B cells (HR, 2.157; 95% CI, 1.105-4.210) (Table 2). Multivariate analysis of OS in the 84 previously treated patients was performed in the same manner. This resulted in the identification of 4 variables significantly affecting OS: worse ECOG PS (HR, 2.094; 95% CI, 1.046–4.193), higher serum sIL-2R (HR, 10.081; 95% CI, 4.324-23.502), fewer CD2−CD19+ B cells (HR, 2.305; 95% CI, 1.066-4.984), and fewer CD3+CD8+ T cells (HR, 6.415; 95% CI, 1.764-23.321) (supplemental Table 10).
Multivariate analysis for OS in patients with ATL
| Variables | n | HR | 95% CI | P |
|---|---|---|---|---|
| Sex | ||||
| Male | 59 | 1.000 | Reference | |
| Female | 42 | 0.728 | 0.381-1.392 | .337 |
| Age, y | ||||
| ≤70 | 64 | 1.000 | Reference | |
| >70 | 37 | 1.170 | 0.663-2.066 | .588 |
| Clinical subtype | ||||
| Chronic, smoldering | 15 | 1.000 | Reference | |
| Acute, lymphoma | 86 | 3.727 | 1.206-11.520 | .022 |
| ECOG PS | ||||
| 0,1 | 73 | 1.000 | Reference | |
| 2-4 | 28 | 1.374 | 0.738-2.557 | .316 |
| sIL-2R, U/mL | ||||
| ≤20 000 | 82 | 1.000 | Reference | |
| >20 000 | 19 | 3.970 | 1.985-7.942 | <.001 |
| CD2−CD19+cells, %* | ||||
| >0.15 | 81 | 1.000 | Reference | |
| ≤0.15 | 20 | 2.157 | 1.105-4.210 | .024 |
| CD3+CD8+cells, %* | ||||
| >1.65 | 81 | 1.000 | Reference | |
| ≤1.65 | 20 | 1.768 | 0.787-3.973 | .167 |
| CD16+CD56+cells, %* | ||||
| >1.36 | 81 | 1.000 | Reference | |
| ≤1.36 | 20 | 2.343 | 0.997-5.509 | .051 |
| CD11c+monocytes, %† | ||||
| >15.5 | 81 | 1.000 | Reference | |
| ≤15.5 | 20 | 0.785 | 0.335-1.840 | .578 |
The patients were censored at the day of allogeneic HSCT.
The percentage among whole lymphocytes in PBMCs.
The percentage among whole monocytes in PBMCs.
Discussion
We report a portion of the results of the MIMOGA study, focusing on clinical and immunological parameters of mogamulizumab-naive patients before treatment and their influence on the outcome of mogamulizumab-containing treatment. The median age of the patients (69 years) was almost the same as for those enrolled in a nationwide survey of ATL from 2010 to 2011 (68 years).26 In addition, 12 patients (12%) had an ECOG PS of 3 or 4, which would usually lead to their exclusion from prospective interventional clinical studies. Taken together, it is clear that the patients enrolled in the present study reflect the real-world clinical practice of ATL treatment in Japan.
The observed ORR of 65% was clinically meaningful, considering that ORR in the study of mogamulizumab monotherapy for relapsed ATL was 50%.8 Furthermore, a pivotal study of lenalidomide for relapsed ATL, achieved an ORR of 42%.27 In addition, the observed PFS (7.4 months) and OS (16.0 months) were clinically meaningful, considering that median PFS and OS in the earlier study of mogamulizumab for relapsed ATL were 5.2 months and 13.7 months, respectively.8 In the study on lenalidomide, and the VCAP-AMP-VECP arm for previously untreated patients with aggressive ATL in the JCOG9801 study, PFS and OS were 3.8 and 20.3 months27 and 7.0 and 12.7 months,25 respectively. Importantly, ATL patients enrolled in these earlier studies were in a favorable state of health (ie, were relatively younger and had good ECOG PS and preserved organ functions).8,25,27
The observed survival rates according to the clinical responses (CR, partial response, SD, or PD) to mogamulizumab-containing treatment were reasonable. This indicates that favorable responses to mogamulizumab-containing treatment directly lead to prolonged survival. A worse PS, higher serum sIL-2R, lower serum Alb, higher serum Ca, and older age are generally accepted unfavorable prognostic factors, which were established in patient cohorts receiving conventional cytotoxic chemotherapies.28,29 Of these risk factors, the present study indicates that older age does not always confer a disadvantage to patients receiving mogamulizumab-containing treatment.
The present finding that the OS of patients receiving HSCT within 60 days of the last mogamulizumab infusion was significantly unfavorable is consistent with an earlier study.30 At the time of receiving allogeneic HSCT, the residual mogamulizumab in the patient probably depletes the transplanted Tregs and is likely to inhibit Treg differentiation from the transplanted hematopoietic stem cells. This would result in Treg deficiency in the HSCT recipients, leading to a dismal prognosis, primarily as a result of increased severity and refractoriness of graft-versus-host disease. In fact, among the 7 patients receiving HSCT within 60 days of the last dose of mogamulizumab, 5 patients died within 8 months of HSCT, all as a result of transplantation-related mortality, such as caused by acute graft-versus-host disease.
It is generally accepted that most ATL cells are CD4+, CD25+, and FOXP3+,31,32 and they are phenotypic characteristics of Tregs.33,34 Additionally, we have previously reported that ATL cells from a subset of patients actually function as Tregs.35 On the other hand, the present study indicates that the Treg phenotype of ATL cells did not have a major impact on the prognosis of patients receiving mogamulizumab-containing treatment.
A significant inverse correlation was observed between the HTLV-1 PVL and the percentage of Tax-CTLs, rather than of CMV-CTLs, within the lymphocyte population. In addition, a significant inverse correlation between the serum sIL-2R level, which reflects ATL tumor burden,36 and the percentage of Tax-CTLs, but not CMV-CTLs, within the lymphocyte population or CD8+ T cells was also observed. These findings indicate that Tax-CTLs play an important role in suppressing the expansion of HTLV-1–infected cells, resulting in a reduced ATL tumor burden. These data are consistent with our previous report that HTLV-1 Tax has relatively strong immunogenicity37-39 and that functional Tax-CTLs are crucial for determining the HTLV-1 PVL in ATL patients.40 Additionally, those earlier findings are consistent with the present observations that a higher percentage of Tax-CTLs, but not CMV-CTLs, within the entire lymphocyte population or the CD8+ subset is associated with prolonged survival, not only in the present patient cohort but also in the previously treated cohort. This also indicates that Tax-CTLs would contribute to the eradication of HTLV-1–infected ATL cells, together with the subsequently injected mogamulizumab. In other words, the magnitude of the elicited T-cell immune responses to HTLV-1 Tax, but not responses to CMV pp65, plays a significant antitumor role in patients receiving mogamulizumab-containing treatment.
Considering the apparent lack of correlation between the percentage of CD2−CD19+ B cells and the HTLV-1 PVL or the sIL-2R level, it would seem that these B cells do not contribute to suppressing the expansion of HTLV-1–infected cells, thus reducing the ATL tumor burden. However, a higher percentage of CD2−CD19+ B cells was nonetheless associated with longer survival. Although the precise mechanisms explaining these observations await clarification, a higher percentage of B cells might reflect some aspect of a favorable immune status leading to a good outcome after mogamulizumab treatment. In contrast, considering the significant inverse correlations between the percentages of CD3+CD8+ T cells or CD16+CD56+ NK cells and the HTLV-1 PVL or sIL-2R level, CD3+CD8+ T cells and CD16+CD56+ NK cells do seem to contribute to suppressing the expansion of HTLV-1–infected cells and reduce the ATL tumor burden. These data are consistent with observations that a higher percentage of CD3+CD8+ T cells or CD16+CD56+ NK cells tended to be associated with prolonged survival, albeit without reaching statistical significance. Additionally, the significant inverse correlations between the percentages of CD11c+ monocytes within the monocyte populations and the HTLV-1 PVL or sIL-2R level suggest that such CD11c+ monocytes also contribute to suppressing the expansion of HTLV-1–infected cells and reducing the ATL tumor burden. However, a higher percentage of CD11c+ monocytes was not related to prolonged survival caused by mogamulizumab-containing treatment.
The present multivariate analysis identified the clinical subtype (acute or lymphoma type), a higher serum sIL-2R level, and a lower percentage of CD2−CD19+ B cells as 3 independent significantly unfavorable prognostic factors for OS of the patients receiving mogamulizumab-containing treatment. A prognostic significance of CD2−CD19+ B cells was also observed in the previously treated cohort. Now, we can confidently propose that a higher percentage of B cells might reflect an overall favorable immune status leading to a good outcome after mogamulizumab treatment. Although associations with the percentages of CD16+CD56+ NK cells did not quite achieve statistical significance, an impact of these cells on prognosis in the present multivariate analysis would be expected. Mogamulizumab induces only ADCC activity and does not mediate complement-dependent cytotoxicity or direct antitumor activities. In this context, CD16+CD56+ NK cells are considered the main effector cells of mogamulizumab-induced ADCC; therefore, positive associations with outcome would be likely.5,6
Although the present study offers significant observations regarding mogamulizumab treatment of patients with ATL, some limitations should be discussed. First, we enrolled previously untreated and treated patients, which could affect the immunological status before mogamulizumab. Second, the patients received various treatments, including mogamulizumab. Some patients received mogamulizumab monotherapy, whereas others received different combination therapies. All of these variables could affect the clinical and immunological outcomes.
In conclusion, the present multicenter prospective observational study demonstrated that mogamulizumab has clinically meaningful antitumor activity in the real-world clinical treatment of ATL. The patient’s immunological status before mogamulizumab treatment, as reflected by the percentage of B cells in PBMCs and the magnitude of the HTLV-1 Tax-specific T-cell immune response, was significantly associated with the outcome of treatment with mogamulizumab. The patients enrolled in the present MIMOGA study received the immune monitoring before, during, and after mogamulizumab treatment. On the basis of the present study focusing on the patients’ immunological status before mogamulizumab and its influence on outcome, further time series analysis, in addition to comprehensive genomic analyses, is warranted to establish predictive markers for treatment success and to better understand the mechanisms of action of mogamulizumab.
Data sharing requests should be sent to Takashi Ishida (e-mail: itakashi@med.nagoya-u.ac.jp).
Acknowledgments
The authors thank all nurses and clinical research coordinators who were involved in this study for patient care and schedule management. They also thank the Japan Institute of Statistical Technology (Tokyo, Japan) for critical review of the multivariate analysis. They are grateful to Hiroshi Iwata (SRL Medisearch Inc., Tokyo, Japan) for support in scheduling sampling from the patients and for sample preservation. They also thank Shinsuke Iida (Nagoya City University Graduate School of Medical Sciences, Nagoya, Japan) for helpful advice.
This work was supported by the Ministry of Education, Culture, Sports, Science and Technology of Japan grants-in-aid for scientific research (B) (25290058 and 16H04713) (T.I.) and grants-in-aid from the Japan Agency for Medical Research and Development (16cm0106301h0001, 17cm0106301h0002, 18cm0106301h0003, 19cm0106301h0004, and 20cm0106301h0005) (T.I.)
Authorship
Contribution: R.U., A.U., and T.I. conceived and designed the study; K.Y., S.K., I.C., N.N., A.I., Y.S., Y.I., M.Y., K.N., E.O., M.H., T.J., H.S., Y. Moriuchi, M.O., H.T., K.I., Y. Miyazaki, A.U., and T.I. acquired data; K.Y., S.K., A.I., R.U., A.U., and T.I. analyzed and interpreted data; and all authors wrote and approved the final version of the manuscript.
Conflict-of-interest disclosure: K.Y. has received honoraria from AbbVie, Celgene, Daiichi Sankyo, Eisai, Eli Lilly Japan, Janssen Pharmaceuticals, Kyowa Kirin, Maruho, Minophagen Pharmaceutical, Taiho Pharmaceutical, Torii Pharmaceutical, and UCB Japan. S.K. has received research funding and honoraria from Kyowa Kirin. N.N. has received honoraria from Novartis International Kyowa Kirin, Celgene, Nippon Shinyaku, Chugai Pharmaceutical, Bristol Myers Squibb, Astellas Pharma, and Takeda Pharmaceutical. Y.I. has received honoraria from Kyowa Kirin. K.N. has received honoraria from Kyowa Kirin, Chugai Pharmaceutical Novartis International, Celgene, Eisai, Merck Sharp & Dohme, and Bristol Myers Squibb. R.U. has received research funding from Kyowa Kirin, Chugai Pharmaceutical, and Ono Pharmaceutical. A.U. has received honoraria from Kyowa Kirin and Celgene. T.I. has received honoraria from Kyowa Kirin and Celgene. The remaining authors declare no competing financial interests.
Correspondence: Takashi Ishida, Department of Immunology, Nagoya University Graduate School of Medicine, 65 Tsurumai-cho, Showa-ku, Nagoya, Aichi 466-8560, Japan; e-mail: itakashi@med.nagoya-u.ac.jp.

