

Key Points
A novel KMT2A-rearrangement, MLL-TFE3, was identified in an infant leukemia patient.
MLL-TFE3 expression produces aggressive leukemia in a mouse model.
Introduction
Chromosomal rearrangements of lysine-specific methyltransferase 2A (KMT2A or MLL) occur in 80% of infant acute lymphoblastic leukemia (ALL) and 20% to 25% of pediatric acute myeloid leukemia (AML).1-4 They are sufficient, in the absence of other driver mutations, to cause infant and pediatric leukemias.4,5 While KMT2A-rearrangements (MLL-r) are generally associated with poor prognosis and higher risk of relapse in ALL, their prognostic significance in AML varies with different translocation partners.6,7
The rearrangements juxtapose KMT2A (chromosome 11q23.3) with 1 of at least 120 fusion partners, producing an in-frame chimeric protein.8 The rearrangements frequently occur in the major breakpoint cluster region (BCR) of KMT2A, conserving the DNA-binding A-T hook domains and the CxxC zinc finger, while removing the distal domains of KMT2A. Recently, a minor BCR was described that retains the plant homeodomains and bromodomain of KMT2A.9 Most KMT2A fusion partners belong to a complex involved in transcriptional elongation, called the super elongation complex.10,11 The fusion partners normally have a potent transcriptional activation domain, putative DNA-binding domains, or oligomerization motifs.12
Here, we describe a novel MLL-r with transcription factor binding to IGHM enhancer 3 (TFE3) (chromosome Xp11.23), identified in an infant leukemia patient by RNA sequencing (RNA-seq). TFE3, a member of microphthalmia family of transcription factors, is involved in lysosomal biogenesis and function by regulating the expression of coordinated lysosomal expression and regulation (CLEAR) elements.13,14 Oncogenic fusions involving TFE3 have been reported in renal cell carcinoma and alveolar soft part sarcoma (Figure 1A).15-17 TFE3 rearrangements account for 20% to 50% of all pediatric renal cell carcinoma cases and are typically associated with a more aggressive disease.17,18 Given the role of TFE3 as a putative oncogene, we investigated its role in the mechanism of leukemogenesis associated with this novel fusion.

Identification of a novel MLL-TFE3 in infant leukemia patient. (A) The reported fusion partners of TFE3-rearrangements in renal cell carcinoma and alveolar soft part sarcoma. The figure is modified from St Jude PeCan protein viewer (https://pecan.stjude.cloud/proteinpaint/).19 The breakpoint is shown relative to the TFE3 domains and the location of the amino acid, with the number of reported cases in the St Jude database shown in circles. (B) RNA-seq analysis using JAFFA20 identified a novel MLL-TFE3. Image shown is modified from a fusion visualization tool, Clinker.21 RNA read coverage is shown as reads per million (RPM), across the genes involved in the rearrangement. Protein domains involved in the fusion arrangement are also shown. (C) RT-PCR of the patient with MLL-TFE3 (1) and a leukemia patient with different rearrangement (2) using a primer set flanking the predicted breakpoint sequence of MLL-TFE3 (MLL-TFE3 BP) and GAPDH as an internal control for RT-PCR. (D) Sanger sequencing of patient cDNA showing the breakpoint sequence of MLL-TFE3. (E) Kaplan-Meier curves of the syngeneic mouse model. MLL-r with the NRasG12D cooperating mutation (solid lines), MLL-AF9 (blue line; n = 4), and MLL-TFE3 (red line; n = 5) are shown. MLL-r without the NRasG12D cooperating mutation (dashed lines), MLL-AF9 (blue dashes; n = 2), and MLL-TFE3 (red dashes; n = 3) are shown. Mice expressing only the NRasG12D mutation were included as control (brown line; n = 4). P value between MLL-AF9 and MLL-TFE3 mice, both in the presence of the NRasG12D mutation, is shown. A tick on the line indicates nonleukemic deaths, while the asterisk indicates the end of experimental cohort. (F) Representative hematoxylin and eosin staining of liver and spleen (original magnification ×10; scale bars, 200 µm) of MLL-AF9+NRasG12D, MLL-TFE3+NRasG12D, and normal mice. Blasts can be seen in the spleen and liver of MLL-AF9 and MLL-TFE mice, but not in the normal control. (G) Summary of the immunophenotyping result of the ex vivo bone marrow cells in the absence (−) or the presence (+) of doxycycline (Dox), analyzing the expression of myeloid markers. The data are plotted as scatter dot plot with mean value. (H) Summary of drug assay treatments using birinapant (±emricasan) (n = 5) and venetoclax (n = 5). The data are shown as percent viability of cells (by 4′,6-diamidino-2-phenylindole exclusion), normalized to untreated cells, and plotted against log concentration of drugs tested, with nonlinear regression analysis (variable slope). AT, AT hooks; bHLH, basic Helix-loop-Helix domain; bromo, bromodomain; CxxC, cysteine-rich region; D.P., double-positive stained cells; EFS, event-free survival; FYRC, FY-rich domain (C-terminal); FYRN, FY-rich domain (N terminal); LMI, LEDGF and menin interaction domain; LZip, leucine zipper; PHD, plant homeodomain; Pro, proline-rich domain; SET, Su(var)3-9, enhancer-of-zeste and trithorax domain; SNL, speckled nuclear localization signals.
Identification of a novel MLL-TFE3 in infant leukemia patient. (A) The reported fusion partners of TFE3-rearrangements in renal cell carcinoma and alveolar soft part sarcoma. The figure is modified from St Jude PeCan protein viewer (https://pecan.stjude.cloud/proteinpaint/).19 The breakpoint is shown relative to the TFE3 domains and the location of the amino acid, with the number of reported cases in the St Jude database shown in circles. (B) RNA-seq analysis using JAFFA20 identified a novel MLL-TFE3. Image shown is modified from a fusion visualization tool, Clinker.21 RNA read coverage is shown as reads per million (RPM), across the genes involved in the rearrangement. Protein domains involved in the fusion arrangement are also shown. (C) RT-PCR of the patient with MLL-TFE3 (1) and a leukemia patient with different rearrangement (2) using a primer set flanking the predicted breakpoint sequence of MLL-TFE3 (MLL-TFE3 BP) and GAPDH as an internal control for RT-PCR. (D) Sanger sequencing of patient cDNA showing the breakpoint sequence of MLL-TFE3. (E) Kaplan-Meier curves of the syngeneic mouse model. MLL-r with the NRasG12D cooperating mutation (solid lines), MLL-AF9 (blue line; n = 4), and MLL-TFE3 (red line; n = 5) are shown. MLL-r without the NRasG12D cooperating mutation (dashed lines), MLL-AF9 (blue dashes; n = 2), and MLL-TFE3 (red dashes; n = 3) are shown. Mice expressing only the NRasG12D mutation were included as control (brown line; n = 4). P value between MLL-AF9 and MLL-TFE3 mice, both in the presence of the NRasG12D mutation, is shown. A tick on the line indicates nonleukemic deaths, while the asterisk indicates the end of experimental cohort. (F) Representative hematoxylin and eosin staining of liver and spleen (original magnification ×10; scale bars, 200 µm) of MLL-AF9+NRasG12D, MLL-TFE3+NRasG12D, and normal mice. Blasts can be seen in the spleen and liver of MLL-AF9 and MLL-TFE mice, but not in the normal control. (G) Summary of the immunophenotyping result of the ex vivo bone marrow cells in the absence (−) or the presence (+) of doxycycline (Dox), analyzing the expression of myeloid markers. The data are plotted as scatter dot plot with mean value. (H) Summary of drug assay treatments using birinapant (±emricasan) (n = 5) and venetoclax (n = 5). The data are shown as percent viability of cells (by 4′,6-diamidino-2-phenylindole exclusion), normalized to untreated cells, and plotted against log concentration of drugs tested, with nonlinear regression analysis (variable slope). AT, AT hooks; bHLH, basic Helix-loop-Helix domain; bromo, bromodomain; CxxC, cysteine-rich region; D.P., double-positive stained cells; EFS, event-free survival; FYRC, FY-rich domain (C-terminal); FYRN, FY-rich domain (N terminal); LMI, LEDGF and menin interaction domain; LZip, leucine zipper; PHD, plant homeodomain; Pro, proline-rich domain; SET, Su(var)3-9, enhancer-of-zeste and trithorax domain; SNL, speckled nuclear localization signals.
Methods
Informed consent for collection and use of the patient sample was obtained by Children’s Cancer Centre Tissue Bank according to Royal Children’s Hospital Human Ethics Committee guidelines (HREC 34127). The isolation of RNA, library preparation, and the analytical pipelines20,21 to identify the fusion by RNA-seq have been previously described, whereby we sequenced >200 AML and ALL samples of infant and pediatric patients, including this patient.22 The fusion was cloned into tetracycline-regulated retroviral expression system (Tet-off)23 and used in a syngeneic mouse model.24 Detailed methods are provided in the supplemental Methods.
Results and discussion
The patient, a 4-month-old female infant, presented with a 6-week history of multiple scalp lesions, increasing irritability, bruising, and fatigue. Full blood examination demonstrated pancytopenia, leukocytosis with initial white cell count 20 × 109/L, and circulating blasts. Bone marrow examination demonstrated 83% blasts with an immunophenotype consistent with pre-B ALL, including partial CD10 positivity. Cerebrospinal fluid was positive for blasts. KMT2A rearrangement was detected on interphase fluorescence in situ hybridization. The patient was treated according to Interfant-06. Based on poor prednisolone response, with circulating blast count of 3.95 × 10⁹/L and peripheral blood minimal residual disease (MRD) 63% on day 8 of induction, age at diagnosis <6 months, and KMT2A rearrangement, the patient was stratified as high risk. While her cerebrospinal fluid was clear of blasts after 2 doses of intrathecal chemotherapy, she demonstrated a slow response to systemic therapy, with MRD of 27.1% on day 15 and 0.856% at the end of induction, at which time she was in morphological remission. Her MRD remained positive at the end of protocol IB consolidation (0.099%) and post–methotrexate, ara-C, 6-mercaptopurine, PEG-asparaginase (MARMA) (0.11%). At this time, she proceeded to an unrelated donor cord blood transplant in first complete remission, following conditioning with busulfan, fludarabine and thiotepa. She engrafted on day 19 and subsequently developed steroid sensitive acute graft versus host disease affecting primarily gut. She had no other significant complications and remains alive and disease-free 4 years posttransplant.
RNA-seq analysis of the diagnostic sample revealed a novel rearrangement between KMT2A and TFE3 (referred as MLL-TFE3) (Figure 1A- B), and its expression was confirmed by reverse transcriptase polymerase chain reaction (RT-PCR) (Figure 1C). This rearrangement involves the major BCR, linking exon 8 of KMT2A in-frame with exon 4 of TFE3, excluding the regions distal from CxxC of KMT2A but including all functional domains of TFE3, as confirmed by Sanger sequencing (Figure 1D). Using a “Tet-off” retroviral expression system,23 which also includes the expression of NRasG12D, we transduced MLL-TFE3 into hematopoietic stem cells that were subsequently transplanted into sublethally γ-irradiated syngeneic mice. MLL-AF9+NRasG12D-bearing cells were transplanted as a comparison. Mice harboring MLL-TFE3+NRasG12D (n = 5) developed a leukemia with a latency period similar to mice harboring MLL-AF9+NRasG12D (n = 4) (P = .2) (Figure 1E). In the absence of NRasG12D, the expression of MLL-TFE3 alone (n = 3) or MLL-AF9 alone (n = 2) was sufficient to induce leukemia (Figure 1E). All experimental mice had hepatosplenomegaly infiltrated with blast cells (Figure 1F; supplemental Figures 1 and 2). The leukemic cells from these experimental mice had a myeloid phenotype, which is not entirely surprising as similar bias in producing AML has been reported in other MLL-r mouse models.25 These cells differentiated into double-positive cells (GR1+ CD11b+) after the expression of the fusion was turned off by the addition of doxycycline (Figure 1G; supplemental Figure 3). The short latency of MLL-TFE3+NRasG12D mice and the ability to induce leukemia in the absence of NRasG12D indicate the potent transforming potential of this fusion protein.
We have previously demonstrated that some murine and human leukemias driven by MLL-r were sensitive to the second mitochondrial-derived activator of caspases (SMAC) mimetic drug birinapant, and the antileukemic efficacy was augmented through the necroptosis-mediated pathway by combination with a caspase-8 inhibitor (emricasan).24 Here, both MLL-TFE3 and MLL-AF9 cells had similar sensitivity to birinapant (50% inhibitory concentration [IC50] of 331 nM and 373 nM, respectively) (Figure 1H). Additionally, the birinapant/emricasan combination potently induced cell death in MLL-TFE3 cells, with an IC50 lower than MLL-AF9 cells (5 nM vs 23 nM) (Figure 1H). We have also previously demonstrated that the BCL-2 selective BH3-mimetic venetoclax has potent antileukemic efficacy as a single agent with IC50 <5 nM in pediatric patient–derived MLL-r ALL xenografts.26 Both MLL-TFE3 and MLL-AF9 cells lost viability at similar concentrations of venetoclax (IC50 in the high micromolar range) (Figure 1H). The discrepancy of IC50 values between xenograft and syngeneic models is expected due to the species difference of the cells of origin. These data show that cells expressing MLL-TFE3 or MLL-AF9 are similarly susceptible to killing by venetoclax or birinapant/emricasan.
To investigate whether TFE3 plays a specific transcriptional role in leukemogenesis, we designed domain-deletion mutants of MLL-TFE3 (Figure 2A). MLL-trunc, consisting of KMT2A region until the breakpoint, was used to establish whether exclusion of a fusion partner abolished leukemogenesis. To assess the role of TFE3 domains involved in DNA binding and protein-protein interactions (PPIs), we created 2 mutants: ΔPro mutant has all TFE3 domains, including the basic-helix-loop-helix-leucine zipper (bHLH-LZip) domains that are involved in DNA binding and PPIs,16 but excluding the proline-rich region at the C terminus; while the ΔHelix-LZip-Pro mutant has a disruption in the bHLH-LZip domains and the proline-rich region. The transcription activation domain (TAD) of TFE3 has been identified by experiments using reporter genes to be a region responsible in activating the E-box–containing target genes of TFE3.13 A mutant lacking the TAD of TFE3 but with full set of ancillary domains, ΔTAD, was therefore used to assess the role of TFE3 transactivation in leukemogenesis of MLL-TFE3. Each mutant was tested in the presence of NRasG12D expression in the syngeneic model described. Over several independent cohorts, no ΔHelix-LZip-Pro mice (n = 6) and only 1 MLL-trunc mouse (n = 6) developed leukemia, although there were deaths by other nonleukemic causes at late time points (>80 days) posttransplantation (Figure 2B). Three of 9 ΔPro transplanted mice developed leukemia, suggesting the loss of the proline-rich region resulted in a weaker oncogenic driver (Figure 2B,D; supplemental Figure 4). Immunofluorescence experiments using 293T cells transfected with the mutant constructs showed the mutants failure to consistently induce leukemia in vivo was not caused by failed expression or improper localization of these mutants (Figure 2C). Interestingly, ΔTAD transplanted mice consistently developed leukemia (n = 10), with a median survival of 37 days, similar to the full-length MLL-TFE3 in these cohorts (n = 11; median survival of 26 days; P = .9) (Figure 2B). The ΔTAD mice had blasts infiltrating their enlarged spleens and livers, unlike the phenotypically normal spleen and liver from a sacrificed nonleukemic ΔHelix-LZip-Pro mouse (Figure 2D; supplemental Figure 4). Together, these results suggest that the presence of the TFE3 fusion partner was vital for oncogenesis, likely by facilitating DNA binding or enabling PPIs. However, the TAD of TFE3 is dispensable, implying that the transcriptional activation by TFE3 does not contribute to leukemogenesis, which also might explain the similarity in the drug sensitivity profile between the 2 MLL fusions.
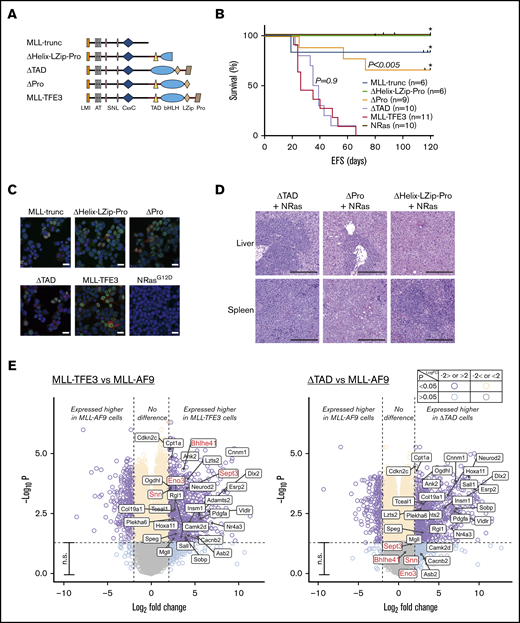
TFE3-dependent transcription does not contribute to leukemogenesis. (A) MLL-TFE3 mutant truncations used in this study: MLL-trunc, ΔHelix-LZip-Pro, ΔTAD, and ΔPro; as well as the full-length MLL-TFE3. (B) Kaplan-Meier curves of the syngeneic mouse model of the mutants and the full-length MLL-TFE3, all in the presence of NRasG12D. MLL-trunc (blue line; n = 6), ΔHelix-LZip-Pro mice (green line; n = 6), ΔPro (orange line; n = 9), ΔTAD (lavender line; n = 10), MLL-TFE3 (red line; n = 11), and NRasG12D only mutation as a control (brown line; n = 10). There is a significant difference in survival between ΔPro and MLL-TFE3 mice (P = .0002). There is no significant difference in survival between ΔTAD and MLL-TFE3 mice (P = .9). Tick on the line indicates nonleukemic deaths, while asterisk indicates the end of experimental cohort. Some cohorts were extended beyond 120 days, but there was no leukemic event observed. (C) Immunofluorescence showing 293T cells transfected with the cloned fusions. Cells transfected with NRasG12D was included as a staining control. Green, anti-MLL antibody + Alexa Fluor 488; red, DsRed expression; blue, 4′,6-diamidino-2-phenylindole (nucleus). Scale bars, 20 µm. (D) Representative hematoxylin and eosin staining of liver and spleen (original magnification ×10; scale bars, 200 µm) of the ΔTAD mouse, ΔPro mouse, and a nonleukemic ΔHelix-LZip-Pro mouse, all in the presence of NRasG12D cooperating mutation. Blasts can be seen in the spleen and liver of ΔTAD and ΔPro, but not in the nonleukemic ΔHelix-LZip-Pro. (E) Volcano plots showing differential expression analysis of MLL-TFE3 relative to MLL-AF9 (left panel) and ΔTAD relative to MLL-AF9 (right panel). E-box genes with significantly higher DE in MLL-TFE3 (log-fold change >2.0, P < .05) are shown with labels. This gene list is also shown on the volcano plot of differential expression analysis between ΔTAD and MLL-AF9. The majority of these genes also had significant higher expression in ΔTAD compared with MLL-AF9, with the exceptions labeled in red. Purple, higher or lower expressed genes in MLL-TFE3 cells, with high confidence (P < .05); aqua, higher or lower expressed genes in MLL-TFE3, with low confidence (P > .05); cream, similarly expressed genes, with high confidence; gray, similarly expressed genes, with low confidence; n.s., nonsignificant (genes with P < .05). The plot was generated using EnhancedVolcano package.
TFE3-dependent transcription does not contribute to leukemogenesis. (A) MLL-TFE3 mutant truncations used in this study: MLL-trunc, ΔHelix-LZip-Pro, ΔTAD, and ΔPro; as well as the full-length MLL-TFE3. (B) Kaplan-Meier curves of the syngeneic mouse model of the mutants and the full-length MLL-TFE3, all in the presence of NRasG12D. MLL-trunc (blue line; n = 6), ΔHelix-LZip-Pro mice (green line; n = 6), ΔPro (orange line; n = 9), ΔTAD (lavender line; n = 10), MLL-TFE3 (red line; n = 11), and NRasG12D only mutation as a control (brown line; n = 10). There is a significant difference in survival between ΔPro and MLL-TFE3 mice (P = .0002). There is no significant difference in survival between ΔTAD and MLL-TFE3 mice (P = .9). Tick on the line indicates nonleukemic deaths, while asterisk indicates the end of experimental cohort. Some cohorts were extended beyond 120 days, but there was no leukemic event observed. (C) Immunofluorescence showing 293T cells transfected with the cloned fusions. Cells transfected with NRasG12D was included as a staining control. Green, anti-MLL antibody + Alexa Fluor 488; red, DsRed expression; blue, 4′,6-diamidino-2-phenylindole (nucleus). Scale bars, 20 µm. (D) Representative hematoxylin and eosin staining of liver and spleen (original magnification ×10; scale bars, 200 µm) of the ΔTAD mouse, ΔPro mouse, and a nonleukemic ΔHelix-LZip-Pro mouse, all in the presence of NRasG12D cooperating mutation. Blasts can be seen in the spleen and liver of ΔTAD and ΔPro, but not in the nonleukemic ΔHelix-LZip-Pro. (E) Volcano plots showing differential expression analysis of MLL-TFE3 relative to MLL-AF9 (left panel) and ΔTAD relative to MLL-AF9 (right panel). E-box genes with significantly higher DE in MLL-TFE3 (log-fold change >2.0, P < .05) are shown with labels. This gene list is also shown on the volcano plot of differential expression analysis between ΔTAD and MLL-AF9. The majority of these genes also had significant higher expression in ΔTAD compared with MLL-AF9, with the exceptions labeled in red. Purple, higher or lower expressed genes in MLL-TFE3 cells, with high confidence (P < .05); aqua, higher or lower expressed genes in MLL-TFE3, with low confidence (P > .05); cream, similarly expressed genes, with high confidence; gray, similarly expressed genes, with low confidence; n.s., nonsignificant (genes with P < .05). The plot was generated using EnhancedVolcano package.
Wild-type TFE3 regulates genes with E-box promoter sequence13 in addition to regulating the expression of CLEAR elements.14 Since the TAD of TFE3 is not required for leukemogenesis, we hypothesized that MLL-TFE3, when compared with MLL-AF9, would not preferentially target and alter the expression of these genes. Using the DsRed-sorted bone marrow cells obtained from the sacrificed leukemic mice, we performed a differential gene expression analysis comparing the gene expression of MLL-TFE3 cells relative to MLL-AF9 cells. We identified a small number of E-box genes with significantly higher expression in MLL-TFE3 cells (Figure 2E, left panel). However, most also had significantly higher expression in ΔTAD cells relative to MLL-AF9, indicating the higher expression of these E-box genes in MLL-TFE3 is independent of its TAD activity (Figure 2E, right panel). The functional significance of 4 E-box genes that were more highly expressed only in MLL-TFE3 cells and not the ΔTAD cells is not known. The expression of CLEAR elements is similar between MLL-TFE3 and MLL-AF9 (supplemental Figure 5). We also analyzed the expression of previously reported main targets of MLL fusions (Bcl2, Meis1, and Hoxa9) and found there was no significant difference in their expression between MLL-TFE3 and MLL-AF9 (supplemental Figure 5). Together, the results suggest that MLL-TFE3 does not transactivate TFE3 target genes, consistent with the in vivo results. Additionally, the similar expression level of Bcl2, Meis1, and Hoxa9 implies that MLL-TFE3, like other MLL fusions, also drives expression of these genes.
In this study, we have functionally characterized a novel MLL-r involving KMT2A and TFE3. In a murine leukemogenesis model, it has a similar short latency to the established MLL-AF9 fusion, in the presence of the NRasG12D cooperating mutation. Although TFE3 has a potent transactivation domain, TFE3-dependent transcription does not contribute to leukemogenesis or drug sensitivity in this fusion. Nevertheless, MLL-TFE3 is able to produce aggressive leukemia in a syngeneic mouse model, providing an additional tool for future studies in this field.
Requests for data sharing should be e-mailed to the corresponding author, Paul G. Ekert (e-mail: pekert@ccia.org.au).
Acknowledgments
The authors thank the Children’s Cancer Centre Tissue Bank of Murdoch Children’s Research Institute for the patient samples, Translational Genomics Unit of Victorian Clinical Genetics Services for running RNA-seq, the Murdoch Children’s Research Institute flow cytometry and imaging service for assisting with flow cytometry and microscopy, the Peter Mac Animal Core and Walter and Eliza Hall Institute bioservices facilities for technical assistance, and Marco Herold for technical advice and support.
This work was supported by the National Health and Medical Research Council (grant 1140626 [A.O., P.G.E., and N.M.D.] and grant 1081376 [G.B.]). P.G.E. and S.L.K. are investigators on Specialized Center of Research (SCOR) grant 7015-18 from the Lymphoma and Leukemia Society. S.L.K. and H.J.K. were supported by the Children’s Cancer Foundation and the Department of Health and Human Services through the Victorian Cancer Agency (Project 134). G.B. was supported by Cancer Australia and Leukaemia Foundation Australia (priority grant PdCCRS 1162023) and the Victoria Cancer Agency (grant MCRF 15027). S.B. was supported by an Australian Government Research Training Program Scholarship and the Peter MacCallum Cancer Foundation. M.S.B. was supported by the Cancer Council Victoria. R.W.J. was supported by the Cancer Council Victoria, National Health and Medical Research Council of Australia, and The Kids’ Cancer Project. This work was made possible through the Australian Cancer Research Foundation and Victorian State Government Operational Infrastructure Support and Australian Government (National Health and Medical Research Council Independent Research Institute Infrastructure Support Scheme [IRIISS] grant 9000433). The Peter MacCallum Foundation and Australian Cancer Research Foundation provided generous support for equipment and core facilities.
Authorship
Contribution: H.J.K. and P.G.E. designed the study; H.J.K. performed all the experiments, analyzed the data, and wrote the manuscript; G.B. performed in vivo experiments; S.L.K. wrote the clinical history of the patient; N.M.D. and A.O. assisted in bioinformatics analysis; S.B. and E.M. assisted in in vivo experiments; P.G.E., G.B., and S.L.K. assisted in manuscript preparation; and R.W.J. and M.S.B. contributed to the conception and conduct of in vivo experiments.
Conflict-of-interest disclosure: G.B., S.L.K., and P.G.E. are recipients of a share in milestone and royalty payments paid to the Walter and Eliza Hall Institute of Medical Research for the development of venetoclax. The Johnstone laboratory receives funding support from Roche, BMS, Astra Zeneca, and MecRx. R.W.J. is a scientific advisor and shareholder in MecRx. The remaining authors declare no competing financial interests.
Correspondence: Paul G. Ekert, Children’s Cancer Institute, Lowy Cancer Research Centre, C25/9 High St, Kensington, NSW 2750, Australia; e-mail: pekert@ccia.org.au; and Seong L. Khaw, Murdoch Children’s Research Institute, Royal Children's Hospital, 50 Flemington Rd, Parkville, VIC 3052, Australia; e-mail: seong.khaw@mcri.edu.au.

