

Key Points
Combination of HRI inhibition with HbF pharmacologic inducers results in cooperative upregulation of HbF and reduction in cell sickling.
HRI loss sensitizes erythroid cells to HbF induction with low doses of pomalidomide and acts via convergence on BCL11A-mediated pathways.

Abstract
Increasing fetal hemoglobin (HbF) provides clinical benefit in patients with sickle cell disease (SCD). We recently identified heme-regulated inhibitor (HRI, EIF2AK1), as a novel HbF regulator. Because HRI is an erythroid-specific protein kinase, it presents a potential target for pharmacologic intervention. We found that maximal HbF induction required >80% to 85% HRI depletion. Because it remains unclear whether this degree of HRI inhibition can be achieved pharmacologically, we explored whether HRI knockdown can be combined with pharmacologic HbF inducers to achieve greater HbF production and minimize potential adverse effects associated with treatments. Strongly cooperative HbF induction was observed when HRI depletion was combined with exposure to pomalidomide or the EHMT1/2 inhibitor UNC0638, but not to hydroxyurea. Mechanistically, reduction in the levels of the HbF repressor BCL11A reflected the cooperativity of HRI loss and pomalidomide treatment, whereas UNC0638 did not modulate BCL11A levels. In conjunction with HRI loss, pomalidomide maintained its HbF-inducing activity at 10-fold lower concentrations, in which condition there were minimal observed detrimental effects on erythroid cell maturation and viability, as well as fewer alterations in the erythroid transcriptome. When tested in cells from patients with SCD, combining HRI depletion with pomalidomide or UNC0638 achieved up to 50% to 60% HbF and 45% to 50% HbF, respectively, as measured by high-performance liquid chromatography, and markedly counteracted cell sickling. In summary, this study provides a foundation for the exploration of combining future small-molecule HRI inhibitors with additional pharmacologic HbF inducers to maximize HbF production and preserve erythroid cell functionality for the treatment of SCD and other hemoglobinopathies.
Introduction
The human β-globin locus consists of 1 embryonic (ε), 2 fetal (Gγ,Aγ), and 2 adult (δ, β) genes, all of which are under the control of a powerful distal enhancer termed the locus control region. Human fetal red blood cells primarily express γ-globin chains that are paired with 2 α-globin chains to form fetal hemoglobin (HbF). After birth, a developmental switch occurs, during which the γ-globin genes are transcriptionally silenced and the adult counterparts are activated to produce adult hemoglobin (α2β2, HbA). Importantly, elevated HbF levels related to genetic variation or therapeutic modulation by HbF inducers such as hydroxyurea (HU) attenuate the severity of hemoglobinopathies such as sickle cell disease (SCD).1 Reversing the developmental switch from HbA to HbF is therefore an important therapeutic goal. Key direct transcriptional repressors of γ-globin include BCL11A and LRF/ZBTB7A, both of which bind to the promoters of the γ-globin genes and recruit corepressor complexes. Loss of expression or disruption of their binding sites at the γ-globin genes leads to reactivation of γ-globin transcription.2-6 However, because transcription factors are challenging to target via small molecules, the identification of druggable HbF regulators remains a critical goal.
Previously, we discovered heme-regulated inhibitor (HRI), an erythroid-specific protein kinase, as a novel HbF regulator.7,8 HRI, also known as EIF2AK1, phosphorylates eIF2α to attenuate mRNA translation, particularly during times of erythropoietic stress.9-13 We further found that HRI, via augmenting ATF4 levels, promotes BCL11A transcription and HbF silencing.7,8 HRI-null mice exhibit minimal hematologic abnormalities under homeostatic conditions,8,9 and HRI loss is well tolerated in human erythroid cells in vitro,7 nominating HRI as a potential drug target for raising HbF levels.
HU is the only US Food and Drug Administration–approved drug used to raise HbF in patients with SCD.14,15 However, HU is beneficial in only a subset of patients and is of limited efficacy. Hence, there remains a need to develop more effective pharmacologic HbF inducers. Additional molecules with HbF-inducing activities in experimental settings include pomalidomide, a third-generation immunomodulatory imide drug,16-18 the EHMT1/2 histone methyltransferase inhibitor UNC0638,19,20 the histone deacetylase inhibitor entinostat,19,21-23 and the AMP-activated protein kinase activator metformin.24 Although the mechanisms by which HU, pomalidomide, and UNC0638 regulate HbF remain to be resolved, we hypothesized that they work in distinct, perhaps complementary, pathways. In this study, using a 3-phase in vitro culture system of healthy and SCD patient-derived adult CD34+ primary cells, we found that combining HRI depletion with pomalidomide or UNC0638 improved effect size, reduced cell sickling, and diminished potential adverse effects on erythroid differentiation, viability, and function. This study serves as a basis for further exploration of combinatorial approaches for pharmacologic HbF induction in a clinical setting once small-molecule HRI inhibitors become available.
Methods
Cells, cell culture, and HbF pharmacologic treatments
Peripheral blood mononuclear cells were obtained from the University of Pennsylvania Human Immunology Core (Philadelphia, PA). CD34+ cells were purified by using a MACS MicroBead kit (Miltenyi) and cultured in a 3-phase in vitro culture, as previously described.8 Cells were maintained in phase 1 from the day of collection until day 8, at which time the cells were spin infected and transitioned to phase 2 medium. On day 13 of culture, the cells were transitioned to phase 3 medium. For pharmacologic treatments, the cells were treated starting on day 6 of culture with 50 μM HU (Sigma-Aldrich), various doses of pomalidomide (Sigma-Aldrich), 0.125 μM UNC0638 (Tocris Biosciences), 0.1 μM entinostat (Sigma-Aldrich), or 100 μM metformin (Sigma-Aldrich). The drugs were replenished every 2 to 3 days. RNA samples for quantitative reverse transcription-polymerase reaction (qRT-PCR) were harvested on day 13 of culture for optimal RNA yield. Western blot analysis, high-performance liquid chromatography (HPLC), and HbF flow cytometry samples were harvested on day 15 of culture.
Plasmids, virus preparation, and infections
All short hairpin RNAs (shRNAs) used in this study were constructed as previously described.7 Oligonucleotides corresponding to the shRNAs are shown in supplemental Table 1. Two independent shRNAs targeting HRI were used for each sample, and scrambled nontargeting shRNA was used as the control. Lentivirus for the shRNAs were produced in HEK293T cells, as previously described,7,8 and concentrated using Lenti-X Concentrator (Takara Bio), according to the manufacturer’s specifications. Spin infection was performed on day 8 of culture, as previously described.7,8
RNP electroporation in CD34+ cells
Ribonucleoprotein (RNP)-based gene editing was performed according to our published method.8 For all RNP-based experiments, cells were treated with either dimethyl sulfoxide (DMSO) vehicle control or 1 μM pomalidomide starting at day 1 of culture, followed by RNP electroporation at day 2. Drugs were replenished every 2 to 3 days. Chemically modified single guide RNAs (sgRNAs) were purchased from Synthego. Two independent sgRNAs targeting HRI were used for each sample, whereas a nontargeting sgRNA was used as the control. sgRNA sequences are listed in supplemental Table 2.
RNA extraction, qRT-PCR, and RNA-Seq
RNA samples were harvested in TRIzol (ThermoFisher Scientific) and purified with the RNeasy Mini kit (Qiagen). Complementary DNAs were prepared by reverse transcription with iScript Supermix (Bio-Rad). qPCR reactions were prepared with Power SYBR Green (ThermoFisher Scientific) and run on a ViiA7 Real-Time qPCR machine (ThermoFisher Scientific). Data were normalized to RPS18 for all shRNA-based experiments and to the geometric mean of the relative quantities of RPS18, AHSP, and GAPDH for RNP-based experiments. Primers used for qRT-PCR are listed in supplemental Table 3. For RNA-sequencing (RNA-Seq), ∼200 ng RNA, isolated as just described, was depleted for ribosomal RNA and globins by using the Ribo-Zero removal reagents and protocol from the ScriptSeq Complete kit (Illumina), followed by purification with the RNeasy MinElute Clean Up kit (Qiagen). Sequencing libraries were constructed and analyzed, libraries were sequenced in paired-end mode, and reads were processed as previously described.25
Flow cytometric analysis, HPLC, and Wright-Giemsa staining
For HbF and differentiation analysis, 1.5 million cells at day 15 of culture were stained with Live/Dead Fixable Near-IR Dead Cell Stain Kit (L34976; ThermoFisher), per the manufacturer’s specifications, then washed in phosphate-buffered saline. Subsequently, the cells were fixed with 0.05% glutaraldehyde (Sigma-Aldrich), permeabilized with 0.1% Triton X-100 (Sigma-Aldrich), and stained with APC-HbF (MHFH05; Invitrogen), PE-CD71 (555537; BD Biosciences), and PECy7-CD235a (306620; Biolegend) at 1:100 dilution. Flow cytometry was performed on a BD FACSCanto system. Cation-exchange HPLC for quantification of HbF and Wright-Giemsa stains for erythroid morphology were performed as previously described.7,8 Cytospin images were captured at 10× resolution on an Olympus BX60 microscope with Infinity software (Lumenera Corporation).
Protein analysis
Western blot analysis was performed using fluorescent western procedures on Immoblion-FL polyvinylidene difluoride membrane (Millipore). Blocking was performed in Odyssey Blocking Buffer (Tris-buffered saline; Licor), and antibody staining was performed in the blocking buffer diluted 1:1 in Tris-buffered saline-Tween 20. Primary staining was performed overnight with gentle shaking at 4°C, and secondary staining was performed for 1 hour at room temperature. Primary and secondary antibodies are listed in supplemental Table 4. Blots were visualized at 700 and 800 nm on the Odyssey Imaging System (Licor) and quantitated in Image Studio Lite (Licor).
SCD CD34+ cell isolation, sickling assays, and imaging flow cytometry
SCD primary human cells were isolated from deidentified apheresis waste product from the Children’s Hospital of Philadelphia, and SCD CD34+ cells were purified with the MACS MicroBead kit (Miltenyi) and cultured in 3-phase in vitro culture, as previously described.8 Sickling assays and bright-field quantification were then performed.7,26 Imaging flow cytometry staining was performed by permeabilization of fixed SCD cells with 0.1% Triton X-100, staining with APC-HbF, PE-CD71 (BD Biosciences), and PECy7-CD235a (Biolegend) at 1:100 dilution, then addition of 1:1000 4′6-diamidino-2-phenylindole (ThermoFisher) as the nuclear stain immediately before analysis on the ImagestreamX imaging flow cytometer (Amnis/Luminex). Sickled cells were identified as focused single cells with low circularity and a low shape ratio (supplemental Figure 5), in a modification of previously published flow cytometric sickle cell analytic imaging methods.27
Results
Relationship between HRI and HbF levels
We have recently shown that HRI depletion can elevate HbF levels in primary human erythroid cells.7 However, the degree of HRI loss necessary for significant increases in γ-globin remained to be characterized. To this end, we varied the degree of HRI depletion by using 2 independent shRNAs (HRI shRNAs #1 and #2) in a 3-phase in vitro culture system of human CD34+ cells (Figure 1A). We observed a linear correlation between the extent of HRI depletion and γ-globin mRNA induction. This relationship was observed across multiple donors (Figure 1B) and across different shRNA hairpins in the same donor (Figure 1C). However, greater than fourfold induction of γ-globin required at least 80% to 85% depletion of HRI.
![HRI knockdown cooperates with pomalidomide and UNC0638 to significantly increase HbF levels. (A) The 3-phase CD34+ differentiation system used in combinatorial HbF pharmacologic induction and shRNA-mediated HRI depletion. (B) HRI transcript levels vs fold γ-globin induction using HRI shRNAs #1 and #2 titrated to various levels of HRI depletion (n = 6 independent donors). (C) HRI transcript levels vs fold γ-globin induction (single donor with 6 independent samples). Linear regression goodness of fit is displayed as the coefficient of determination (R2). (D) γ-Globin transcript levels (expressed as γ-globin/γ-globin+β-globin) in healthy CD34+ donors as measured by qRT-PCR after shRNA scrambled control or HRI depletion with 2 independent shRNAs combined with either vehicle control or HbF pharmacologic induction (50 μM hydroxyurea [HU], 1 μM pomalidomide [Pom], or 0.125 μM UNC0638). (E) Representative HbF flow cytometric plots. The percentage of F-cells is quantified for each](https://ash.silverchair-cdn.com/ash/content_public/journal/bloodadvances/4/18/10.1182_bloodadvances.2020002475/2/m_advancesadv2020002475f1-1.png?Expires=1769120927&Signature=oqslT99R6GlU6qgIaEyp4MQUS7RRSPAz-oy9UcR4f9jBKtrxQUBwLXscr3TLbMQ15cc164RrHMLlzEI9o6CGUjM0tZZasV-uyvvTXK515nCIWmfIdZh8ZVMYM3YBtrIl4zneCKou6NXFldGBw3kcXSyjRfBanh63Es-3AoZVOZqw6f1Jdajyjn8k1sFE89v6LAv16pHMaU7vlOR6FNLSCFLubxSRAEnYQE13VuGU4RQq9Q2oNGn5Az9uKrAEXDttWHWeZvsrw2jr93JrpEiZ9yHieEued8AYhXOhyfeB9Z4SvPgsnj4CGTHmXkwRdenU3oWxHBYcPyxAuFaDPHSGKg__&Key-Pair-Id=APKAIE5G5CRDK6RD3PGA)
![HRI knockdown cooperates with pomalidomide and UNC0638 to significantly increase HbF levels. (A) The 3-phase CD34+ differentiation system used in combinatorial HbF pharmacologic induction and shRNA-mediated HRI depletion. (B) HRI transcript levels vs fold γ-globin induction using HRI shRNAs #1 and #2 titrated to various levels of HRI depletion (n = 6 independent donors). (C) HRI transcript levels vs fold γ-globin induction (single donor with 6 independent samples). Linear regression goodness of fit is displayed as the coefficient of determination (R2). (D) γ-Globin transcript levels (expressed as γ-globin/γ-globin+β-globin) in healthy CD34+ donors as measured by qRT-PCR after shRNA scrambled control or HRI depletion with 2 independent shRNAs combined with either vehicle control or HbF pharmacologic induction (50 μM hydroxyurea [HU], 1 μM pomalidomide [Pom], or 0.125 μM UNC0638). (E) Representative HbF flow cytometric plots. The percentage of F-cells is quantified for each](https://ash.silverchair-cdn.com/ash/content_public/journal/bloodadvances/4/18/10.1182_bloodadvances.2020002475/2/m_advancesadv2020002475f1-2.png?Expires=1769120927&Signature=TGZCVkdds2cHDbqMdHMnCD1uyszEjDYeqEG-FBw674GLICoS3I0mEvXAMAoSFI9uVpDZH3plICwEJ5zBvodvC25eHkED7ME3NQITeIHVlRaUYKJ5tJ8Aaxgz-CM1OWU5BPPHg-p3j1sr8dgVr4CbfV1Ym4oAJj3h~GxTgVq4aMYoqjChMXtxhLRrXE6kfLX40v3IBFuspTBqh2K73g0o~3NjzwFNmYwHHHmg-95UcrP1tmmiEKFFnGmrGjM0iURhBQ~Yv1AKRqqR7DcYQjfxxcoqO2qPvwIzDFlBTrUHwAms3hAepO5ug~laCzUON0uV8odtJTonT1VTEffH-i49Ww__&Key-Pair-Id=APKAIE5G5CRDK6RD3PGA)
HRI knockdown cooperates with pomalidomide and UNC0638 to significantly increase HbF levels. (A) The 3-phase CD34+ differentiation system used in combinatorial HbF pharmacologic induction and shRNA-mediated HRI depletion. (B) HRI transcript levels vs fold γ-globin induction using HRI shRNAs #1 and #2 titrated to various levels of HRI depletion (n = 6 independent donors). (C) HRI transcript levels vs fold γ-globin induction (single donor with 6 independent samples). Linear regression goodness of fit is displayed as the coefficient of determination (R2). (D) γ-Globin transcript levels (expressed as γ-globin/γ-globin+β-globin) in healthy CD34+ donors as measured by qRT-PCR after shRNA scrambled control or HRI depletion with 2 independent shRNAs combined with either vehicle control or HbF pharmacologic induction (50 μM hydroxyurea [HU], 1 μM pomalidomide [Pom], or 0.125 μM UNC0638). (E) Representative HbF flow cytometric plots. The percentage of F-cells is quantified for each
HRI knockdown cooperates with pomalidomide and UNC0638 to significantly increase HbF levels. (A) The 3-phase CD34+ differentiation system used in combinatorial HbF pharmacologic induction and shRNA-mediated HRI depletion. (B) HRI transcript levels vs fold γ-globin induction using HRI shRNAs #1 and #2 titrated to various levels of HRI depletion (n = 6 independent donors). (C) HRI transcript levels vs fold γ-globin induction (single donor with 6 independent samples). Linear regression goodness of fit is displayed as the coefficient of determination (R2). (D) γ-Globin transcript levels (expressed as γ-globin/γ-globin+β-globin) in healthy CD34+ donors as measured by qRT-PCR after shRNA scrambled control or HRI depletion with 2 independent shRNAs combined with either vehicle control or HbF pharmacologic induction (50 μM hydroxyurea [HU], 1 μM pomalidomide [Pom], or 0.125 μM UNC0638). (E) Representative HbF flow cytometric plots. The percentage of F-cells is quantified for each
HRI knockdown cooperates with pomalidomide and UNC0638 to significantly increase γ-globin levels
As it is currently unknown whether a >80% HRI inhibition is achievable pharmacologically, we hypothesized that combining HRI depletion with existing pharmacologic HbF inducers would result in cooperative effects on HbF induction. Consequently, the cooperative effects on HbF induction may enable lowering the degree of HRI depletion and/or the candidate drug dose to achieve the desired effects, thus diminishing potential adverse effects of the treatments. We first tested a variety of compounds, including HU14,15 and experimental HbF inducers including pomalidomide,16-18 the EHMT1/2 inhibitor UNC0638,19,20 entinostat,22 and metformin,24 for the ability to induce HbF in human CD34+-derived erythroid cells. Although most of the tested compounds variably increased the number of HbF+ cells (F-cells) and HbF levels, and metformin HbF induction may have been slightly masked compared with prior studies24 because of the variability of the insulin concentration within culture media, we focused our combinatorial studies on HbF inducers with the greatest HbF induction, pomalidomide and UNC0638, as well as HU because it is in clinical use (supplemental Figures 1A-B).
Cells were treated with HU, pomalidomide, and UNC0638 starting at day 6 of culture in the context of ≥ ∼80% shRNA-mediated HRI depletion (supplemental Figure 2A). ΔHRI/pomalidomide (ΔHRI/pom) showed the highest levels of cooperativity, followed by ΔHRI/UNC0638, as measured by qRT-PCR (γ-globin; Figure 1D), flow cytometry (F-cells; Figure 1E; supplemental Figure 2B), or HPLC (HbF; Figure 1F-G). Although basal HbF levels varied among donors (Figure 1G), these trends persisted after combinatorial treatment; for instance, patients with a higher HbF baseline (squares; Figure 1G) also showed higher HbF levels after treatment. ΔHRI/HU failed to significantly increase HbF levels above those achieved by HRI depletion alone. Although prior studies have shown greater levels of HbF induction after HU treatment at higher concentrations in vitro,28 we saw significant loss of cell viability at higher doses of HU (data not shown), suggesting variability of HU tolerance and HbF response in vitro. Notably, ΔHRI/pom resulted in a two- to threefold increase in F-cells (up to 69% of cells; Figure 1E; supplemental Figure 2B). Importantly, HPLC analysis of ΔHRI/UNC0638 or ΔHRI/pom cells showed high levels of HbF induction, achieving 30% HbF and >40% HbF, respectively (Figure 1F-G). Taken together, depletion of HRI combined with UNC0638 or pomalidomide led to markedly increased HbF production compared with either treatment alone.
Because in a therapeutic setting cells would be HRI depleted and exposed to pomalidomide treatment throughout all stages of erythroid development, we also tested whether changing the timing of exposure would lead to different levels of HbF induction. However, shRNA-mediated HRI depletion combined with pomalidomide treatment at days 4 to 6 triggered nearly identical levels of γ-globin induction (data not shown). We recently reported that, for unclear reasons, depletion of HRI with shRNAs vs CRISPR-Cas9 RNPs can produce different effect sizes.8 Therefore, we also tested CRISPR-Cas9 RNP-based targeting of HRI at day 2 in healthy CD34+ cells. In this case, we achieved between ∼40% and 70% depletion in HRI resulting in an approximately twofold increase in γ-globin mRNA levels (by qRT-PCR) and HbF (by HPLC; supplemental Figure 2C; Figure 1H-I), similar to our prior findings.8 Notably, we observed robust cooperativity of RNP-based HRI depletion with pomalidomide treatment (starting at day 1) in terms of gains in γ-globin mRNA, number of F-cells (supplemental Figure 2C), and HbF protein levels (Figure 1H-I). These data indicate that HRI depletion combined with pomalidomide treatment drives cooperative HbF induction, independent of timing or method of HRI depletion.
Effects of HRI knockdown and pharmacologic HbF inducers on erythroid differentiation
HRI loss is generally well tolerated by erythroid cells under baseline conditions.7,9,10,12,13 However, because the exact mechanisms by which pomalidomide and UNC0638 exert their effects on HbF remain unclear, we tested whether any potential adverse effects may be exacerbated by HRI loss. Erythroid viability was preserved in all combinatorial treatments (data not shown), and erythroid maturation was maintained as determined by surface marker expression of CD71 and CD235a (Figure 2A-B), morphological analysis by Wright-Giemsa staining (Figure 2C), and expression of the erythroid-specific genes GATA1, ALAS2, and SLC4A1 (supplemental Figure 3A). Donor-to-donor variation in the degree of terminal differentiation (Figure 2B) seemed independent of the degree of HbF induction (Figure 1G).
![Erythroid differentiation is maintained overall with a combination of HRI knockdown and HbF pharmacologic treatments. (A) Representative flow cytometric analysis of erythroid differentiation in healthy CD34+ donors after shRNA scrambled control or HRI depletion with 2 independent shRNAs combined with either vehicle control or HbF pharmacologic induction (50 μM HU, 1 μM pomalidomide [Pom], or 0.125 μM UNC0638). Percentages denote frequency of parent population. (B) Quantification of flow cytometric analysis of erythroid differentiation by CD71+CD235a+ vs CD71−CD235a+ populations. Each symbol (circle, square, triangle) represents a biologically independent sample. (C) Representative Wright-Giemsa staining of erythroid cells. Cytospin images were captured at 10× resolution on an Olympus BX60 microscope with Infinity software. DMSO served as the pharmacologic vehicle control. Three independent biological replicates for all experiments. Error bars represent standard deviation. (D-F) RNA-Seq combinatorial analyses of DMSO-treated control shRNA samples vs DMSO-treated HRI shRNA #2 samples (D), DMSO-treated control shRNA samples vs pomalidomide-treated HRI shRNA #2 samples (E), and DMSO-treated control shRNA samples vs UNC0638-treated HRI shRNA #2 samples (F). Erythroid maturation upregulated genes (red) include (1) GATA1, (2) KEL, (3) ANK1, (4) KLF1, (5) FOXO3, (6) AHSP, (7) EPB42, (8) GYPA, (9) ALAS2, (10) SLC4A1 (BAND3), and (11) SLC25A37. Erythroid maturation downregulated genes (green) include (12) GATA2, (13) JUN, (14) MYC, (15) CD44, (16) MYB, (17) KIT, (18) CASP3, and (19) PCNA. Two independent biological replicates for RNA-Seq analysis.](https://ash.silverchair-cdn.com/ash/content_public/journal/bloodadvances/4/18/10.1182_bloodadvances.2020002475/2/m_advancesadv2020002475f2.png?Expires=1769120927&Signature=lGLcVw-02YDlt9VwIEhljY06gblLhXFRu59RiNvhUpF0Pi0LMJ1wualo3pmcCIQCMsVvadF9e~HSx3H4rHNcQaY4G1NxsgnDY~7OXOjXkf9bA4i9qcTqGk67yCQ18L-KpG~MYWApEbrB5qZTed0iystPlxT7wbvbW5la4GfqAXKHwvU9Wrz3yV3j0KIXE1G6iVD0HUWs49vd5AOlA--JbjFaAtJFqG9yY71uJVg4msYu4vdfDqRWZJ4xhbWcziCDS4Xg~rBfdxAgZMm2qravkJe3fCZc1xL68-QuIzNdl7Q9X~fQZnC61216GyTjymmUHDaG2N5NQ4My-ff1GlOAHg__&Key-Pair-Id=APKAIE5G5CRDK6RD3PGA)
Erythroid differentiation is maintained overall with a combination of HRI knockdown and HbF pharmacologic treatments. (A) Representative flow cytometric analysis of erythroid differentiation in healthy CD34+ donors after shRNA scrambled control or HRI depletion with 2 independent shRNAs combined with either vehicle control or HbF pharmacologic induction (50 μM HU, 1 μM pomalidomide [Pom], or 0.125 μM UNC0638). Percentages denote frequency of parent population. (B) Quantification of flow cytometric analysis of erythroid differentiation by CD71+CD235a+ vs CD71−CD235a+ populations. Each symbol (circle, square, triangle) represents a biologically independent sample. (C) Representative Wright-Giemsa staining of erythroid cells. Cytospin images were captured at 10× resolution on an Olympus BX60 microscope with Infinity software. DMSO served as the pharmacologic vehicle control. Three independent biological replicates for all experiments. Error bars represent standard deviation. (D-F) RNA-Seq combinatorial analyses of DMSO-treated control shRNA samples vs DMSO-treated HRI shRNA #2 samples (D), DMSO-treated control shRNA samples vs pomalidomide-treated HRI shRNA #2 samples (E), and DMSO-treated control shRNA samples vs UNC0638-treated HRI shRNA #2 samples (F). Erythroid maturation upregulated genes (red) include (1) GATA1, (2) KEL, (3) ANK1, (4) KLF1, (5) FOXO3, (6) AHSP, (7) EPB42, (8) GYPA, (9) ALAS2, (10) SLC4A1 (BAND3), and (11) SLC25A37. Erythroid maturation downregulated genes (green) include (12) GATA2, (13) JUN, (14) MYC, (15) CD44, (16) MYB, (17) KIT, (18) CASP3, and (19) PCNA. Two independent biological replicates for RNA-Seq analysis.
Erythroid differentiation is maintained overall with a combination of HRI knockdown and HbF pharmacologic treatments. (A) Representative flow cytometric analysis of erythroid differentiation in healthy CD34+ donors after shRNA scrambled control or HRI depletion with 2 independent shRNAs combined with either vehicle control or HbF pharmacologic induction (50 μM HU, 1 μM pomalidomide [Pom], or 0.125 μM UNC0638). Percentages denote frequency of parent population. (B) Quantification of flow cytometric analysis of erythroid differentiation by CD71+CD235a+ vs CD71−CD235a+ populations. Each symbol (circle, square, triangle) represents a biologically independent sample. (C) Representative Wright-Giemsa staining of erythroid cells. Cytospin images were captured at 10× resolution on an Olympus BX60 microscope with Infinity software. DMSO served as the pharmacologic vehicle control. Three independent biological replicates for all experiments. Error bars represent standard deviation. (D-F) RNA-Seq combinatorial analyses of DMSO-treated control shRNA samples vs DMSO-treated HRI shRNA #2 samples (D), DMSO-treated control shRNA samples vs pomalidomide-treated HRI shRNA #2 samples (E), and DMSO-treated control shRNA samples vs UNC0638-treated HRI shRNA #2 samples (F). Erythroid maturation upregulated genes (red) include (1) GATA1, (2) KEL, (3) ANK1, (4) KLF1, (5) FOXO3, (6) AHSP, (7) EPB42, (8) GYPA, (9) ALAS2, (10) SLC4A1 (BAND3), and (11) SLC25A37. Erythroid maturation downregulated genes (green) include (12) GATA2, (13) JUN, (14) MYC, (15) CD44, (16) MYB, (17) KIT, (18) CASP3, and (19) PCNA. Two independent biological replicates for RNA-Seq analysis.
For a deeper analysis of cellular changes that may have occurred upon treatment, we performed RNA-Seq. Globally, the erythroid transcriptional program was preserved after HRI loss, alone or when combined with either pomalidomide or UNC0638, with no overt differences in upregulated or downregulated erythroid genes when compared with DMSO control (Figure 2D-F; supplemental Tables 5-7). We classified gene expression changes by gene set enrichment analysis with published transcriptome data sets across erythroid differentiation in CD34+-derived erythroid cultures.29 Gene clusters 1 and 3 were derived from this data set and consisted of transcripts that are continually upregulated and downregulated, respectively, during erythroid maturation.25,29 Gene set enrichment analysis showed that HRI-depleted samples, either alone or combined with either pomalidomide or UNC0638, were slightly positively enriched for cluster 1 and negatively enriched for cluster 3, suggesting a mild maturational acceleration (supplemental Figure 3B). Overall, these data are consistent with preserved erythroid maturation and viability across samples, including those with the highest HbF induction.
HRI cooperativity proceeds through both BCL11A-dependent and -independent pathways
As BCL11A and LRF/ZBTB7A together account for most γ-globin transcriptional repression,3 we tested whether they are mechanistically linked during HRI depletion or pharmacologic HbF induction. BCL11A levels were reduced upon HRI knockdown, whereas LRF/ZBTB7A levels were unchanged (Figure 3A-B), consistent with our prior findings.7 Pomalidomide alone moderately decreased BCL11A transcript and protein levels (Figure 3A,C-D), in line with results in a previous report.17 UNC0638 did not measurably affect BCL11A or LRF/ZBTB7A expression (Figure 3A-D), suggesting that it functions via a different mechanism. However, combining HRI depletion and pomalidomide reduced BCL11A mRNA and protein production by ∼90% compared with 60% to 65% with HRI depletion alone (Figure 3A,C-D). LRF/ZBTB7A transcript and protein levels remained unchanged (Figure 3B-D). In contrast, cooperativity provided by UNC0638 treatment seemed to proceed independent of BCL11A or LRF/ZBTB7A (Figure 3A-D). Finally, we found that triple treatment (loss of HRI combined with both pomalidomide and UNC0638) led to further increases in γ-globin (75% to 80%) and HbF (≥65%, by HPLC analysis; supplemental Figure 4A-D), suggesting that, in vitro, 2 treatments still did not achieve full HbF-inducing potential.
![BCL11A-dependent and independent cooperativities after combinatorial HRI depletion and HbF pharmacologic induction. (A) BCL11A transcript levels (normalized to DMSO control) in healthy CD34+ donors, as measured by qRT-PCR after shRNA scrambled control or HRI depletion with 2 independent shRNAs combined with either vehicle control or HbF pharmacologic induction (50 μM hydroxyurea [HU], 1 μM pomalidomide [Pom], or 0.125 μM UNC0638). (B) LRF/ZBTB7A transcript levels (normalized to DMSO control) as measured by qRT-PCR. Each symbol (circle, square, triangle) represents a biologically independent sample. (C) Representative western blot after shRNA scrambled control or HRI depletion with HRI shRNA #2 combined with HbF pharmacologic inducers. (D) Western blot quantification of BCL11A protein levels and LRF/ZBTB7A protein levels from 3 independent biological samples, normalized to total protein levels. Statistical analyses by 2-way analysis of variance. Significance vs DMSO control. Three independent biological replicates for all experiments. Error bars represent standard deviation. ***P < .001. (E) Hierarchical clustering using all genes (unsupervised) of RNA-Seq data after shRNA-mediated HRI depletion combined with vehicle control, 1 μM pomalidomide, or 0.125 μM UNC0638. (F) Principal component analysis of RNA-Seq data (red, donor replicate #1; blue, donor replicate #2). Percentage variance represented by each principal component axis. (G) RNA-Seq data visualized as log2 fold change in expression of known HbF regulators. DMSO served as the pharmacologic vehicle control. Two independent biological replicates for RNA-Seq analysis. **Absolute change >1.5-fold and adjusted P < .05.](https://ash.silverchair-cdn.com/ash/content_public/journal/bloodadvances/4/18/10.1182_bloodadvances.2020002475/2/m_advancesadv2020002475f3.png?Expires=1769120927&Signature=qInzdnbXrrv-X5kgQvQ5XXh8JX-vjRn0sF8tZwGar~0JHsiyocAi3WOImtuF8RRkt6eED2IHGmNmsYXrr0UJdd3~nOBxAz8BHAJewC8WjbBF6A~KLWItelFZ0LovFUTNvNVLeWLXFVR2yoBrkmFHvR9ChW43OdSss47kkp2uQEzRl43IV1UZckKt9MNp7UNfwJWHCWFTfsDgjOWeaR85uPkgFR1mxoI6nMCtxO2h9iLvwXWCZ5gszF7w02CGJxlveaKLCUlxC~uC0uZbzMKvCOjS7qua2Kc9wxklIMNwWHcAheQST~nDL3ZmAM0oQzZWDKeZkkY-~2Rls1gxDauVCQ__&Key-Pair-Id=APKAIE5G5CRDK6RD3PGA)
BCL11A-dependent and independent cooperativities after combinatorial HRI depletion and HbF pharmacologic induction. (A) BCL11A transcript levels (normalized to DMSO control) in healthy CD34+ donors, as measured by qRT-PCR after shRNA scrambled control or HRI depletion with 2 independent shRNAs combined with either vehicle control or HbF pharmacologic induction (50 μM hydroxyurea [HU], 1 μM pomalidomide [Pom], or 0.125 μM UNC0638). (B) LRF/ZBTB7A transcript levels (normalized to DMSO control) as measured by qRT-PCR. Each symbol (circle, square, triangle) represents a biologically independent sample. (C) Representative western blot after shRNA scrambled control or HRI depletion with HRI shRNA #2 combined with HbF pharmacologic inducers. (D) Western blot quantification of BCL11A protein levels and LRF/ZBTB7A protein levels from 3 independent biological samples, normalized to total protein levels. Statistical analyses by 2-way analysis of variance. Significance vs DMSO control. Three independent biological replicates for all experiments. Error bars represent standard deviation. ***P < .001. (E) Hierarchical clustering using all genes (unsupervised) of RNA-Seq data after shRNA-mediated HRI depletion combined with vehicle control, 1 μM pomalidomide, or 0.125 μM UNC0638. (F) Principal component analysis of RNA-Seq data (red, donor replicate #1; blue, donor replicate #2). Percentage variance represented by each principal component axis. (G) RNA-Seq data visualized as log2 fold change in expression of known HbF regulators. DMSO served as the pharmacologic vehicle control. Two independent biological replicates for RNA-Seq analysis. **Absolute change >1.5-fold and adjusted P < .05.
BCL11A-dependent and independent cooperativities after combinatorial HRI depletion and HbF pharmacologic induction. (A) BCL11A transcript levels (normalized to DMSO control) in healthy CD34+ donors, as measured by qRT-PCR after shRNA scrambled control or HRI depletion with 2 independent shRNAs combined with either vehicle control or HbF pharmacologic induction (50 μM hydroxyurea [HU], 1 μM pomalidomide [Pom], or 0.125 μM UNC0638). (B) LRF/ZBTB7A transcript levels (normalized to DMSO control) as measured by qRT-PCR. Each symbol (circle, square, triangle) represents a biologically independent sample. (C) Representative western blot after shRNA scrambled control or HRI depletion with HRI shRNA #2 combined with HbF pharmacologic inducers. (D) Western blot quantification of BCL11A protein levels and LRF/ZBTB7A protein levels from 3 independent biological samples, normalized to total protein levels. Statistical analyses by 2-way analysis of variance. Significance vs DMSO control. Three independent biological replicates for all experiments. Error bars represent standard deviation. ***P < .001. (E) Hierarchical clustering using all genes (unsupervised) of RNA-Seq data after shRNA-mediated HRI depletion combined with vehicle control, 1 μM pomalidomide, or 0.125 μM UNC0638. (F) Principal component analysis of RNA-Seq data (red, donor replicate #1; blue, donor replicate #2). Percentage variance represented by each principal component axis. (G) RNA-Seq data visualized as log2 fold change in expression of known HbF regulators. DMSO served as the pharmacologic vehicle control. Two independent biological replicates for RNA-Seq analysis. **Absolute change >1.5-fold and adjusted P < .05.
To further explore the mechanism underlying the combinatorial effects of HRI depletion and HbF pharmacologic induction, we performed RNA-Seq analysis. Hierarchical clustering analysis (Figure 3E) and principal component analysis (Figure 3F) showed that the greatest degree of transcriptomic variation came from HRI depletion (principal component 1; 39.9%), followed by pomalidomide treatment (principal component 2; 22.9%). Donor replicates were clustered closely within treatment groups with consistent differences (Figure 3E-F). UNC0638 caused fewer transcriptional changes than pomalidomide relative to vehicle control (Figure 3E-F), consistent with prior observations.19 In agreement with the qRT-PCR data (Figures 3A-D), pomalidomide further reduced BCL11A levels compared with HRI loss alone (Figure 3G). In contrast, ΔHRI/UNC0638 and ΔHRI samples had the same BCL11A levels. Expression of additional known HbF regulators (LRF/ZBTB7A, SPOP, SOX6, FOXO3, HMGA2, MBD2, CHD4, and LSD1/KDM1A) was largely unperturbed in HRI-depleted samples and did not show any further significant changes with either pomalidomide or UNC0638 treatment (Figure 3G). Finally, UNC0638 and pomalidomide treatment did not alter HRI expression (Figure 3G). Taken together, these data suggest that HRI loss and pomalidomide treatment cooperatively act in large part via convergence on BCL11A.
HRI loss sensitizes erythroid cells to pomalidomide
Any treatment with HbF inducers would be administered at the lowest possible dose that balanced optimal HbF induction with minimal adverse effects. In the case of pomalidomide, prior studies have shown that decreasing its dose below 1 μM leads to significantly less HbF induction in vitro.16,17 In line with these studies, we found that treatment of primary erythroid cultures with 1 μM pomalidomide achieved a two- to threefold increase in γ-globin levels (∼15% γ-globin), with a rapid loss of HbF induction with doses of 0.1 or 0.01 μM (Figure 4A). Surprisingly, when pomalidomide dose-titration was performed in HRI-depleted primary erythroid cells, high γ-globin transcript levels were maintained, even at a 10-fold dose reduction to 0.1 μM (Figure 4A). The cooperativity between low-dose pomalidomide treatment and HRI loss was also evidenced by persistent F-cell induction, measured by flow cytometric analysis (Figure 4B). Elevated HbF induction at the low 0.1 µM pomalidomide concentration was confirmed by HPLC (Figure 4C). Together, these results indicate that HRI loss sensitizes cells to HbF induction, allowing for lower-dose pomalidomide treatment.
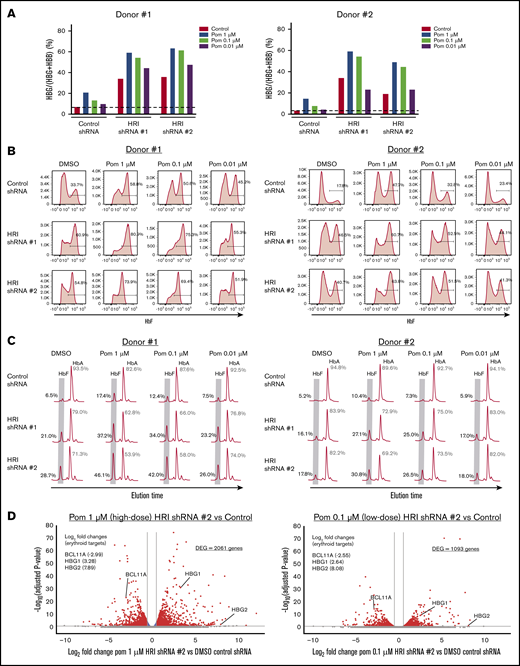
HRI loss sensitizes cells to low doses of pomalidomide. (A) γ-Globin levels (expressed as γ-globin/γ-globin+β-globin) in healthy CD34+ donors as measured by qRT-PCR after shRNA scrambled control or HRI depletion with 2 independent shRNAs combined with either vehicle control or treatment with 1, 0.1, or 0.01 μM of pomalidomide (Pom). (B) Representative HbF flow cytometric plots. Percentage of F-cells quantified for each sample. (C) Representative HPLC tracings of HbF and HbA (quantified as the percentage of total HbF+HbA peaks). (D) RNA-Seq combinatorial analysis of DMSO-treated control shRNA samples vs pomalidomide-treated HRI shRNA #2 samples at 1 μM (high dose) or 0.1 μM (low-dose) pomalidomide plotted as log2-fold change vs −log10-adjusted P value. Red, absolute fold change >1.5 and adjusted P < .05; blue, absolute fold change ≤1.5 and adjusted P < .05; gray, not significant. Two independent biological replicates for all experiments. DMSO served as the pharmacologic vehicle control. Error bars represent standard deviation. DEG, differentially expressed gene.
HRI loss sensitizes cells to low doses of pomalidomide. (A) γ-Globin levels (expressed as γ-globin/γ-globin+β-globin) in healthy CD34+ donors as measured by qRT-PCR after shRNA scrambled control or HRI depletion with 2 independent shRNAs combined with either vehicle control or treatment with 1, 0.1, or 0.01 μM of pomalidomide (Pom). (B) Representative HbF flow cytometric plots. Percentage of F-cells quantified for each sample. (C) Representative HPLC tracings of HbF and HbA (quantified as the percentage of total HbF+HbA peaks). (D) RNA-Seq combinatorial analysis of DMSO-treated control shRNA samples vs pomalidomide-treated HRI shRNA #2 samples at 1 μM (high dose) or 0.1 μM (low-dose) pomalidomide plotted as log2-fold change vs −log10-adjusted P value. Red, absolute fold change >1.5 and adjusted P < .05; blue, absolute fold change ≤1.5 and adjusted P < .05; gray, not significant. Two independent biological replicates for all experiments. DMSO served as the pharmacologic vehicle control. Error bars represent standard deviation. DEG, differentially expressed gene.
To examine the transcriptional impact of pomalidomide dose titration, we performed RNA-Seq analysis of 1 μM pomalidomide (high-dose) HRI-depleted samples, 0.1 μM pomalidomide (low-dose) HRI-depleted samples, and vehicle-only control samples (Figure 4D). When combined with HRI depletion, 0.1 μM pomalidomide treatment showed significantly fewer differentially expressed genes compared with 1 μM, with 1093 vs 2061 differentially expressed genes, respectively. Despite the significant reduction in transcriptional changes, low-dose pomalidomide combined with HRI loss maintained BCL11A depletion and HBG1/2 induction to a degree similar to that obtained with 1 µM pomalidomide. These data suggest that combining HRI depletion with low-dose pomalidomide may be an effective approach to increasing HbF while reducing pomalidomide exposure and the resulting adverse effects.
HRI depletion and drug exposure cooperate to reduce sickling
We tested whether the cooperativity of HRI depletion and drug exposure during HbF production is also reflected in the effects on cell sickling. As in healthy donor CD34+ cells, in SCD patient-derived cultures the combination of shRNA-mediated HRI depletion with HbF inducers consistently achieved >80% depletion of HRI in all samples (supplemental Figure 5A). Notably, basal levels of HbF and F-cells were higher and more variable in samples from patients with SCD, compared with those from healthy donors (Figure 5A-D). HRI depletion showed significant cooperativity with pomalidomide and UNC0638, as measured by qRT-PCR (γ-globin; Figure 5A), flow cytometry (F-cells; Figure 5B; supplemental Figure 5B), or HPLC (Figure 5C-D), with the latter method measuring 45% to 50% HbF for ΔHRI/UNC0638 and 50% to 60% HbF for ΔHRI/pom cells (Figures 5C-D). Next, after low-oxygen exposure in vitro, SCD sickling was assayed by bright-field microscopy (Figure 5E) or by imaging flow cytometry on the ImageStream platform, in which sickled cells were specifically identified by combining cellular features such as shape ratio and circularity (supplemental Figures 6A-B). Both methods showed that the combination of HRI knockdown and either pomalidomide or UNC0638 markedly reduced in vitro sickling (Figure 5F; supplemental Figure 6C). Notably, pomalidomide treatment alone reduced cell sickling, trending with increased levels of F-cell induction (Figure 5B,F). Nevertheless, HRI depletion combined with pomalidomide treatment elicited ∼75% reduction in cell sickling (Figure 5F), in keeping with a significant increase in HbF expression (Figure 5C-D). Taken together, these data are consistent with significant HbF cooperativity of HRI loss and either UNC0638 or pomalidomide treatment in ameliorating cell sickling in primary SCD patient-derived cells.
![HRI knockdown induces HbF to high levels in SCD patient-derived cells and cooperates with pomalidomide and UNC0638. (A) γ-Globin levels (expressed as γ-globin/γ-globin+β-globin) in patient-derived SCD samples as measured by qRT-PCR after shRNA scrambled control or HRI depletion with 2 independent shRNAs combined with either vehicle control or HbF pharmacologic induction (50 μM HU, 1 μM pomalidomide [Pom], or 0.125 μM UNC0638). (B) Representative HbF flow cytometric plots. Percentage of F-cells quantified for each sample. (C) Representative HPLC tracings of HbF and HbS. (D) HbF levels (quantified as percent of total HbF+HbS peaks) by HPLC. Each symbol (circle, square, triangle, diamond) represents a biologically independent sample. (E) Representative bright-field images or flow cytometry image capture of SCD-derived cells after 2% O2 exposure (low-O2 sickling assay). Brightfield images were captured at 40× resolution on an Olympus BX60 microscope with Infinity software, while imaging flow cytometry images were captured at 60× resolution on an ImagestreamX imaging flow cytometer. (F) Quantitation by bright-field microscopy of percentage of sickled cells (normalized to DMSO control) after a low-O2 sickling assay. DMSO serves as pharmacologic vehicle control. Three independent biological replicates for all experiments. Statistical analyses by 2-way analysis of variance. Error bars represent standard deviation. *P < .05; **P < .01; ***P < .001, vs DMSO control.](https://ash.silverchair-cdn.com/ash/content_public/journal/bloodadvances/4/18/10.1182_bloodadvances.2020002475/2/m_advancesadv2020002475f5.png?Expires=1769120927&Signature=BqazeBwRvAcAtgD5EyV8kA4eBjzVh~z~I6JoiD~YO8f5vqRpH7RNW-w~wyHReyHWWOVYkVUl3bxoIbEZX3~Oap3fgxUKs-XvHOya2tW~ctB1bv3kJJiero7BMnjbhNyTBelGuFA7VBbS-1tIKOvK28KYXD5~uAk-W1pnjQlKv6idqJky1PvhE4m1kdfD2xsN0tplZHRtR7jqclkg7qzHjvuHyvL6nvtLU1AiG9xzQr5Tmeth32tzYP5zBtr-aHMT6twTAucU~BXEVhpiRUlSdAKVF8zpwUourcErRni5aXaPDm-aiObTDtgKFQH2n9aOdZO~qBrnwuibYoRX1EatQg__&Key-Pair-Id=APKAIE5G5CRDK6RD3PGA)
HRI knockdown induces HbF to high levels in SCD patient-derived cells and cooperates with pomalidomide and UNC0638. (A) γ-Globin levels (expressed as γ-globin/γ-globin+β-globin) in patient-derived SCD samples as measured by qRT-PCR after shRNA scrambled control or HRI depletion with 2 independent shRNAs combined with either vehicle control or HbF pharmacologic induction (50 μM HU, 1 μM pomalidomide [Pom], or 0.125 μM UNC0638). (B) Representative HbF flow cytometric plots. Percentage of F-cells quantified for each sample. (C) Representative HPLC tracings of HbF and HbS. (D) HbF levels (quantified as percent of total HbF+HbS peaks) by HPLC. Each symbol (circle, square, triangle, diamond) represents a biologically independent sample. (E) Representative bright-field images or flow cytometry image capture of SCD-derived cells after 2% O2 exposure (low-O2 sickling assay). Brightfield images were captured at 40× resolution on an Olympus BX60 microscope with Infinity software, while imaging flow cytometry images were captured at 60× resolution on an ImagestreamX imaging flow cytometer. (F) Quantitation by bright-field microscopy of percentage of sickled cells (normalized to DMSO control) after a low-O2 sickling assay. DMSO serves as pharmacologic vehicle control. Three independent biological replicates for all experiments. Statistical analyses by 2-way analysis of variance. Error bars represent standard deviation. *P < .05; **P < .01; ***P < .001, vs DMSO control.
HRI knockdown induces HbF to high levels in SCD patient-derived cells and cooperates with pomalidomide and UNC0638. (A) γ-Globin levels (expressed as γ-globin/γ-globin+β-globin) in patient-derived SCD samples as measured by qRT-PCR after shRNA scrambled control or HRI depletion with 2 independent shRNAs combined with either vehicle control or HbF pharmacologic induction (50 μM HU, 1 μM pomalidomide [Pom], or 0.125 μM UNC0638). (B) Representative HbF flow cytometric plots. Percentage of F-cells quantified for each sample. (C) Representative HPLC tracings of HbF and HbS. (D) HbF levels (quantified as percent of total HbF+HbS peaks) by HPLC. Each symbol (circle, square, triangle, diamond) represents a biologically independent sample. (E) Representative bright-field images or flow cytometry image capture of SCD-derived cells after 2% O2 exposure (low-O2 sickling assay). Brightfield images were captured at 40× resolution on an Olympus BX60 microscope with Infinity software, while imaging flow cytometry images were captured at 60× resolution on an ImagestreamX imaging flow cytometer. (F) Quantitation by bright-field microscopy of percentage of sickled cells (normalized to DMSO control) after a low-O2 sickling assay. DMSO serves as pharmacologic vehicle control. Three independent biological replicates for all experiments. Statistical analyses by 2-way analysis of variance. Error bars represent standard deviation. *P < .05; **P < .01; ***P < .001, vs DMSO control.
Discussion
In this study, we determined the relationship between the degree of HRI depletion and HbF induction and observed that HRI reduction of >80% is needed to achieve marked HbF elevation in cultured human erythroid cells. We further found that HRI depletion when combined with pomalidomide or UNC0638 achieved high-level production of HbF in normal and SCD patient-derived primary cells in vitro, leading to significant reduction in cell sickling. Our findings further strengthen the multiagent approach to raising HbF levels that has been found in prior preclinical studies, including the additive HbF effects seen after cotreatment with pomalidomide and HU16 or with UNC0638 combined with HDAC inhibition or decitabine.19 A prior study in a humanized murine model failed to find cooperative effects of pomalidomide and HU during HbF induction,18 whereas another study in primary cultured human cells reported that effects were gained when the 2 compounds were combined.16 It is possible that the difference in outcomes lies in the species differences or in the use of whole animals vs cultured cells. Importantly, our results indicate that HRI depletion cooperates with pomalidomide, which is an HbF inducer that affects BCL11A levels, as well as with UNC0638, which does not. Upon HRI depletion, pomalidomide doses substantially lower than those normally used in these assays maintained significant HbF-inducing ability but reduced overall effects on the transcriptome. The data suggest that HRI-directed inhibition serves as a foundation for combinatorial therapeutic approaches to cooperatively increase HbF levels in the treatment of SCD.
Previous studies on the pharmacologic treatment of SCD frequently considered single drug regimens,14,15 yet very few individual compounds have been effective in consistently raising HbF to therapeutically beneficial levels. Although newer clinical studies are using combinatorial therapies, such as cotreatment with HU and l-glutamine,30 crizanlizumab,31,32 or voxelotor,33 these combinations target different physiologies (oxidative stress, P-selectin binding, and hemoglobin oxygen affinity, respectively). A multimodal approach that incorporates these options along with optimized HbF induction may further improve outcomes.
Under steady-state conditions, HRI-null mice display essentially normal erythropoiesis.8,9 However, HRI loss can exacerbate ineffective erythropoiesis in mouse models of erythropoietic protoporphyria and β-thalassemia,34 which is an important consideration when exploring HRI inhibition as therapy for SCD. Our experiments did not show overtly detrimental effects on erythropoiesis in cells from healthy donors or patients with SCD, of course within the limitations of an in vitro model system. If therapeutically relevant HbF levels can be achieved via HRI inhibition and additional treatments, erythropoietic stress may be alleviated and HRI deficiency tolerated by the cells. Because targeting of HRI is unlikely to be complete regardless of modality, residual HRI levels may retain protective functions as well.
Despite previous studies describing a slowing of erythroid maturation by pomalidomide treatment in early erythroid progenitors,16,17 we observed no significant changes in erythroid differentiation at day 15 of culture with either pomalidomide monotherapy or after combination of pomalidomide treatment with HRI depletion. These findings are consistent with those of prior in vitro studies showing minimal effects of pomalidomide on terminal erythroid differentiation,17 and with human clinical studies that showed minimal detrimental effects of pomalidomide treatment on peripheral red cell counts.35,36 Interestingly, our in vitro pomalidomide dose-titration data indicated that, when combined with HRI depletion, nearly equivalent levels of HbF induction were achieved with a 10-fold decrease in pomalidomide dose, with significantly fewer changes in the global transcriptome. Although difficult to compare directly with in vitro data, clinical findings from low-dose pomalidomide exposures in myelofibrosis and patients with multiple myeloma show decreased incidence of neutropenia and venous thromboembolism,35,36 suggesting that similar dose reductions in vivo would result in fewer pomalidomide side effects. Thus, these data suggest that future HRI combinatorial strategies would allow for sustained HbF induction at dramatically lower doses of pomalidomide, potentially leading to reduction in the incidence of off-target adverse effects.
HRI may be an attractive target for the development of small molecular inhibitors, as it is expressed in an erythroid-specific manner. Based on our in vitro data, we anticipate that in vivo HRI depletion will cooperate with other HbF inducers to lead to a higher therapeutic index. Future clinical studies with HRI inhibitors are needed to test the efficacy of HRI inhibition alone or in combination with other treatment of their effectiveness in raising HbF levels and improving outcomes in patients with SCD and other hemoglobinopathies.
RNA-Seq data are deposited in the Gene Expression Omnibus (accession number GSE150341). For additional original data requests, please contact the corresponding author, Scott A. Peslak (scott.peslak@pennmedicine.upenn.edu).
Acknowledgments
The authors thank Stella Chou for assistance in obtaining SCD-derived samples, members of the laboratory for helpful discussions, and the Children’s Hospital of Philadelphia Flow Cytometry Core for experimental assistance.
This work was supported by National Institutes of Health, National Heart, Lung, and Blood Institute grants R01HL119479 (G.A.B.) and T32HL007439 (S.A.P); Doris Duke Charitable Foundation Physician Scientist Fellowship grant 2020062 (S.A.P.); the St Jude Children’s Research Hospital Collaborative Research Consortium on Novel Gene Therapies for Sickle Cell Disease; research funding from Pfizer Inc (G.A.B); and a generous gift from the DiGaetano family.
Authorship
Contribution: S.A.P. and G.A.B. designed the experiments, analyzed the data, and wrote the manuscript with input and editing from E.K., P.H., X.L., and C.L.G.; S.A.P., X.L., J.D.G., B.M.G., C.A.K., and O.A. conducted the experiments; and Z.Z., J.S., C.A.K., B.M.G., and R.C.H. provided additional analysis of data.
Conflict-of-interest disclosure: J.D.G., J.S., and G.A.B. are inventors on a patent (Patent Cooperation Treaty patent application PCT/US18/15918) submitted by The Children’s Hospital of Philadelphia that covers the therapeutic targeting of HRI for hemoglobinopathies. G.A.B holds licensing agreements with Pfizer Inc and Vertex Pharmaceuticals and has received research funding from Pfizer Inc and served as a consultant for Fulcrum Therapeutics. The remaining authors declare no competing financial interests.
Correspondence: Scott A. Peslak, Division of Hematology/Oncology, Department of Medicine, Perelman Center for Advanced Medicine, Hospital of the University of Pennsylvania, 3400 Civic Center Blvd, 12th Floor South, Philadelphia, PA 19104; e-mail: scott.peslak@pennmedicine.upenn.edu.

