

Key Points
DPE arises from heterogeneous molecular backgrounds that show GCB- and ABC-dependent patterns.
MYC deregulation with TP53 loss, and BCL6 translocations have taxonomical implications that recognize DPE DLBCLs with differential outcomes.

Abstract
Concomitant deregulation of MYC and BCL2 comprises clinically significant, yet poorly characterized biological high-risk feature in diffuse large B-cell lymphoma (DLBCL). To interrogate these lymphomas, we analyzed translocations and protein expression of BCL2, BCL6, and MYC; correlated the findings with comprehensive mutational, transcriptomic, and clinical data in 181 patients with primary DLBCL; and validated the key findings in independent data sets. Structural variations of BCL2 were subtype-specific and specifically increased BCL2 expression. Molecular dissection of MYC deregulation revealed associations with other lymphoma drivers, including loss of TP53, and distinctive gene expression profiles. Double protein expression (DPE) arose from heterogeneous molecular backgrounds that exhibited subtype-dependent patterns. In the germinal center B-cell (GCB) DLBCL, concurrent alterations of MYC and BCL2 loci gave rise to the majority of DPE DLBCLs, whereas among the activated B-cell (ABC) DLBCLs, concurrent alterations were infrequent. Clinically, DPE DLBCL defined a prognostic entity, which was independent of the International Prognostic Index (IPI) and cell of origin, and together with the loss of TP53 had a synergistic dismal impact on survival. In the DPE DLBCL, the loss of TP53 was associated with a chemorefractory disease, whereas among the other DLBCLs, no correlation with survival was seen. Importantly, BCL6 translocations identified non-GCB lymphomas with favorable BN2/C1-like survival independent of IPI and concurrent DPE status. Taken together, our findings define molecular characteristics of the DPE in DLBCL, and recognize clinically feasible predictors of outcome. Given the emerging taxonomical significance of BCL2, BCL6, MYC, and TP53, our findings provide further depth and validation to the genomic classification of DLBCL.
Introduction
Increased knowledge of genomic aberrations and their interactions in diffuse large B-cell lymphoma (DLBCL) holds promise of improved classification, more accurate risk-stratification, and emergence of targeted therapies with better outcomes.1-3 Transcriptome profiling studies have explicitly classified DLBCL into cell-of-origin (COO)–based molecular subtypes, activated B-cell (ABC), and germinal center B-cell (GCB)–like lymphomas,4 which have different clinical courses and are addicted to different oncogenic pathways.5,6 Recent findings suggest that further taxonomy beyond these gene expression profiles could rely on subtype-defining somatic mutations.2,3
The first genomic aberrations that were recognized in B-cell lymphomas were cytogenetic events concerning MYC,7-9 BCL2,10,11 and BCL612,13 proto-oncogenes. At present, the translational relevance of these translocations is being underlined in the proposed genomic models of DLBCL, where they have subtype dictating roles.2,3 Moreover, tumors with DLBCL morphology and concurrent MYC and BCL2 or BCL6 translocations are assigned to a separate World Health Organization–defined entity named high-grade B-cell lymphomas with MYC and BCL2 and/or BCL6 rearrangements (HGBL-DH/TH).14,15 This distinction is at least clinically justified because HGBL-DT/TH are strongly associated with poor outcomes,16,17 although the prognosis of HGBL-DH/TH may be less dismal than previously reported.18
Beyond molecular classification, DLBCLs with concurrent MYC and BCL2 protein expression (double protein expression [DPE]) are also recognized based on their clinically aggressive course.19,20 Because the concomitant deregulation of MYC and BCL2 can be only partially explained by underlying double hit (DHIT) status, further deregulatory mechanisms are likely to exist. Recently, gene expression profiling studies identified additional DHIT and Burkitt-like GCB DLBCLs with similar clinical behavior as HGBL-DH/TH but no traceable concurrent lesions of MYC and BCL2.21,22 Some of these lymphomas carry cryptic cytogenetic events that are not detected with routine methodology.23 However, DPE DLBCLs can originate from either of the gene expression-based molecular subtypes and have remained a biologically poorly characterized entity in the advent of genomic subtyping with unmet clinical need.
Here, we have comprehensively profiled hallmark DLBCL genes, BCL2, BCL6, and MYC and dissected the molecular high-risk contexts that they represent. By integrating protein expression and translocation data with transcription profiles, copy number aberrations, and somatic driver mutations, we discover previously unknown associations between genomic events, gene expression, clinical characteristics, and treatment outcomes. We uncover a novel interplay between TP53 alterations and MYC deregulation in DLBCL, and recognize a subgroup of ultrahigh-risk DPE DLBCLs with concurrent genomic perturbations of TP53. Furthermore, we recognize BCL6 translocation as a major marker for favorable outcome in patients with non-GCB DLBCLs irrespective of concurrent DPE status. We integrate our discoveries with previous findings and recent advances in DLBCL pathogenesis and provide clinically feasible directives that narrow the gap between emerging genomic taxonomy of DLBCL, well-established prognostic markers and routine diagnostic procedures.
Materials and methods
Patients and samples
Discovery cohort consisted of 181 patients with primary DLBCL treated according to institutional guidelines with rituximab, cyclophosphamide, doxorubicin, vincristine, and prednisone (R-CHOP) or R-CHOP–like immunochemotherapy in Helsinki University Hospital, Finland, from 2002 to 2013.
Patients in this cohort were included in the 1001 DLBCLs study.1 Patient-matched single nucleotide variations, copy number annotations of driver genes, and RNA sequencing-based COO were determined previously, and the data collected from the supplemental Material.
Validation cohorts comprised of datasets with mutation, transcriptome, and clinical data from 5861 and 2283 DLBCL patients. Additional information on the cohorts is provided in the supplemental Material.
The study was approved by the Ethics Committee in Helsinki University Hospital, Finland, the National Authority for Medicolegal Affairs, Finland, and an institutional review board.
Immunohistochemistry and fluorescence in situ hybridization
GCB and non-GCB phenotypes were determined from the whole-tissue sections as part of routine diagnostics according to the Hans algorithm.24 Methodological details for BCL2, BCL6, and MYC immunohistochemistry and BCL2, BCL6, and MYC fluorescence in situ hybridization (FISH) are provided in the supplemental Material. In immunohistochemical (IHC) analysis, the cutoff level for BCL2 positivity was set to ≥50% of the tumor cells being reactive for BCL2 staining (henceforth BCL2+). Qualitative BCL2 overexpression (henceforth BCL2OE) was based on staining intensities beyond physiological levels (supplemental Figure 1A). Nuclear staining of MYC in the tumor cells was assessed and cutoff level for positivity was set to ≥40% (henceforth MYC+). Overexpression of MYC was defined with a cutoff of ≥70% tumor cell nuclei reactive for MYC staining (henceforth MYCOE; supplemental Figure 2B). Results from BCL6 stainings were collected from the pathology reports.
Statistical analysis
Clinical data were analyzed using the IBM SPSS Statistics 24.0 software (IBM, Armonk, NY) or in R environment (>v3.4.3) using R package survival (v2.43-3). Differences in categorical variables were assessed with χ2 test. Mutation frequencies were compared using Fisher’s exact test. Univariate and multivariate analyses were performed according to the Cox proportional hazard regression model. Survival rates were estimated with the Kaplan-Meier method and the differences compared using the log-rank test. A level of probability P < .05 was considered statistically significant. All comparisons were 2-tailed. Further information on data analyses are included in the supplemental Material.
Results
Patient demographics
Patient demographics of the discovery cohort are described in supplemental Table 1. Based on the Hans algorithm and gene expression profiling, 53% and 45% of the patients were classified as GCB DLBCLs, respectively. Primary therapy was mostly R-CHOP and no treatment decisions were guided by molecular factors. During the median follow-up of 46 months, 32 patients had relapsed and 33 died. Five-year progression-free survival and overall survival (OS) rates were 72% and 75%, respectively.
Molecular context and consequences of BCL2, MYC, and BCL6 deregulation in DLBCL
To understand the biological and clinical background and consequences of DPE B-cell lymphomas, we analyzed BCL2, MYC, and BCL6 oncogenes for their structural variations and protein expression and integrated the data with somatic driver mutations, genome-wide transcriptome, and extensive clinical data. The BCL2 locus was targeted by translocations in 24 (16%; BCL2TL), copy number gains in 16 (9%), and amplifications in 20 (11%) tumors. BCL2 copy number gains and high-level amplifications displayed similar clinical and biological features and were analyzed as a whole (BCL2 copy number gain/amplification [BCL2GA], 20% of the patients [n = 36]; supplemental Figure 1B-D). As expected, BCL2TL and BCL2GA correlated with increased BCL2 gene expression and high BCL2 protein levels (Figure 1A). Overall, 82 (55%) tumors were BCL2+ and BCL2OE was observed in 22 (15%) of the tumors (Table 1; supplemental Table 2). A total of 49 (60%) of the BCL2+ cases had an underlying structural variation in the BCL2 locus; in all the cases with BCL2OE, an underlying structural variation was detected (Figure 1B).

Structural variations of BCL2 specifically increase BCL2 expression in a subtype-dependent manner. (A) Box plot demonstrating the association of BCL2 gene expression with structural variations of BCL2 locus. Protein expression demonstrated with dot colors. Representative cases of the cytogenic alterations (FISH) are shown below the plot. (A-D) Break-apart positive cases by FISH with concurrent copy number alterations regraded BCL2TL. (B) Association of BCL2 immunoreactivity with underlying structural variations. (C) Oncoprints of BCL2 alterations demonstrating mutually exclusive nature of BCL2TL and BCL2GA. Coding single-nucleotide variations (SNVs) of BCL2 were cooccurring with BCL2TL (Fisher’s exact, P = 8.5E-5). Interestingly, patients with cooccurring BCL2GA and BCL2 SNVs represented GCB subtype. (D-E) Volcano plots demonstrating the differentially expressed genes between BCL2 altered and other tumors within the RNA sequencing-based molecular subtypes. BCL2 alteration associated genes shown with a positive fold change. (D) BCL2TL within GCB DLBCLs. (E) BCL2GA within ABC DLBCLs. Most of the BCL2GA-associated upregulated genes resided in the vicinity of BCL2 in 18q locus (black dots). ****P < .0001. ns, not significant.
Structural variations of BCL2 specifically increase BCL2 expression in a subtype-dependent manner. (A) Box plot demonstrating the association of BCL2 gene expression with structural variations of BCL2 locus. Protein expression demonstrated with dot colors. Representative cases of the cytogenic alterations (FISH) are shown below the plot. (A-D) Break-apart positive cases by FISH with concurrent copy number alterations regraded BCL2TL. (B) Association of BCL2 immunoreactivity with underlying structural variations. (C) Oncoprints of BCL2 alterations demonstrating mutually exclusive nature of BCL2TL and BCL2GA. Coding single-nucleotide variations (SNVs) of BCL2 were cooccurring with BCL2TL (Fisher’s exact, P = 8.5E-5). Interestingly, patients with cooccurring BCL2GA and BCL2 SNVs represented GCB subtype. (D-E) Volcano plots demonstrating the differentially expressed genes between BCL2 altered and other tumors within the RNA sequencing-based molecular subtypes. BCL2 alteration associated genes shown with a positive fold change. (D) BCL2TL within GCB DLBCLs. (E) BCL2GA within ABC DLBCLs. Most of the BCL2GA-associated upregulated genes resided in the vicinity of BCL2 in 18q locus (black dots). ****P < .0001. ns, not significant.
Patient characteristics according to studied alterations in the study cohort
| Patient characteristics, n (%) | Sex (n = 181) | Age (n = 181) | Stage (n = 180) | IPI (n = 178) | Subtype | ||||||||||||
|---|---|---|---|---|---|---|---|---|---|---|---|---|---|---|---|---|---|
| Hans algorithm (n = 152) | RNA sequencing (n = 161) | ||||||||||||||||
| Male | Female | <60 y | >60 y | I-II | III-IV | Low (0-2) | High (3-5) | GCB | Non-GCB | Other* | GCB | ABC | Unclassified | ||||
| All | 110 (61) | 71 (39) | 80 (44) | 101 (56) | 89 (49) | 91 (51) | 105 (59) | 73 (41) | 81 (45) | 71 (39) | 29 (16) | 72 (45) | 66 (41) | 23 (14) | |||
| BCL2 IHC (n = 150) | Negative | 68 (45) | 41 (60) | 27 (40) | 39 (57) | 29 (43) | 43 (63) | 25 (37) | 46 (68) | 22 (32) | 33 (49) | 25 (37) | 10 (15) | 32 (55) | 16 (28) | 10 (17) | |
| Positive | 82 (55) | 45 (55) | 37 (45) | 31 (38) | 51 (62) | 31 (38) | 50 (62) | 40 (51) | 39 (49) | 37 (45) | 37 (45) | 8 (10) | 33 (43) | 38 (49) | 6 (8) | ||
| P | .513 | .021 | .003 | .044 | .484 | .039 | |||||||||||
| BCL2 translocation (n = 152) | No | 128 (84) | 74 (58) | 54 (42) | 59 (46) | 69 (54) | 68 (54) | 59 (47) | 75 (60) | 50 (40) | 52 (41) | 61 (48) | 15 (12) | 44 (39) | 51 (45) | 18 (16) | |
| Yes | 24 (16) | 12 (50) | 12 (50) | 11 (46) | 13 (54) | 7 (29) | 17 (71) | 12 (50) | 12 (50) | 20 (83) | 2 (8) | 2 (8) | 20 (83) | 3 (13) | 1 (4) | ||
| P | .508 | 1.000 | 0044 | .376 | <.001 | <.001 | |||||||||||
| BCL2 gain/amplification (n = 181) | No | 145 (80) | 83 (57) | 62 (43) | 66 (46) | 79 (55) | 73 (50) | 72 (50) | 87 (60) | 57 (40) | 69 (48) | 53 (37) | 23 (16) | 62 (48) | 45 (35) | 21 (16) | |
| Yes | 36 (20) | 27 (75) | 9 (25) | 14 (39) | 22 (61) | 16 (46) | 19 (54) | 18 (53) | 16 (47) | 12 (33) | 18 (50) | 6 (17) | 10 (30) | 21 (64) | 2 (6) | ||
| P | .058 | .575 | .708 | .444 | .152 | .014 | |||||||||||
| MYC IHC (n = 147) | Negative | 74 (50) | 45 (61) | 29 (39) | 42 (57) | 32 (43) | 38 (51) | 36 (49) | 42 (58) | 31 (42) | 32 (43) | 27 (37) | 15 (20) | 26 (43) | 23 (38) | 12 (20) | |
| Positive | 73 (50) | 40 (55) | 73 (45) | 27 (37) | 46 (63) | 33 (46) | 39 (54) | 41 (58) | 30 (42) | 37 (51) | 33 (45) | 3 (4) | 38 (54) | 29 (41) | 4 (6) | ||
| P | .506 | .021 | .513 | 1.000 | 1.000 | .710 | |||||||||||
| MYC translocation (n = 130) | No | 112 (86) | 66 (59) | 46 (41) | 53 (47) | 59 (53) | 54 (49) | 57 (51) | 63 (57) | 47 (43) | 47 (42) | 49 (44) | 13 (14) | 42 (42) | 42 (42) | 15 (15) | |
| Yes | 18 (14) | 9 (50) | 9 (50) | 10 (56) | 8 (44) | 9 (50) | 9 (50) | 10 (59) | 7 (41) | 15 (83) | 3 (17) | 0 (0) | 12 (67) | 4 (22) | 2 (11) | ||
| P | .608 | .614 | 1.000 | 1.000 | .009 | .100 | |||||||||||
| BCL6 translocation (n = 145) | No | 120 (83) | 73 (61) | 47 (39) | 55 (46) | 65 (54) | 58 (48) | 62 (52) | 69 (58) | 50 (42) | 63 (53) | 44 (37) | 13 (11) | 86 (52) | 38 (35) | 14 (13) | |
| Yes | 25 (17) | 11 (44) | 14 (56) | 13 (52) | 12 (48) | 13 (52) | 12 (48) | 15 (63) | 9 (38) | 8 (32) | 15 (60) | 2 (8) | 7 (32) | 10 (46) | 5 (23) | ||
| P | .181 | .661 | .827 | .821 | .040 | .189 | |||||||||||
| Double expression (n = 147) | No | 99 (67) | 59 (60) | 40 (40) | 54 (55) | 45 (46) | 56 (57) | 43 (43) | 62 (53) | 36 (37) | 49 (50) | 34 (34) | 16 (16) | 44 (52) | 28 (33) | 13 (15) | |
| Yes | 48 (33) | 26 (54) | 22 (46) | 15 (31) | 33 (69) | 15 (32) | 32 (68) | 21 (46) | 25 (54) | 20 (42) | 26 (54) | 2 (4) | 20 (43) | 24 (51) | 3 (6) | ||
| P | .595 | .009 | .008 | .050 | .100 | .125 | |||||||||||
| DA BCL (n = 140) | Negative | 128 (91) | 77 (60) | 51 (40) | 61 (48) | 67 (52) | 64 (50) | 63 (50) | 74 (59) | 52 (41) | 57 (45) | 54 (42) | 17 (13) | 50 (44) | 45 (40) | 18 (16) | |
| Positive | 12 (9) | 6 (50) | 6 (50) | 7 (58) | 5 (42) | 4 (33) | 8 (67) | 5 (46) | 6 (55) | 11 (92) | 1 (8) | 0 (0) | 9 (75) | 1 (8) | 2 (17) | ||
| P | .548 | .555 | .367 | .527 | .008 | .017 | |||||||||||
P calculated with χ2 test. P for subtype comparisons counted for comparison of GCB and non-GCB/ABC.
Other includes tumors with indecisive, not available, or not applicable Hans-algorithm according to tumor histology.
BCL2TL and BCL2GA occurred in a mutually exclusive and subtype-specific fashion (Figure 1C; Table 1). BCL2TL was almost completely specific to the GCB subtype and clinically associated with advanced stage (Table 1). Differential gene expression (DGE) analysis between BCL2TL and the other GCB DLBCLs identified only BCL2 itself (Figure 1D). Similarly, BCL2GA associated with ABC subtype and the BCL2GA overexpressed genes included BCL2 and other, mostly 18q located genes, suggesting their involvement in the BCL2 amplicons (Figure 1E; supplemental Table 3). As expected, the mutational features underlying BCL2 structural variations reflected subtype-specific features (supplemental Figure 1D-E). Taken together, our data suggest that structural variations of BCL2 provide a subtype-specific powerful means to specifically elevate BCL2 expression.
MYC locus was mostly altered by translocations (n = 18; 14% of the cases, MYCTL), which were enriched in the GCB subtype (Hans algorithm; Table 1). MYCTLs were associated with elevated MYC gene and protein expression (Figure 2A). Overall, MYC copy number gains were rare (MYCGA, n = 4), and they did not associate with increased gene expression of MYC or MYCOE (Figure 2A-B). MYC+ was more common in elderly patients (n = 46; 63% of cases; Table 1). Of the patients with MYCOE (n = 16; 11% of cases), 53% harbored MYCTL, whereas the rest of the cases had no detectable structural variation in the MYC locus (Figure 2B). MYCOE DLBCLs with no structural variants of MYC originated mostly from the non-GCB/ABC subtype, suggesting that additional mechanisms or cryptic translocations could deregulate MYC expression in these lymphomas.
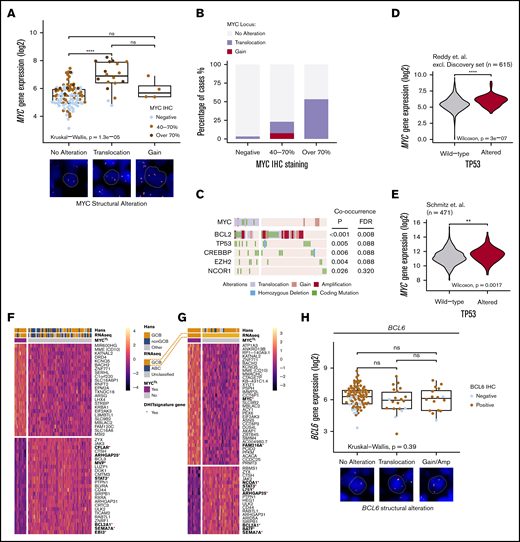
Translocations of MYC recognize a phenotype with distinctive mutational landscape and gene expression profile and structural variations of BCL6 are not associated with gene or protein expression. (A) Box plot of the impact of MYC structural variations with MYC gene and protein expression. Representative cases of the alterations (FISH) shown below the box plot. Concurrent MYCTL and MYCGA regarded as MYCTL in analyzes. (B) Bar plot representing the frequencies of MYC structural variations with MYC immunoreactivity. (C) Oncoprint of concurrent genomic alterations with MYCTL. Fisher’s exact, P < .05. Multiple testing corrected for genes mutated in >5 patients of the study cohort with complete cytogenetic data. MYC SNVs were only detected in MYCTL DLBCLs. (D-E) Violin plots demonstrating different MYC gene expression levels between TP53 wild-type and TP53-altered DLBCLs in independent datasets. (D) Reddy et al cohort excluding discovery cohort. (E) Schmitz et al cohort. (F-G) Heatmaps of the differentially expressed genes according to MYCTL within the whole cohort (F) and within the GCB DLBCLs (G). Red asterisk and bold denotes genes reported important for the DHIT signature by Ennishi et al. Genes with FDR <10% and fold-change (log2 transformed) >0.25 included in the heatmaps. (H) Box plot demonstrating the similar levels of gene expression between different structural alterations of BCL6. Representative cases of BCL6 SVs detected with FISH below the plot. Dot colors indicate IHC staining positivity. Concurrent BCL6TL and BCL6GA regarded as BCL6TL. **P < .01; ****P < .0001.
Translocations of MYC recognize a phenotype with distinctive mutational landscape and gene expression profile and structural variations of BCL6 are not associated with gene or protein expression. (A) Box plot of the impact of MYC structural variations with MYC gene and protein expression. Representative cases of the alterations (FISH) shown below the box plot. Concurrent MYCTL and MYCGA regarded as MYCTL in analyzes. (B) Bar plot representing the frequencies of MYC structural variations with MYC immunoreactivity. (C) Oncoprint of concurrent genomic alterations with MYCTL. Fisher’s exact, P < .05. Multiple testing corrected for genes mutated in >5 patients of the study cohort with complete cytogenetic data. MYC SNVs were only detected in MYCTL DLBCLs. (D-E) Violin plots demonstrating different MYC gene expression levels between TP53 wild-type and TP53-altered DLBCLs in independent datasets. (D) Reddy et al cohort excluding discovery cohort. (E) Schmitz et al cohort. (F-G) Heatmaps of the differentially expressed genes according to MYCTL within the whole cohort (F) and within the GCB DLBCLs (G). Red asterisk and bold denotes genes reported important for the DHIT signature by Ennishi et al. Genes with FDR <10% and fold-change (log2 transformed) >0.25 included in the heatmaps. (H) Box plot demonstrating the similar levels of gene expression between different structural alterations of BCL6. Representative cases of BCL6 SVs detected with FISH below the plot. Dot colors indicate IHC staining positivity. Concurrent BCL6TL and BCL6GA regarded as BCL6TL. **P < .01; ****P < .0001.
We recognized that MYCTL cooccurred with structural variations of the BCL2 locus (Figure 2C; 71% of the MYCTL lymphomas, double alteration B-cell lymphomas [DA BCL], see the following section). Besides BCL2 SVs, we recognized cooccurrence between MYCTL and somatic mutations of TP53, CREBBP, and EZH2 (Figure 2C; false discovery rate [FDR] < 10%). On the protein level, we observed that MYCOE cooccurred with TP53 alterations (supplemental Figure 2B). As further evidence for concurrent loss of TP53 and MYC deregulation, we observed that in the rest of the 1001 DLBCLs cohort and in a separate dataset, TP53-altered DLBCLs were associated with elevated gene expression levels of MYC (Figure 2D-E). Together, these data suggest that there is an intricate association between the somatic loss of TP53 and MYC deregulation in DLBCL.
In the DGE analysis, we identified 39 differentially expressed genes between MYCTL and the rest of the DLBCLs (Figure 2F; supplemental Table 4). MYCTL-associated genes contained CD10 (MME), supporting the enrichment of MYCTL in the GCB phenotype (Table 1). Interestingly, this association was also evident in the DGE analysis of MYCTL among the GCB DLBCLs, suggesting additional enrichment of MYCTL among CD10+ GCB DLBCLs (Figure 2G; supplemental Table 5). Meanwhile, MYCTL DLBCLs showed decreased expression of JAK-STAT signaling genes (JAK3, STAT3) and several other genes including EBI3, SEMA7A, BCL2A1, and CFLAR, which were recognized to be downregulated in the double-hit signature described by Ennishi et al.22
On the protein level, the gene expression profile associated with MYCOE was strongly enriched for biosynthesis and metabolic pathways including nucleotide, amino acid, and ribosome biogenesis, transcription, translation, and telomerase activity (supplemental Figure 2C; supplemental Tables 6 and 7). In fact, the expression of telomerase reverse transcriptase was the most strongly MYCOE-associated gene recognized25 (supplemental Figure 2C). Genes associated with inflammatory pathways, including cytokine, JAK-STAT, and T-cell receptor signaling pathways were suppressed in MYCOE DLBCLs, suggesting depletion of tumor-infiltrating immune cells in MYCOE lymphomas (supplemental Table 8).
Last, we analyzed BCL6 alterations. Most of the DLBCLs in the cohort were BCL6+ (n = 136/156; 87%), and BCL6 gene expression correlated positively with immunoreactivity (supplemental Figure 2D). BCL6 translocations (n = 25/145; 17% of the whole cohort, BCL6TL) and BCL6 copy number gains (n = 23/181; 13%) were not associated with increased BCL6 gene or protein expression (Figure 2H; supplemental Figure 2E). BCL6TL was enriched in the non-GCB DLBCLs (Table 1), and among them not associated with a distinctive gene expression signature. Structural variations and nonsynonymous mutations of BCL6 occurred in a mutually exclusive manner (supplemental Figure 2F).
DPE arises from heterogeneous molecular backgrounds that reflect COO-related features
Forty-eight (33%) of the DLBCLs in our cohort were DPEs (BCL2 ≥50% and MYC ≥40%). DPE was associated with a clinically high-risk disease (Table 1; high International Prognostic Index [IPI], advanced stage, and older age). DPE lymphomas were derived from either of the molecular subtypes with a slight overrepresentation of ABC/non-GCB DLBCLs (Table 1). Structural aberrations of BCL2 and MYC were detected in 29 (60%) and 15 (32%) of the DPE lymphomas, respectively (Figure 3A). Apart from these alterations, the genomic drivers underlying DPE lymphomas reflected the established features of the molecular subtypes, and did not strikingly differ from the non-DPE lymphomas (Figure 3A; supplemental Figure 3).
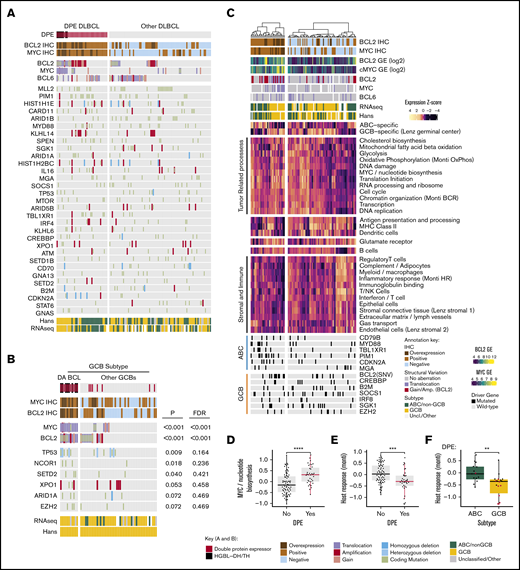
Molecular background of DPE in DLBCL. (A) Oncoprint of the most common driver gene alterations in the discovery cohort stratified according to DPE status. Drivers with mutations observed in ≥10% of the cases included. Patients with complete genomic data and BCL2 and MYC immunohistochemical data included. (B) Genetic drivers differentially mutated (Fisher’s exact, P < .1) between DA and non-DA GCB BCLs. Driver mutations observed in ≥3% of the cases in the GCB subtype according to the Hans algorithm with complete cytogenetic and immunohistochemical data of BCL2 and MYC included for the analysis. (C) Hierarchical clustering of the gene set exemplars according to double protein expression status. The exemplars and their expressions were recognized with affinity propagation clustering in Reddy et al. (D) Box plot demonstrating the difference in expression of “MYC/nucleotide biosynthesis” gene set between DPE and non-DPE DLBCLs. (E) Box plot demonstrating the difference in expression of host response-related gene set between DPE and non-DPE DLBCLs. (F) Box plot demonstrating the difference in expression of host response-related gene set between ABC and GCB DLBCLs among DPE DLBCL. Red dots indicate concurrent structural variants of BCL2 and MYC (DA BCLs). **P < .01; ***P < .001; ****P < .0001.
Molecular background of DPE in DLBCL. (A) Oncoprint of the most common driver gene alterations in the discovery cohort stratified according to DPE status. Drivers with mutations observed in ≥10% of the cases included. Patients with complete genomic data and BCL2 and MYC immunohistochemical data included. (B) Genetic drivers differentially mutated (Fisher’s exact, P < .1) between DA and non-DA GCB BCLs. Driver mutations observed in ≥3% of the cases in the GCB subtype according to the Hans algorithm with complete cytogenetic and immunohistochemical data of BCL2 and MYC included for the analysis. (C) Hierarchical clustering of the gene set exemplars according to double protein expression status. The exemplars and their expressions were recognized with affinity propagation clustering in Reddy et al. (D) Box plot demonstrating the difference in expression of “MYC/nucleotide biosynthesis” gene set between DPE and non-DPE DLBCLs. (E) Box plot demonstrating the difference in expression of host response-related gene set between DPE and non-DPE DLBCLs. (F) Box plot demonstrating the difference in expression of host response-related gene set between ABC and GCB DLBCLs among DPE DLBCL. Red dots indicate concurrent structural variants of BCL2 and MYC (DA BCLs). **P < .01; ***P < .001; ****P < .0001.
The DLBCL-like HGBL-DH/TH was detected in 8 (6%) cases from the whole cohort and represented 18% of the DPE lymphoma patients. All the HGBL-DH/TH lymphomas were GCB subtype according to the Hans algorithm, carried BCL2TL, and were DPE (2 triple-hit lymphomas; Figure 3B; supplemental Table 2). Interestingly, we identified that beyond these canonical DHIT lymphomas, additional cases of the DPE GCB DLBCLs had a combination of MYCTL and BCL2GA. Together with DHIT, these DA BCLs constituted 58% of the DPE GCBs (Table 1; Figure 3B). Besides MYC and BCL2 alterations, TP53 alterations were associated with DA BCL (Figure 3B).
Among the non-GCB DPE lymphomas, the prevalence of DPE was similar between BCL6TL and non-BCL6TL non-GCB lymphomas (40% and 43%, respectively), suggesting that non-GCB DPE can arise from both BN2- or MCD-like ABC backgrounds. In comparison with GCB DLBCLs, concurrent alterations of BCL2 and MYC were uncommon (1/26 of the non-GCB DLBCLs). Taken together, concurrent structural variations of BCL2 and MYC are the major drivers of DPE among the GCB subtype, whereas the DPE ABC DLBCLs may arise from cryptic alterations or epigenetically dysregulated loci.
To recognize transcriptome perturbations characteristic for DPE DLBCL, we analyzed the expression levels of gene set exemplars reflecting lymphoma-related biological processes (Figure 3C). As expected, DPE DLBCLs were associated with expression of gene sets associated with MYC protein expression, including pathways related to biosynthesis, metabolism, and cell cycle (Figure 3C-D). Furthermore, DPE DLBCLs and especially GCB DA BCLs, were associated with lower expression of genes associated with different tumor-infiltrating immune cells and host response (Figure 3E-F). Together, our findings suggest that the heterogeneity of DPE DLBCL reflects ABC- and GCB-related differences in genome, transcriptome, and tumor microenvironmental levels.
Clinical behavior of MYC and BCL2 deregulation is dependent on the molecular context
To get an overview of the clinical attributes of the studied molecular characteristics, we performed univariate Cox regression analyses to determine their associations with the risk of death within the whole cohort (Figure 4A). As previously established, high IPI scores, Hans algorithm-based non-GCB, and gene expression-based ABC subtypes associated with poor OS (Figure 4A). In the whole study cohort, both BCL2 and MYC protein expression was associated with poor survival, and overexpression of these proteins associated with even less favorable survival (Figure 4A). As expected, DPE DLBCL was a powerful predictor for poor outcome in the entire cohort (Figure 4B). This association was also independent of IPI and COO in the multivariate analysis (Figure 4B, models 1 and 2).
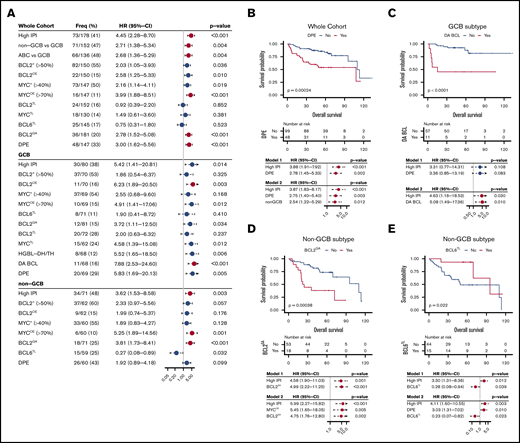
Survival analysis of DLBCL according to the studied markers. (A) Forest plots of univariate Cox regression analyze showing hazard ratios with 95% confidence intervals for overall survival according to studied alterations in the whole study cohort and separately among the immunohistochemically defined GCB and non-GCB DLBCLs. For RNAseq-based analyses, see supplemental Figure 4A-B. Red dots indicate FDR <10% for all P values listed in panel A. (B-E) Kaplan-Meier estimates of highlighted survival associations and respective multivariate models. (B) Double protein expression among the whole cohort. (C) Double alterations among the GCB DLBCLs. BCL2GA (D) and BCL6TL (E) among the non-GCB DLBCLs.
Survival analysis of DLBCL according to the studied markers. (A) Forest plots of univariate Cox regression analyze showing hazard ratios with 95% confidence intervals for overall survival according to studied alterations in the whole study cohort and separately among the immunohistochemically defined GCB and non-GCB DLBCLs. For RNAseq-based analyses, see supplemental Figure 4A-B. Red dots indicate FDR <10% for all P values listed in panel A. (B-E) Kaplan-Meier estimates of highlighted survival associations and respective multivariate models. (B) Double protein expression among the whole cohort. (C) Double alterations among the GCB DLBCLs. BCL2GA (D) and BCL6TL (E) among the non-GCB DLBCLs.
To recognize subtype-dependent outcome predictors, we performed survival analyses stratified according to immunohistochemically defined subtypes (Figure 4A; for RNAseq-defined subtypes, see supplemental Figure 4A-B). In the GCB DLBCLs, MYCTL translated to poor outcome (Figure 4A). At the protein level, BCL2+ or MYC+ did not associate with survival, whereas BCL2OE and MYCOE translated to adverse outcome (Figure 4A). As expected, concurrent deregulation of MYC and BCL2, DPE, HGBL-DH/TH, and DA BCL predicted poor outcome (Figure 4A). Importantly, DA BCL could recognize additional GCB patients with refractory course that did not meet HGBL-DH/TH criteria (Figure 4A,C). Of note, all patients with no response to therapy (progressive or stable disease) in the discovery cohort were DA BCLs, and all events recorded in these patients occurred during the first 24 months of follow-up.18 Similar effect was seen in independent validation set (supplemental Figure 4C). In multivariate analysis with IPI, DPE status did not remain independent prognostic factor for survival in the GCB DLBCLs (Figure 4C, model 1), whereas DA BCL had prognostic value independent of IPI (Figure 4C, model 2).
In the non-GCB DLBCLs, BCL2GA had a prominent adverse impact on survival independent of IPI (Figure 4D, model 1). Interestingly, expression of BCL2 (BCL2+ or BCL2OE) did not recapitulate this effect on survival (Figure 4A). When BCL2GA was analyzed among the ABC subtype defined according to the gene expression profile, a trend toward poor survival was seen (supplemental Figure 4B). Meanwhile, MYCOE was identified as a strong predictor of outcome in the patients with non-GCB DLBCL (Figure 4A). When MYCOE was included in the multivariate analysis with IPI and BCL2GA, all markers remained independent predictors of poor survival (Figure 4D, model 2). In addition, DPE status was found to result in a trend toward poor survival among the non-GCB DLBCLs (Figure 4A).
BCL6TL was found to associate with excellent survival in the patients with non-GCB and ABC DLBCL (Figure 4A,E; supplemental Figure 4B). The association was independent of IPI and could be validated in an independent cohort (Figure 4E, model 1; supplemental Figure 4D). The outcomes of the BCL6TL non-GCB/ABC DLBCLs were comparable with the non-HGBL-DH/TH GCB DLBCLs (5-year OS; 93% vs 85%, respectively). Interestingly, among the non-GCB DLBCLs with no BCL6TL, DPE translated to poor survival (supplemental Figure 4E). Conversely, BCL6TL associated with good outcome among the non-GCB DPE lymphomas (supplemental Figure 4F-G). Together, the findings suggest that BCL6TL associates with favorable outcome irrespective of DPE status among the non-GCB/ABC DLBCLs. In multivariate analysis, IPI, DPE, and BCL6TL remained independent prognostic factors for survival among the non-GCB DLBCLs (Figure 4E, model 2).
Finally, because we recognized that DPE status was associated with poor survival independent of COO and IPI scores in the whole cohort, we extended our stratified approach to DPE DLBCLs (Figure 5A). When the impact of IPI or molecular subgroups on outcome was assessed in the patients with DPE DLBCLs, no significant differences in survival were found (Figure 5A). Neither did we did observe differences in survival between the HGBL-DH/TH or DA lymphomas and other DPE DLBCLs (Figure 5A). However, MYCOE was associated with poor survival in the DPE DLBCLs (Figure 5A). Given the cooccurrence of TP53 alterations and MYC deregulation in our cohort, we then examined the effect of TP53 alterations on the outcome in DPE DLBCL (10/48 patients). The association of TP53 alterations with poor outcome was restricted solely to the DPE phenotype and was not seen in the patients with non-DPE DLBCL or in the whole cohort (Figure 5B-C; supplemental Figure 5A). In the DPE DLBCL, point mutations and copy number losses of TP53 showed similar clinical behavior, suggesting that loss of TP53 in the context of DPE identifies a subset of ultrahigh-risk lymphomas with treatment refractory clinical course (supplemental Figure 5B). In separate validation cohorts of 5861 and 2283 patients with double expression defined according to gene expression, a similar synergistic effect on survival was seen (Figure 5D-E).
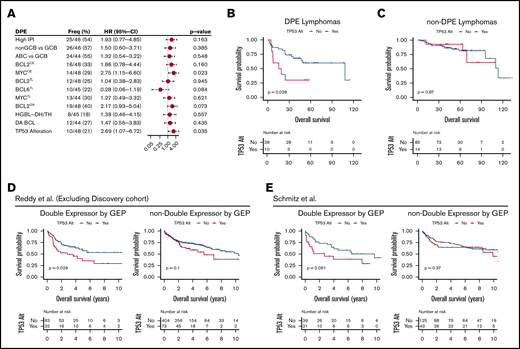
TP53 alterations recognize poor outcome and chemorefractoriness among DPE DLBCL. (A) Forest plots of univariate Cox regression analyses showing hazard ratios with 95% confidence intervals for OS according to studied markers among the DPE lymphomas. (B-C) Kaplan-Meier curves for OS according to TP53 alterations within DPE lymphoma (B) and other DLBCLs (C). (D-E) Kaplan-Meier survival curves for OS according to TP53 alterations stratified with double expression of MYC and BCL2 in the separate validation cohorts. (D) Reddy et al cohort excluding the discovery cohort. High MYC and BCL2 expression status was extracted from the original publication. (E) Schmitz et al cohort. Higher than median gene expression of both BCL2 and MYC was used as a cutoff to approximate double expression.
TP53 alterations recognize poor outcome and chemorefractoriness among DPE DLBCL. (A) Forest plots of univariate Cox regression analyses showing hazard ratios with 95% confidence intervals for OS according to studied markers among the DPE lymphomas. (B-C) Kaplan-Meier curves for OS according to TP53 alterations within DPE lymphoma (B) and other DLBCLs (C). (D-E) Kaplan-Meier survival curves for OS according to TP53 alterations stratified with double expression of MYC and BCL2 in the separate validation cohorts. (D) Reddy et al cohort excluding the discovery cohort. High MYC and BCL2 expression status was extracted from the original publication. (E) Schmitz et al cohort. Higher than median gene expression of both BCL2 and MYC was used as a cutoff to approximate double expression.
Discussion
Recently identified genetic signatures beyond the COO-based lymphoma classification have not only provided new insights to the pathogenesis of DLBCL but also established a platform for clinical interventions. Meantime, however, the biological background of a clinically relevant prognostic entity, DPE B-cell lymphoma, has remained poorly described. Here, we have comprehensively characterized BCL2, BCL6, and MYC oncogenes and dissected the molecular and clinical background of well-recognized HGBL-DH/TH and DPE entities that they establish. Our results elucidate the molecular underpinnings of high-risk lymphoma and provide additional evidence for many recent findings. Furthermore, our approach elucidates interactions between different prognostic factors and identifies relevant biomarkers.
Deregulation of BCL2 expression is attributed to the subtype-specific structural variations of the BCL2 locus, which underlie BCL2 overexpression and often DPE. We highlight BCL2GA for its clinical and translational relevance. First, BCL2GA was associated with dismal survival within the non-GCB subtype,26,27 which was not recapitulated by BCL2 immunohistochemistry among the mostly BCL2+ non-GCB lymphomas. Second, the genomic background of BCL2GA ABC DLBCLs displayed similarities with the C5-cluster characteristics identified by Chapuy et al,2 further suggesting that BCL2GA is a feasible marker for bona fide ABC and C5-like DLBCLs among the heterogenous non-GCB entity. Third, among the GCB subtype, additional HGBL-DH/TH-like treatment-refractory lymphomas with poor outcomes can be identified when “functional DHIT” of BCL2GA and MYCTL is considered.28 Together, our results justify copy number analysis and guide interpretation of BCL2 amplifications in clinical practice to aid risk stratification and molecular phenotyping upon diagnosis.
Interestingly, we did not identify any association between BCL6TL and elevated gene expression or BCL6 immunoreactivity. Yet, of clinical relevance, BCL6TL recognized one-quarter of non-GCB DLBCLs with excellent survival, although 40% of these lymphomas were also DPEs. Our results support rationale for profiling BCL6 translocations in non-GCB DLBCLs to recognize lymphomas with a favorable BN23 and C12 -like clinical behavior. So far, the interpretation has been that these non-GCB DLBCLs resemble marginal zone B-cell lymphomas genetically, and are likely to have COO within the non-GCB/ABC lymphomas different from their MCD/C5-like counterparts. Importantly, our results clarify that the favorable outcome of these lymphomas is irrespective of DPE and BCL2 positivity.
MYC translocation partners are diverse, and a significant proportion of noncanonical MYCTL are missed even with routine widespread break-apart FISH-based approaches.29 Recent seminal works have applied nonconventional next-generation sequencing-based techniques to detect translocation events that are not likely to recapitulate the diversity of MYCTLs, which were reported at lower frequencies than expected (8%2 and not reported3 vs 14% of the cases observed here). Indeed, both groups proposed highly concordant but MYC agnostic genomic classification models. Chapuy et al reported a genetic subgroup (C2) characterized by loss of TP53 that was associated with a dismal clinical course30,31 and aneuploidy genotype suggesting chromosomal instability.32 Although supported by recent findings by Wright et al,33 the role of TP53-driven subtype remains under debate.34 We found that TP53 mutations cooccur with MYCTL and further recognized a global association between MYC deregulation and loss of TP53. The translational significance of this interplay is evident in the context of DPE, where the loss of TP53 recognizes mainly refractory ultrahigh-risk DPE DLBCLs. Because DPE DLBCLs can arise from either of the molecular subtypes, our results do not disagree with the previous results showing association of TP53 mutations with survival in both GCB and ABC DLBCLs.31 Given the limited sample size, we were unable show the survival association of TP53 mutations when stratified according to molecular subtypes and DPE. Recent expression profiling studies recognized highly concordant high-grade GCB lymphomas that contained MYC and BCL2 double-hit lymphomas with additional cases with no detectable DHIT.21,22 We discovered a highly similar gene expression signature to be restricted solely to the MYCTL lymphomas. Apart from loss of TP53, these MYCTL lymphomas were also enriched for BCL2, CREBBP, and EZH2 mutations. Together, the data suggest that MYCTLs likely underlie a distinctive high-grade GCB lymphoma subtype that is at least partially overlapping with EZB3 /C32 and C22 /A5333 DLBCLs. Given the lack of lymphomas with MYC/BCL6 DHIT in our cohort, their molecular features remain to be established.
The referred-to pivotal studies were not designed to pursue the comprehensive characterization of the molecular background of DPE lymphoma. According to our findings, DPE lymphoma arises from heterogenous molecular and genomic backgrounds. In GCB DLBCL, the majority of the DPE lymphomas carry concomitant structural lesions of BCL2 and MYC (DA BCL), whereas in ABC/non-GCB DLBCLs, concurrent lesions are virtually absent, and DPE can arise from both BN2-/C1-like or MCD-/C5-like backgrounds. We speculate that in ABC/non-GCB DLBCL, deregulation on epigenetic, transcriptional, or posttranslational levels affect aberrant MYC protein expression. In DPE DLBCLs, transcriptomic features reflect MYC protein expression-related pathways and a less abundant immune cell infiltration that is especially characteristic for GCB DA BCLs.
Clinical characteristics of DPE DLBCL patients have also remained poorly characterized. Our findings associate DPE with a clinically high-risk disease at diagnosis. Importantly, despite the underlying potentially confounding associations with risk factors, DPE status has independent prognostic effect on survival. Although DPE and HGBL-DH/TH patients have been suggested to benefit from more intensive treatment regimens, such an effect has neither been studied nor demonstrated in post hoc analysis of the phase 3 Cancer and Leukemia Group B 50303 trial,35 where DPE lymphoma patients were heavily underrepresented (16% of the Cancer and Leukemia Group B cohort vs 33% observed here, with the same cutoff). Furthermore, given the recognized positive correlation between DPE and age in our study, implementing more aggressive therapeutic approaches for these patients has limitations. Further clinical studies are needed on phosphatidylinositol 3-kinase or BCL2 inhibition for DPE and other BCL2-deregulated lymphomas.36 Other novel approaches including antibody–drug conjugates37 or immunotherapies with T-cell engaging bispecific antibodies38 and chimeric antigen receptor T cells39,40 could provide much-needed new therapies for these patients.
Taken together, we have comprehensively characterized and clarified the clinical and molecular framework for DPE lymphomas. According to our findings, the heterogenous pathogenesis of the DPE reflects COO features, and the unfavorable impact on survival is dependent on the molecular context of the lymphoma. We highlight TP53 alterations as major prognostic markers for poor outcome among DPE entity, whereas BN2/C1-like DLBCLs with BCL6TLs have favorable outcomes regardless of DPE. Our results provide rationale and update interpretation guidelines for FISH- and IHC-based profiling of primary DLBCL upon diagnosis. The data are of translational importance and narrow the gap between recent genome-wide findings2,3 and clinically relevant diagnostic and risk-evaluation measures.
Requests for data sharing should be e-mailed to the corresponding author, Sirpa Leppä (sirpa.leppa@helsinki.fi).
Acknowledgments
The authors acknowledge Anne Aarnio and Marika Tuukkanen for technical assistance, Sandeep Dave and Anupama Reddy for proving gene expression data, and CSC-IT for computational resources.
The study was supported by grants from Finnish Cancer Foundation (S.L.), Academy of Finland, Jusélius Foundation (S.L.), University of Helsinki (S.L.), and Helsinki University Hospital (S.L.). This study has partially used data produced by the Genomic Variation in DLBCL study, which was supported by the Intramural Research Program of the National Institutes of Health, National Cancer Institute, Department of Health and Human Services. The datasets have been accessed through the National Institutes of Health database for Genotypes and Phenotypes with accession number phs001444/DAR 74811.
Authorship
Contribution: L.M. and S.L. conceived the study and wrote the manuscript; A.P., L.M., and S.L. collected clinical data; L.M. and A.A. analyzed the data; L.M. and A.P. analyzed the fluorescent in situ hybridizations; A.A. analyzed the validation datasets; J.H. provided statistical guidance; M.-L.K.-L. collected samples, supervised the FISH detection, and scored the immunohistochemical stainings of BCL2 and MYC; S.L. supervised the study; and all authors read and approved the manuscript.
Conflict-of-interest disclosure: S.L. reports consultancy and research funding (not related to this study) from Janssen-Cilag; consultancy, honoraria, and research funding (not related to this study) from Roche; consultancy, honoraria, and research funding (not related to this study) from Takeda; consultancy and honoraria from Novartis; research funding (not related to this study) from Bayer; consultancy and research funding (not related to this study) from Celgene; and consultancy from Gilead. The remaining authors declare no competing financial interests.
Correspondence: Sirpa Leppä, Department of Oncology, Helsinki University Central Hospital Cancer Center, P.O. Box 180, FI-00029 Helsinki, Finland; e-mail: sirpa.leppa@helsinki.fi.

