

Key Points
Tight-binding inhibition underlies warfarin dosage variations.
Vitamin K antidote competes off warfarin tightly bound to VKORC1, whose rescued activity contributes to the reversal of anticoagulation.

Abstract
Dose control of warfarin is a major complication in anticoagulation therapy and overdose is reversed by the vitamin K antidote. Improving the dosage management and antidotal efficacy requires mechanistic understanding. Here we find that effects of the major predictor of warfarin dosage, SNP −1639 G>A, follow a general correlation that warfarin 50% inhibitory concentration decreases with cellular level of vitamin K epoxide reductase (VKORC1), suggesting stoichiometric inhibition. Characterization of the inhibition kinetics required the use of microsomal VKORC1 with a native reductant, glutathione, that enables effective warfarin inhibition in vitro. The kinetics data can be fitted with the Morrison equation, giving a nanomolar inhibition constant and demonstrating that warfarin is a tight-binding inhibitor. However, warfarin is released from purified VKORC1-warfarin complex with increasing amount of vitamin K, indicating competitive inhibition. The competition occurs also in cells, resulting in rescued VKORC1 activity that augments the antidotal effects of vitamin K. Taken together, warfarin is a competitive inhibitor that binds VKORC1 tightly and inhibits at a stoichiometric (1:1) concentration, whereas exceeding the VKORC1 level results in warfarin overdose. Thus, warfarin dosage control should use VKORC1 level as a major indicator, and improved antidotes may be designed based on their competition with warfarin.
Introduction
Warfarin is an oral anticoagulant widely used to treat and prevent thromboembolic diseases.1 Because warfarin has a narrow therapeutic index, effective dosing of this drug requires frequent anticoagulation monitoring and dose adjustments. Underdosing warfarin increases the risk of thrombosis in patients, whereas overdosing often leads to major, even fatal bleeding. As the antidote for the overdose, vitamin K is generally given to restore the coagulation. The management of warfarin dosage is further complicated by its wide interindividual variation.2,3 The most important predictor of warfarin dosage is the genotype of vitamin K epoxide reductase (VKORC1),4-9 whose promoter region contains a single nucleotide polymorphism (SNP) −1639 G>A that accounts for ∼25% of the interpatient variability.6,7,10 This SNP lowers the messenger RNA (mRNA) and protein levels of VKORC1, and patients carrying this SNP require lower warfarin dosage.8
As the target of warfarin, VKORC1 supports blood coagulation through the vitamin K cycle. This cycle occurs in the endoplasmic reticulum (ER) and begins with the γ-carboxylation of selected coagulation factors, a posttranslational modification required for their activity. The carboxylase activity is driven by the epoxidation of vitamin K hydroquinone (KH2). To regenerate the hydroquinone, VKORC1 reduces the vitamin K epoxide (KO) first to vitamin K quinone (K) and then to KH2. These reductase activities are maintained by reducing molecules in the ER. The warfarin inhibition of these activities hinders the production of functional coagulation factors, thereby decreasing blood clotting.
VKORC1 activity was traditionally analyzed in vitro, using dithiothreitol (DTT) to mimic the reducing equivalent in cells. In the presence of DTT, however, the 50% inhibitory concentration (IC50) of warfarin is at millimolar concentration,11,12 which is much higher than the nanomolar therapeutic range of warfarin.13-17 This large discrepancy is probably because DTT reduces VKORC1 almost completely, whereas warfarin preferably inhibits oxidized VKORC1.18,19 Indeed, this membrane oxidoreductase is primarily oxidized in cells, with ∼40% of it in the fully oxidized state and 50% in partially oxidized state.18 The oxidized status of VKORC1 is maintained in the ER, which contains a redox buffer comprising a high concentration (∼15 mM) of reduced glutathione (GSH) and oxidized glutathione (GSSG).20-22 Because the DTT-driven assays in vitro are conducted under nonphysiological conditions, cellular assays were later developed to measure the VKORC1 activity that promotes carboxylation of introduced coagulation factors.13,16,17,23 The IC50 of warfarin in cells is found to be in the nanomolar range, consistent with its therapeutic range. Thus, the cellular systems provide a valid model to study the warfarin dosage.
Here, we reproduce the effects of SNP −1639 G>A by using the cellular carboxylation assay.17 The assay allows us to identify a general correlation that warfarin IC50 increases with VKORC1 level. We found a similar correlation for VKORC1 in microsomes and as purified protein, which become warfarin sensitive with the use of GSH, the major reductant in the ER. Warfarin inhibition follows tight-binding kinetics and is competitive with vitamin K, a profound mechanism that underlies warfarin dosing and antidoting.
Methods
Cloning and transfection
To implement SNP −1639 G>A for the cellular assay, the promoter sequence of VKORC1 (c.-1800 to c.-0) was polymerase chain reaction (PCR)-amplified from the genomic DNA prepared from Huh7 cells. The PCR fragment was cloned into a pBudCE4.1 vector and placed before the VKORC1 complementary DNA (cDNA). The coding sequence includes a C-term Flag tag and an ER retention signal.13,18 The G>A change in the promoter region was introduced by site-directed mutagenesis by using Quikchange. The constructs were transfected into a HEK293 cell line that has endogenous VKORC1 and VKORC1L1 genes knocked out (DKO) and has an introduced chimeric FIXgla-Protein C (FIXgla-PC) gene as the γ-carboxylation reporter.13,18 The FIXgla-PC DKO cells on 24-well plates were transfected with 0.6 μg DNA and grown for 48 hours. Subsequently, the cell media containing the secreted FIXgla-PC was used for the carboxylation assay.
To change VKORC1 levels systematically, variable amounts (0-1.5 μg) of the pBudCE4.1 vector containing PCMV6-controlled VKORC1 and an empty vector (to make 1.5 μg total DNA) were cotransfected by using lipofectamine 3000 into the FIXgla-PC DKO cells on 24-well plates.
Cellular assay of warfarin IC50
The cellular carboxylation assay was performed as previously described.13,18 To measure the IC50 levels of warfarin, the cells expressing different amounts of VKORC1 were treated with warfarin at 11 different concentrations. This concentration range was optimized according to the warfarin response at different VKORC1 expression levels. IC50 levels were analyzed by using GraphPad Prism.
Quantification of mRNA and protein levels
The mRNA from transfected cells was extracted using TRIZOL. Reverse transcriptase-PCR of the VKORC1 mRNA was performed on a Strategene Mx3005P system using a SYBR green RNA-to-CT kit (Thermo). Glyceraldehyde-3-phosphate dehydrogenase was used as an internal control.
For in-cell enzyme-linked immunosorbent assay (ELISA), cells were fixed with methanol for 2 hours at −20°C and permeabilized in Tris-buffered saline buffer containing 20 mM Tris pH 7.5, 150 mM NaCl, and 0.1% Tween 20. ELISA was carried out using mouse anti-flag M2 (Sigma F3165) and horseradish peroxidase-conjugated goat-anti-mouse (Sigma A4416) antibodies.
For quantitative western blot, mouse anti-flag M2 and anti-VKORC1 antibodies (Thermo PA560093) were used. The band intensities were quantified by Image J.
VKORC1 expression
VKORC1 with a fused split green fluorescent protein was cloned into a modified pPICZ-B expression vector and selected by expression level.24 The cells were grown in buffered minimal glycerol media at 30°C for 20 hours, and protein expression was induced by 0.7% methanol for 48 hours at 25°C.
Preparation of ER-enriched microsomes
Frozen Pichia cells were broken with a ball mill (Retsch) followed by sonication. After removal of cell debris, the supernatant was centrifuged at 138 000g for 1 hour to collect crude microsomes. Purification of microsomes followed a reported protocol,12 with a modification that 35% and 60% sucrose (w/v) were used for step gradient. The enriched ER membranes were resuspended in 150 mM KCl and 50 mM N-2-hydroxyethylpiperazine-N′-2-ethanesulfonic acid pH 7.5. Concentration of total proteins was determined by using a bicinchoninic acid assay.
Warfarin inhibition of microsomal VKORC1
Microsomes at different concentrations were preincubated with 11 concentrations of warfarin for 30 minutes on ice. VKORC1 catalysis was initiated in 500 µL buffer containing 40 mM GSH, 5 µM KO, 150 mM KCl, and 200 mM N-2-hydroxyethylpiperazine-N′-2-ethanesulfonic acid pH 7.5. The reaction was carried out at 30°C for 2 hours and analyzed by high-performance liquid chromatography.25 The KO to K conversion was confirmed by liquid chromatography–mass spectrometry (LC-MS) and extracted-ion chromatogram (supplemental Figure 1). To compare the effect of different reductants, GSH was substituted by a mixture of 60 mM GSH and 20 mM GSSG or by 6.25 mM DTT.
Purification of VKORC1-warfarin complex
Broken Pichia cells were resuspended in a buffer containing 150 mM NaCl, 25 mM Tris-HCl pH 8.0, and 1 mM warfarin at 4°C for 20 minutes. Subsequently, 3% n-dodecyl-β-d-maltopyranoside was added to solubilize the membranes for 3 hours at 4°C. After centrifugation, the supernatant was purified through metal-affinity chromatography with 15 mM and 250 mM imidazole in washing and elution buffers containing 150 mM NaCl, 20 mM Tris pH 8.0, 0.2% n-dodecyl-β-d-maltopyranoside, and 0.1 mg/mL POPC/POPE/POPG mixture (3:1:1). The protein was further purified through a Superdex 200 column (24 mL) in a buffer containing 150 mM NaCl, 20 mM Tris pH 8.0, 0.05% lauryl maltose neopentyl glycol, and the lipid mixture. The VKORC1 protein in the mixed micelles were concentrated to 40 mg/mL for activity assay.
Fluorometric-based assay of KO and K reductase activities
The reaction catalyzed by purified VKORC1-warfarin complex was initiated in a buffer containing 20 µM KO or 50 µM K, 40 mM GSH, 0.1% lauryl maltose neopentyl glycol, 0.1 M NaCl, and 20 mM Tris pH 7.6. The KH2 fluorescence was detected with excitation at 248 nm and emission at 430 nm.26,27
Results
Reproducing the effects of SNP −1639 G>A in cells
To test the effect of SNP −1639 G>A in a cellular system, we cloned the entire VKORC1 promoter (c.-1800 to c.-0) from human genome into the pBudCE4.1 vector and placed the promoter before the cDNA coding sequence of VKORC1 (Figure 1A). The same amount of the plasmids carrying the G or A variation were transfected into the FIXgla-PC DKO cells,13 and γ-carboxylation level of secreted FIXgla-PC was measured under different warfarin concentrations. The IC50 of warfarin dose-response curve was found to be lowered by about 1.6-fold with the −1639 G>A change (Figure 1B), similar to the corresponding dose change in patients.4-8 To further compare with the clinical observations, we quantified the mRNA level of transfected cells by quantitative PCR and their protein level by western blot and in-cell ELISA. In addition, the transfection efficiency was determined by luciferase activity; the pBudCE4.1 vector contains a luciferase gene for this purpose. With DNA transfection at nearly the same level (supplemental Figure 2), the G>A change lowers the cellular mRNA level of VKORC1 by 2.1-fold (Figure 1C). The lowered protein levels are measured to be approximately 1.7- and 2.1-fold with western blot by using the anti-VKORC1 and anti-flag antibody, respectively (Figure 1D). Consistently, in-cell ELISA using the anti-flag antibody shows a twofold change of protein level (Figure 1E). Overall, introducing the promoter variation in the cellular assay system generates similar effects as SNP −1639 G>A in vivo.4-8 The lowered VKORC1 levels in cells result in the lowered warfarin IC50, which may manifest as lowered warfarin dosage in patients.
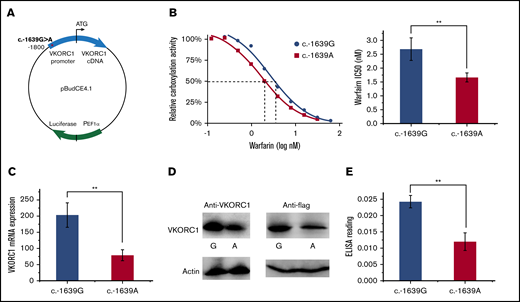
Cellular effects of SNP −1639 G>A. (A) Vector construction. VKORC1 promoter with the SNP −1639 G>A is placed before the VKORC1 cDNA in the pBudCE4.1 vector for carboxylation assay. The vector carries a luciferase gene to control for transfection efficiency. (B) Warfarin inhibition of the SNPs. Inhibition curves (left) relative IC50 level (right). (C) Cellular mRNA level of the SNPs. (D) Cellular protein level of the SNPs. The western blots use the anti-VKORC1 (left) and anti-flag (right) antibodies, with β-actin level (bottom) as controls. (E) Protein level comparison by in-cell ELISA. All error bars represent 3 repeats. **P < .01 by Student t test.
Cellular effects of SNP −1639 G>A. (A) Vector construction. VKORC1 promoter with the SNP −1639 G>A is placed before the VKORC1 cDNA in the pBudCE4.1 vector for carboxylation assay. The vector carries a luciferase gene to control for transfection efficiency. (B) Warfarin inhibition of the SNPs. Inhibition curves (left) relative IC50 level (right). (C) Cellular mRNA level of the SNPs. (D) Cellular protein level of the SNPs. The western blots use the anti-VKORC1 (left) and anti-flag (right) antibodies, with β-actin level (bottom) as controls. (E) Protein level comparison by in-cell ELISA. All error bars represent 3 repeats. **P < .01 by Student t test.
Warfarin is distinct from typical inhibitors
To further understand the correlation, we systematically varied the VKORC1 levels by changing the transfection amount of pCMV6 promoter controlled VKORC1, a construct designated for the γ-carboxylation assay, into the FIXgla-PC DKO cells.13 As expected, western blot (Figure 2A) and in-cell ELISA (Figure 2B) showed that higher amounts of DNA transfection result in higher VKORC1 expression level. With elevated protein levels, the IC50 of warfarin also increases (Figure 2C). The correlations between DNA transfection, VKORC1 level, and warfarin IC50 are nearly linear (Figure 2B,D). Thus, there is a general correlation between warfarin IC50 and VKORC1 level, explaining the effects of SNP −1639 G>A.

General correlation between warfarin IC50and VKORC1 levels. (A) Quantification of cellular VKORC1 levels. Endogenous VKOR and VKOR transfection in various amounts (top) and purified VKORC1 protein in various amounts (bottom). Anti-VKORC1 antibody was used for the western blots, which were developed simultaneously to allow direct comparison and quantification. (B) In-cell ELISA quantification of the protein level of transfected VKORC1. (C) Warfarin inhibition curves with different amounts of transfected VKORC1. (D) Correlation between warfarin IC50 (from panel C) and VKORC1 protein level. ELISA reading of the protein level is converted from DNA transfection amount (from panel B). Error bars are estimated from the inhibition curves.
General correlation between warfarin IC50and VKORC1 levels. (A) Quantification of cellular VKORC1 levels. Endogenous VKOR and VKOR transfection in various amounts (top) and purified VKORC1 protein in various amounts (bottom). Anti-VKORC1 antibody was used for the western blots, which were developed simultaneously to allow direct comparison and quantification. (B) In-cell ELISA quantification of the protein level of transfected VKORC1. (C) Warfarin inhibition curves with different amounts of transfected VKORC1. (D) Correlation between warfarin IC50 (from panel C) and VKORC1 protein level. ELISA reading of the protein level is converted from DNA transfection amount (from panel B). Error bars are estimated from the inhibition curves.
Given this linear correlation, the actual IC50 of warfarin in human cells should largely be dependent on the endogenous VKORC1 level. Because the cellular activity of endogenous VKORC1 is difficult to measure, we used a transfected VKORC1 level similar to that in Huh7 cells and HEK293 cells, which are derived from human liver and kidney, respectively; although the liver is where the warfarin inhibition of γ-carboxylation of coagulation factors occurs, all the cellular assay systems established to date used HEK293.13,16,17,23 Western blot using an anti-VKORC1 antibody showed that the endogenous VKORC1 levels in HEK293 and Huh7 cells are similar to that of 30 ng transfected VKORC1 in FIX-PC DKO HEK293 cells (Figure 2A). The amount of VKORC1 protein in these cells is further quantified by comparing with purified VKORC1 protein (see the following section) at varying concentrations, which are blotted under the same conditions (Figure 2A, bottom). After dividing the protein amount by cell density, we estimated the endogenous level of VKORC1 protein to be about 104 copies in 1 cell, corresponding to the VKORC1 concentration at the nanomolar range. Remarkably, warfarin IC50 at the endogenous VKORC1 level (estimated from 30 ng transfected DNA) is approximately 0.6 nM (Figure 2C). The proximity between the warfarin IC50 and VKORC1 concentration argues that warfarin is not a typical inhibitor, for which the IC50 must be much larger (>1000 times) than the enzyme concentration.28
GSH reduction enables effective warfarin inhibition in vitro
The cellular assay is limited in its ability to characterize enzyme inhibition kinetics precisely. To overcome this problem, we studied the inhibition kinetics of warfarin against VKORC1 in ER-enriched microsomes, which afford a native-like membrane environment in vitro. However, traditional inhibition assays using microsomes or detergent-dissolved cells, with DTT as the reductant, showed that the IC50 of warfarin is in the micromolar range. Because DTT is known to be a nonphysiological reductant, we substituted it with GSH, the major reductant in the ER, to drive VKORC1 catalysis in vitro. For comparison, we also included GSH/GSSG (3:1), which provides a similar redox potential as in the ER. With these different reducing equivalents, we analyzed the warfarin inhibition of KO to K conversion by microsomal VKORC1. Remarkably, VKORC1 becomes highly sensitive to warfarin inhibition in presence of GSH or GSH/GSSG (Figure 3A). At a fixed microsomal VKORC1 concentration, the IC50 levels with GSH and GSH/GSSG are 52 nM and 82 nM, respectively (Figure 3B). In comparison, the IC50 with DTT is 2.4 µM. Thus, using GSH as the reductant increases the warfarin sensitivity by 46-fold. This large improvement indicates that the artificially high IC50 observed in previous in vitro studies is due to the use of DTT. In contrast, in vitro assay driven by the native reductants, GSH or GSH/GSSG, shows IC50 at the nanomolar range, as observed in cellular systems and in patients.4-10,13,16,17,23
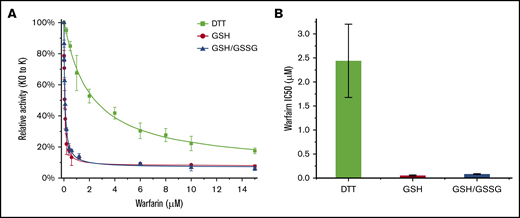
Microsomal VKORC1 maintains warfarin sensitivity with glutathione reduction. (A) Warfarin inhibition curves of VKORC1 reduced by DTT, GSH, and GSH/GSSG. Error bars are from 3 repeats. (B) Relative IC50 levels. Error bars are calculated from Morrison fitting of the inhibition curves in panel A. The IC50 levels observed with DTT, GSH, and GSH/GSSG are 2.4 ± 0.76 µM, 52 ± 12 nM, and 82 ± 7 nM, respectively.
Microsomal VKORC1 maintains warfarin sensitivity with glutathione reduction. (A) Warfarin inhibition curves of VKORC1 reduced by DTT, GSH, and GSH/GSSG. Error bars are from 3 repeats. (B) Relative IC50 levels. Error bars are calculated from Morrison fitting of the inhibition curves in panel A. The IC50 levels observed with DTT, GSH, and GSH/GSSG are 2.4 ± 0.76 µM, 52 ± 12 nM, and 82 ± 7 nM, respectively.
Warfarin shows tight-binding kinetics with microsomal VKORC1
To determine the inhibition kinetics, we measured the IC50 of warfarin with the GSH reductant and at different VKORC1 protein concentrations, which were achieved by adding different amounts of microsomes in the reaction buffer (Figure 4A). The actual VKORC1 concentrations was estimated from quantitative western blots using purified protein as the standard (Figure 4B). Plotting the IC50 levels of warfarin against the enzyme concentrations shows a linear correlation (Figure 4C), which fits to a general equation for enzyme inhibition kinetics28 : IC50= 1/2 [E] + Kiapp. The observed slope is close to 0.5, indicating that the [E] estimated from quantitative western analysis is close to the effective [E] in the reaction. The intercept gives an apparent inhibition constant (Kiapp) of about 20 nM, which is much lower than the warfarin or VKORC1 concentration used in the reaction. Thus, most of the warfarin inhibitor is bound to the VKORC1 enzyme. Consequently, the assumption of a largely free inhibitor in typical enzymology studies is no longer valid.28 This situation is deemed as tight-binding inhibition, as the VKORC1 enzyme binds warfarin with very high affinity.

Tight-binding inhibition kinetics of warfarin. (A) Warfarin inhibition curves at different concentrations of microsomal VKORC1. The concentration of total microsome proteins and that of the VKOR protein in microsomes (estimated in panel B) are indicated. Error bars are from 3 repeats. (B) Estimation of microsomal VKORC1 concentration. Series dilutions of total microsome proteins and purified protein are compared. (C) Correlation between warfarin IC50 and estimated microsomal VKORC1 concentration. (D) Effective VKORC1 concentration determined from extrapolation of the linear part of Morrison curves. The green circles in panels A and D exemplify that estimated (from panel B) and effective VKOR concentrations are similar.
Tight-binding inhibition kinetics of warfarin. (A) Warfarin inhibition curves at different concentrations of microsomal VKORC1. The concentration of total microsome proteins and that of the VKOR protein in microsomes (estimated in panel B) are indicated. Error bars are from 3 repeats. (B) Estimation of microsomal VKORC1 concentration. Series dilutions of total microsome proteins and purified protein are compared. (C) Correlation between warfarin IC50 and estimated microsomal VKORC1 concentration. (D) Effective VKORC1 concentration determined from extrapolation of the linear part of Morrison curves. The green circles in panels A and D exemplify that estimated (from panel B) and effective VKOR concentrations are similar.
The inhibition data could be fitted by the Morrison equation that defines tight-binding inhibition (Figure 4A).29 The Kiapp estimated from the Morrison equation ranges from 20 to 60 nM for the different inhibition curves, similar to the Kiapp obtained from the IC50 correlation. Extrapolation from linear region of the Morrison curves gives an accurate measure of the effective enzyme concentration28 (Figure 4D), which is close to the estimation from the quantitative western blot analysis (Figure 4B). Importantly, at different enzyme concentrations, the corresponding IC50 levels are always approximately one-half (Figure 4C). Thus, a stoichiometric amount of warfarin (1:1) is sufficient to inhibit VKORC1.
Vitamin K antidote competes off tightly bound warfarin
Using a purified system avoids potentially interfering factors in cellular and microsomal systems. However, VKORC1 quickly loses activity during protein purification in a detergent solution, underscoring the difficulty of studying this intramembrane enzyme.27 To stabilize this protein,18 we added saturating amount of warfarin to VKORC1 before membrane solubilization. With warfarin bound to VKORC1 in an essentially irreversible manner,30,31 we could purify the protein in the amount of milligrams and to near homogeneity (supplemental Figure 3A). The molar ratio between VKORC1 and warfarin should be 1:1 after size-exclusion chromatography, because free warfarin was removed and free VKORC1 protein was lost owing to instability. We varied the concentration of this VKORC1-warfarin complex and measured the apparent IC50 of warfarin. The assay was conducted with 20 μM KO or 50 μM K as the substrate and GSH as the reducing equivalent, and fluorescence of the KH2 product was monitored.26,27 The inhibition curves show that the apparent IC50 increases with the complex concentration in presence of K (Figure 5A) or KO (supplemental Figure 3B). Thus, similar to the microsomal VKORC1, the purified VKORC1-warfarin appears to follow tight-binding kinetics. Interestingly, the purified VKORC1-warfairn complex regains activity in presence of GSH and substrates, indicating that the tightly bound warfarin is released from VKORC1 during catalysis.
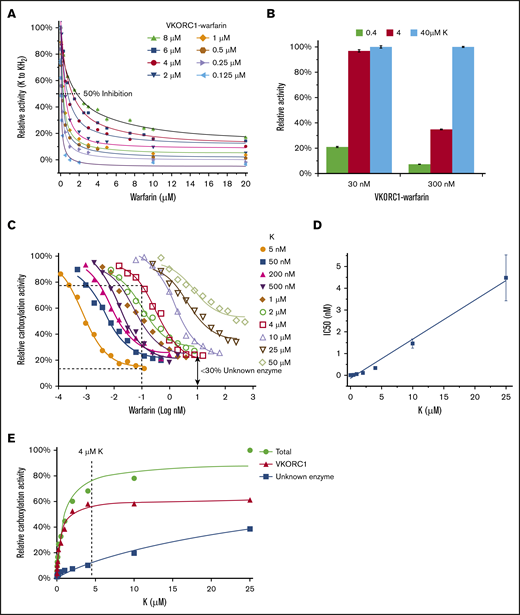
Vitamin K competition releases tightly bound warfarin. (A) Warfarin inhibition curves with different concentrations of purified VKORC1-warfarin complex and with K as the substrate. (B) Relative VKORC1 activity at varying concentrations of VKORC1-warfarin and K. (C) Warfarin inhibition of cellular activity of transfected VKORC1 under different K concentrations. The dashed line illustrates that, under the same warfarin concentration, VKORC1 activity is inhibited at 5 nM K but retained at 4 μM K. The double arrow indicates relative activity of the unknown enzyme (not inhibited by warfarin) at high warfarin concentration with 4 μM K. (D) Correlation between cellular warfarin IC50 and K concentration (from panel C). (E) Relative activities of VKORC1 and the unknown enzyme in absence of warfarin. The total carboxylation activity from VKORC1 and the unknown enzyme is measured with endogenous level of VKORC1 (30 ng; Figure 2A) transfected into DKO cells. Activity of the unknown enzyme is measured without the VKORC1 transfection, and subtraction of this activity from the total activity gives the VKORC1 activity. The curves show Michaelis-Menten fittings, and the dashed line illustrates that activity of the unknown enzyme is considerably lower than that of VKORC1 at a high K concentration (4 μM).
Vitamin K competition releases tightly bound warfarin. (A) Warfarin inhibition curves with different concentrations of purified VKORC1-warfarin complex and with K as the substrate. (B) Relative VKORC1 activity at varying concentrations of VKORC1-warfarin and K. (C) Warfarin inhibition of cellular activity of transfected VKORC1 under different K concentrations. The dashed line illustrates that, under the same warfarin concentration, VKORC1 activity is inhibited at 5 nM K but retained at 4 μM K. The double arrow indicates relative activity of the unknown enzyme (not inhibited by warfarin) at high warfarin concentration with 4 μM K. (D) Correlation between cellular warfarin IC50 and K concentration (from panel C). (E) Relative activities of VKORC1 and the unknown enzyme in absence of warfarin. The total carboxylation activity from VKORC1 and the unknown enzyme is measured with endogenous level of VKORC1 (30 ng; Figure 2A) transfected into DKO cells. Activity of the unknown enzyme is measured without the VKORC1 transfection, and subtraction of this activity from the total activity gives the VKORC1 activity. The curves show Michaelis-Menten fittings, and the dashed line illustrates that activity of the unknown enzyme is considerably lower than that of VKORC1 at a high K concentration (4 μM).
As the antidote for warfarin overdose, vitamin K is given to patients in large amount (1-10 mg) that potentially can compete off bound warfarin from VKORC1. If this competition exists, increasing concentrations of K should release more warfarin from VKORC1 and result in higher regained activity. Indeed, we found that vitamin K at 0.4, 4, and 40 µM concentration results in increasingly restored VKORC1 activity (Figure 5B). In presence of 30 nM VKORC1-warfarin complex, 4 µM of K is sufficient to restore the maximum activity level (as 40 µM of K). In contrast, when 10X more complex (300 nM) is used, 4 µM of K becomes insufficient to fully restore activity. This discrepancy is because more warfarin-bound complexes requires more vitamin K for the competition to restore VKORC1 activity.
To confirm these in vitro observations, we investigated the competition between vitamin K and warfarin in FIXgla-PC DKO cells. Using the carboxylation assay, we found that warfarin IC50 increases with K concentration in a roughly linear fashion (Figure 5C-D), consistent with the competition mechanism. Comparison of the inhibition curves show that, at the same warfarin concentration, the carboxylation activity is inhibited at low K concentration but rescued at high K concentration, as occurs during the antidotal treatment of warfarin overdose. For instance, the carboxylation activity at 5 nM K is inhibited at a plateau by 0.1 nM warfarin. At the same warfarin concentration, however, 4 μM K rescues ∼80% of the carboxylation activity, which comprises ∼50% from restored VKORC1 and 30% from an additional reductase that has been proposed to mediate the antidotal process of vitamin K.23,32 Because warfarin does not inhibit this unknown enzyme, its 30% contribution can be estimated from the retained carboxylation activity at high warfarin concentration (double arrow in Figure 5C). The apparent KM of the unknown enzyme (22.7 μM) is about 50 times higher than that of VKORC1 (0.45 μM) in the cellular assay (Figure 5E). Thus, the unknown enzyme is a poor K reductase that has a low activity even at high K concentration (eg, 4 μM). In contrast, competition at this K concentration can largely restore VKORC1 activity. To avoid complications from the unknown enzyme, we measured the warfarin IC50 with varying concentrations of KO, which cannot be reduced by the unknown enzyme (supplemental Figure 4). The inhibition curves show that high concentration of warfarin completely inhibits the total carboxylation activity that is solely from VKORC1. Importantly, increasing KO is capable of restoring the VKORC1-mediated carboxylation. Taken together, competing warfarin off from VKORC1 appears to be a major route for the vitamin K antidote to restore coagulation.
Discussion
Warfarin has been long thought to bind at the active site of VKORC119,33 and therefore should compete with substrate binding. However, warfarin shows noncompetitive inhibition kinetics in vitro,12,34,35 puzzling the field for decades. Because DTT, an artificial reductant, was used in previous studies, we replaced it with GSH in these studies to create a reductive environment similar to that in the ER. With GSH driving the VKORC1 catalysis, the K substrate becomes competitive against warfarin, consistent with the notion that warfarin binds at the active site. With the competition, the tightly bound warfarin is released and VKORC1 activity is restored. Vitamin K may have a similar competition effect in vivo when given as a warfarin antidote, in addition to the commonly accepted route that another reductase can reduce vitamin K to the hydroquinone form.23,32 According to results from the cellular model, VKORC1 released from bound warfarin may contribute more to the restored carboxylation activity than this unknown reductase does (Figure 5C), affording a new understanding of the antidotal process.
The tight binding of warfarin to VKORC1 is maintained in presence of GSH, which has key differences from DTT (Figure 6A). GSH is a monothiol that passes 1 electron at a time and only reduces 1 cysteine in a disulfide bond. Thus, GSH can maintain the partially oxidized state of VKORC1 (with 1 disulfide bond), a major form found in the cellular environment.18 In contrast, DTT is a dithiol that delivers 2 electrons and completely reduces a disulfide bond. In addition, DTT is smaller than GSH and is membrane permeable. Thus, DTT can reduce all the disulfide bonds in VKORC1, including a disulfide buried in the membrane. The native protein conformations of VKORC1, however, are presumably held together by 1 or 2 disulfide bonds. Reducing all the disulfide bonds by DTT disrupts the native conformations, thereby abolishing the tight binding of warfarin. Moreover, the redox potentials of GSH/GSSG (−160 mV) and GSH (−240 mV) are much higher than that of DTT (−325 mV). Redox equilibrium under these high potentials maintains the partially oxidized state of VKORC1 in solution, as occurring in cells. It appears that the proper redox state and native conformation of VKORC1 can be maintained once the environmental redox potential reaches a certain level, because GSH and GSH/GSSG give similar levels of warfarin inhibition. In human cells, the identity of the molecules that directly reduce VKORC1 remains unclear; these can be either partner proteins36 or small molecules abundant in the ER, such as GSH.
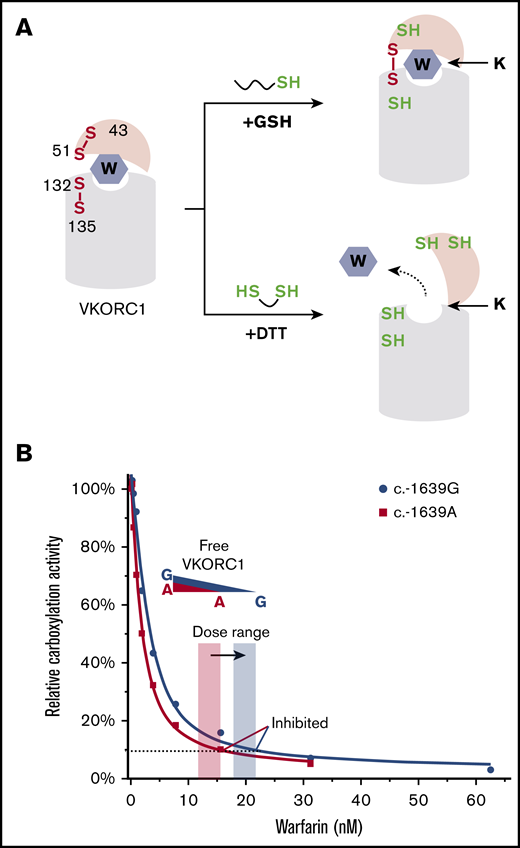
Mechanism and implication of warfarin tight-binding inhibition. (A) Difference between GSH and DTT. (Top) GSH maintains the native conformation of VKORC1 required for the tight binding of warfarin. This conformation is stabilized by a disulfide bond in the partially oxidized state.18 (Bottom) DTT fully reduces VKORC1, generating a conformation hindering warfarin binding. (B) Stoichiometric binding of warfarin explains the change of therapeutic window (orange and blue shades). The SNP inhibition curves are from Figure 1B. The dashed line indicates VKORC1 activity inhibited to the same level for the 2 SNPs.
Mechanism and implication of warfarin tight-binding inhibition. (A) Difference between GSH and DTT. (Top) GSH maintains the native conformation of VKORC1 required for the tight binding of warfarin. This conformation is stabilized by a disulfide bond in the partially oxidized state.18 (Bottom) DTT fully reduces VKORC1, generating a conformation hindering warfarin binding. (B) Stoichiometric binding of warfarin explains the change of therapeutic window (orange and blue shades). The SNP inhibition curves are from Figure 1B. The dashed line indicates VKORC1 activity inhibited to the same level for the 2 SNPs.
Using GSH drastically enhances warfarin sensitivity of VKORC1 in vitro, enabling the enzyme kinetics to be characterized within a realistic warfarin inhibition range (nanomolar). Establishing such a proper assay system for this highly unstable intramembrane enzyme has been a major obstacle in the field. Although cellular carboxylation assays13,16,17,23 provide a native environment for VKORC1, they are incapable of kinetics characterization because the carboxylation reporter is an indirect measure of the VKORC1 activity and because the diffusion rates of substrate or warfarin into the ER are unknown. The kinetics can be characterized by in vitro assays using detergent-dissolved cells or microsomes.12,25,37-39 DTT, however, is traditionally used in these assays, in which warfarin becomes a poor inhibitor with an IC50 in the micromolar range. This large discrepancy motivated our discovery that, in presence of the native GSH reductant, warfarin inhibits microsomal VKORC1 with a Kiapp in the nanomolar range, similar to that observed in cellular assays.13,16,17,23
This GSH-driven assay demonstrates that warfarin is a tight-binding inhibitor (I), which binds to their target enzyme (E) with very high affinity, and only stoichiometric amounts of I are required for the inhibition. Therefore, conventional steady-state approximations that assume [I] > > [E] are no longer valid. In fact, this assumption should be abandoned when IC50 is less than 1000 times of [E].28 The warfarin IC50 required to inhibit VKORC1 at a certain concentration clearly falls into this range, both in vitro and in cells (Figures 2 and 4). In absence of a reducing reagent, this tight binding of warfarin to VKORC1 is nearly irreversible.30,31 Warfarin is unlikely to be covalent modifier of VKORC1, however.33,40 Forming the covalent bond would require a reactive thiolate (or another nucleophile), but warfarin binds preferably to the oxidized form of VKORC119 that lacks this thiolate. Instead, the tight binding is probably because warfarin mimics a transition state of VKORC1 catalysis.41
The tight-binding inhibition explains the clinical observation of SNP −1639 G>A (Figure 6B), with which the VKORC1 protein level and warfarin dose are both lowered. Because dissociation of the tightly bound warfarin is negligible, active VKORC1 enzyme is stoichiometrically removed by warfarin. Thus, the lower the VKORC1 level, the lower the warfarin required to inhibit VKORC1. In other words, the required warfarin dose directly correlates with the SNP variation that changes cellular VKORC1 level. Furthermore, the stoichiometric inhibition can explain the additive effect of G>A allele: patients carrying homozygous A alleles require the lowest warfarin dose and those with heterozygous A allele require an intermediate dose,8 owing to the cumulative increase of VKORC1 levels.
The tight-binding mechanism may partly explain the narrow therapeutic window of warfarin. Whenever the VKORC1 expression level is exceeded by the warfarin concentration in the liver, all VKORC1 molecules are inhibited, and warfarin essentially cannot be released. The complete absence of VKORC1 activity, if sufficiently prolonged, leads to supratherapeutic anticoagulation and hemorrhage that is observed in some patients. Overall, VKORC1 levels in different patients are an important factor that may contribute to the narrow therapeutic window and interindividual variability of warfarin dosage management.
In practice, the blood level of VKORC1 protein is potentially useful to predict warfarin dose, and patients administrated with higher warfarin dosage may also require larger dose of vitamin K for antidoting owing to the competition effect (Figure 5B). Moreover, improved antidotes may be designed based on their competition efficacy with warfarin. These competitive antidotes can be vitamin K forms or derivatives that leave the VKORC1 active site after being reduced, and subsequently, are capable of driving the carboxylation reaction to restore coagulation. Potent antidotes with extended half-lives42 will be particularly useful to treat patients with superwarfarin poisoning; these rodenticides are long lasting in tissues and also show high acute toxicity resulting from their extremely high affinity for VKORC1.43
Requests for data sharing should be e-mailed to the corresponding author, Weikai Li (weikai@wustl.edu).
Acknowledgments
The authors thank Evan Sadler for his generous support and invaluable advice to W.L., Charles Eby for critical reading of the manuscript, Guomin Shen for insightful discussion, and Michael Gross for revising the writing.
W.L. is supported by the National Institutes of Health, National Heart, Lung, and Blood Institute (R01 HL121718); W. M. Keck Foundation (Basic Science @ the Forefront of Science); Children’s Discovery Institute (MC-II-2020-854); National Institutes of Health, National Eye Institute (R21 EY028705); and National Institutes of Health, National Institute of General Medical Sciences (R01 GM131008). LC-MS measurements were supported by National Institutes of Health, National Institute of General Medical Sciences (P41 GM103422).
Authorship
Contribution: S. Li performed the experiments; S. Liu purified the protein; X.R.L. and M.M.Z. conducted the LC-MS; and W.L. and S. Li designed the study, analyzed data, and wrote the manuscript.
Conflict-of-interest disclosure: The authors declare no competing financial interests.
Correspondence: Weikai Li, Department of Biochemistry and Molecular Biophysics, Washington University in St. Louis School of Medicine, 660 S Euclid Ave, St. Louis, MO 63110; e-mail: weikai@wustl.edu.

