

Key Points
Synovial hypertrophy on MRI is a strong and independent predictor for 5-year joint bleeding in hemophilia (OR, 10.1).
MRI abnormalities in apparently normal joints on radiographs are associated with development of radiographic changes 5 years later.

Abstract
Magnetic resonance imaging (MRI) is considered as the reference standard to assess early joint changes in hemophilia. However, the clinical relevance of MRI findings is still unknown. The aim of this prospective study was to assess the predictive value of MRI for 5-year joint bleeding and progression of arthropathy in patients with hemophilia. Both knees and ankles of patients with hemophilia and absent or limited arthropathy on radiographs were assessed by using MRI and radiographs. MRI scans were scored according to the International Prophylaxis Study Group MRI score for hemophilic arthropathy. Patients were followed up for 5 years, including assessment of joint bleeding and repeated radiographic assessment. Associations between baseline MRI findings with 5-year bleeding and progression of arthropathy were expressed as odds ratios (OR), adjusted for severity of disease and joint bleeding history. Baseline assessment included 104 joints of 26 patients with hemophilia (median age, 21 years). Four ankles with severe joint changes were excluded. Follow-up was available for 96 (92%) of 104 joints. During 5 years of follow-up, bleeding was reported for 36% of joints. Five-year bleeding was significantly increased in joints with synovial hypertrophy at 80% vs 27% in joints without synovial hypertrophy (OR, 10.1; 95% confidence interval, 3.4-31.3). In joints with normal baseline radiographs, any osteochondral or synovial changes on MRI were associated with radiographic changes 5 years later (positive predictive value, 75%; negative predictive value, 98%). Joints with synovial hypertrophy on MRI had a significantly higher chance of 5-year bleeding. All MRI changes, except effusion, were strong predictors for development of arthropathy on radiographs.
Introduction
Patients with hemophilia report increased bleeding in joints and soft tissues due to a deficiency in coagulation factor VIII or IX (FVIII/IX). Clotting factor replacement therapy has been available since the 1960s, and prophylactic replacement therapy (prophylaxis) is currently the preferred treatment of patients with severe hemophilia.1,2 Unfortunately, prophylaxis is costly, and minimum trough levels of FVIII/IX of 1% to 2% do not guarantee complete prevention of bleeding.3,4 Prolonged or repeated joint bleeding results in synovial hypertrophy and progressive osteochondral changes.5,6 As a result, arthropathy is still a common comorbidity in patients with hemophilia. More intensive prophylaxis is associated with lower bleeding rates but at a significant increase in treatment costs.7 With the intensification of prophylactic replacement therapy and the development of nonreplacement therapies,8-10 the need for monitoring early joint changes is increasing.
Traditionally, the 6 main joints (bilateral elbows, knees, and ankles) are examined with standard radiographs to monitor joint status. However, standard radiographs are able to assess osteochondral changes only that occur late and are mostly irreversible. Due to the current demand to detect the first, often subclinical, changes occurring in synovium and cartilage, magnetic resonance imaging (MRI) is regarded as the gold standard.11 Even if the clinical relevance of these early MRI changes is still not fully understood, it is the best tool to assess synovial changes. The synovium plays a central role in the development of hemophilic arthropathy. It has been established that synovial hypertrophy is characterized by neovascularization and an increased bleeding risk.5,12 In addition, in vitro studies have suggested that synovial changes induce metabolic osteochondral deterioration.13,14 The aim of this prospective cohort study was to assess the predictive value of synovial MRI changes for 5-year joint bleeding and progression of arthropathy on radiographs.
Methods
Study design and participants
The design of this single-center, prospective cohort study has been described previously.11 Baseline evaluation using MRI and radiographs within 2 years of MRI was performed in 2009 to 2010, and follow-up with prospective collection of bleeding data and radiographs in 2014 to 2015 was conducted. Inclusion criteria were moderate (1%-5% FVIII/IX activity) or severe (<1% FVIII/IX activity) hemophilia, age 12 to 30 years, and no or minimal arthropathy on radiographs (defined as no more than one knee or ankle with a radiological Pettersson score ≥415 ). In general, patients with severe hemophilia in our center received prophylaxis tailored according to bleeding rates. Patients with moderate hemophilia were mostly treated on demand. Bleeding risk was assumed to be comparable among patients because of this tailored treatment approach. Patients with inhibitory antibodies to FVIIII/IX or a contraindication for MRI were excluded.
The study was performed according to the Declaration of Helsinki and the principle of Good Clinical Practice, including approval of the research protocol by the institutional ethics review board. Written informed consent was obtained from all participants. Results were reported according to the Strengthening the Reporting of Observational Studies in Epidemiology recommendations.16
Data collection
Radiographs of knees and ankles were scored according to the Pettersson score by a single observer, blinded to MRI findings and number of registered joint bleeds.15,17 Baseline and follow-up radiographs were compared to assess whether progression had occurred. Progression of arthropathy on radiographs was defined as any increase in the Pettersson score (≥1).
Three-tesla (3T) MR equipment (type Achieva 3.0T TX; Koninklijke Philips Electronics NV, Eindhoven, The Netherlands) was used in all patients. The protocol for the knee consisted of 2-mm sagittal 3-dimensional water-only selection, a 3.5-mm sagittal and transversal proton density–weighted spectral adiabatic inversion recovery, and a 3.5-mm coronal T1-weighted spin echo. For the ankle, the imaging protocol consisted of 2-mm coronal 3-dimensional water-only selection, a 2.5-mm coronal proton density–weighted spectral adiabatic inversion recovery, and a 2.5-mm sagittal T1-weighted spin echo. MR images were scored by 2 independent radiologists according to the International Prophylaxis Study Group (IPSG) MRI score and an MRI atlas for hemophilic arthropathy.18,19 The IPGSG MRI scale for hemophilic arthropathy quantifies the presence of soft tissue changes (effusion/hemarthrosis, synovial hypertrophy, and hemosiderin deposition) and osteochondral changes (surface erosions, cysts, and cartilage degradation). Effusion and synovial hypertrophy were scored by using surface measurements on a single MRI plane. In the absence of published criteria, the lower cutoff values for the presence/absence of effusion and synovial hypertrophy were determined by consensus as 0.50 cm2 for knees and 0.25 cm2 for ankles. Items of the IPSG MRI score were dichotomized as present (scores ≥1) or absent (score = 0). Disagreement in MRI scores between observers were resolved in a consensus meeting.
Data analysis
Medians with interquartile ranges (IQRs) or percentages were calculated for patient and joint characteristics. Patients with severe hemophilia on prophylaxis and patients with moderate hemophilia treated on demand were compared at baseline and at follow-up using generalized estimating equation analysis with a binomial model for nominal data and a gamma with log link model for comparison of medians. Analyses were adjusted for clustering of joints within patients. The Mann-Whitney U test was used to compare the annualized joint bleeding rates (AJBRs) for patients with severe hemophilia on prophylaxis and patients with moderate hemophilia treated on demand.
Potential risk factors for 5-year bleeding were initially assessed by using univariate analyses. Subgroup analyses were performed for joints of patients with severe hemophilia on prophylaxis (n = 55) and patients with moderate hemophilia treated on demand (n = 32). Joint bleed-free survival was assessed by using Kaplan-Meier analyses. Multivariate analyses using generalized estimating equations with a binomial model were performed to assess independent risk factors for any 5-year bleeding. Analyses were adjusted for disease severity (moderate/severe), baseline cumulative lifetime bleeding history (0-2 bleeds at joint level/≥3 bleeds at joint level), and synovial hypertrophy (absent/present), taking clustering of joints within patients into account. Sensitivity analyses were performed by using multiple imputation for missing data. Results are expressed as odds ratios (ORs) with 95% confidence intervals (CIs). P < .05 was considered statistically significant.
Univariate associations between MRI findings and progression of arthropathy on radiographs were performed for joints with normal baseline radiographs (Pettersson score = 0). The predictive value of surface erosions, cysts, and cartilage degradation was combined as a single variable (osteochondral changes) to ensure sufficient power. All analyses were performed by using SPSS version 21.0 (IBM SPSS Statistics, IBM Corporation, Armonk, NY).
Results
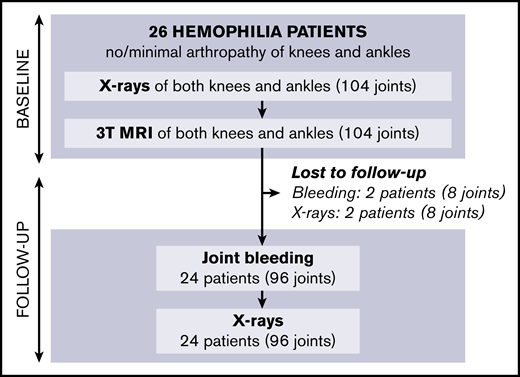
Baseline results have been reported previously11 : of 61 eligible patients, 26 with hemophilia agreed to participate. In total, 104 joints (52 knees, 52 ankles) were examined by using radiographs and 3T MRI. Four ankles with more than minimal arthropathy on radiographs at baseline (Pettersson score ≥4) were excluded from the analyses.
Patient and joint characteristics are presented in Table 1. At baseline, patients were aged 12 to 29 years. Prophylaxis was given in 15 (94%) of 16 patients with severe hemophilia (weekly dose, 38 IU/kg; IQR, 23-44 IU/kg) and in 1 (13%) of 8 patients with moderate hemophilia. Details on treatment and adherence have been published previously.11 Treatment remained unchanged during follow-up. None of the patients was treated for clinical synovitis at baseline. Clinical function was good according to the Hemophilia Joint Health Score (HJHS) assessed within 2 years of MRI (median HJHS, 0; IQR, 0-1). The majority of joints (82%) had a history of bleeding before MRI (median lifetime number of joint bleeds/joint, 2; IQR, 1-5). At baseline, the AJBRs for knees and ankles combined were low (median, 0.2; IQR, 0.5-1.2). Although radiographic abnormalities were observed in 7% of joints only, 39% of joints showed MRI abnormalities, including 24 of 48 ankles and 15 of 52 knees. The most prevalent MRI findings were effusion (23%), synovial hypertrophy (16%), and hemosiderin deposits (16%). Synovial hypertrophy and hemosiderin deposits were mostly concurrent findings; 14 of 16 joints (87.5%; confidence interval [CI], 61.7-98.5) with synovial hypertrophy showed hemosiderin deposits, and 14 of 16 joints (87.5%; CI, 61.7-98.5) with hemosiderin deposits showed synovial hypertrophy. Ankles exhibited synovial hypertrophy and hemosiderin deposits significantly more often than knees (P < .01). Figure 1 presents an example of concomitant findings of synovial hypertrophy and hemosiderin deposits in an ankle. There were no significant differences in the baseline joint characteristics between patients with moderate hemophilia treated on demand and patients with severe hemophilia on prophylaxis, nor in bleeding rates during follow-up.
Baseline patient and joint characteristics
| Patient characteristic | Median (IQR) or n (%) | |||
|---|---|---|---|---|
| N | 26 | |||
| Age, y | 21 (17-24) | |||
| Severe hemophilia | 16 (62) | |||
| Prophylactic treatment | 16 (62); 15 severe and 1 moderate hemophilia patient | |||
| Current dose of prophylaxis, IU/wk | 3000 (3000-3563) | |||
| AJBR (knees and ankles) | 0.5 (0.2-1.2) | |||
| Clinical function (HJHS) at joint level | 0 (0-1) | |||
| Pettersson score at joint level | 0 (0-0) | |||
| Joint characteristic | Severe hemophilia on prophylaxis | Moderate hemophilia treated on demand | Overall* | P† |
|---|---|---|---|---|
| N | 59 (30 knees, 29 ankles) | 36 (18 knees, 18 ankles) | 100 (52 knees, 48 ankles) | |
| History of joint bleeding | 48 (81%); 22 knees, 26 ankles | 30 (83%); 15 knees, 15 ankles | 82 (82%); 40 knees, 42 ankles | .85 |
| Pettersson score 1-3 | 5 (8%); 1 knee, 4 ankles | 2 (6%); 1 knee, 1 ankle | 7 (7%); 2 knees, 5 ankles | .50 |
| MRI score ≥1 | 21 (36%); 8 knees, 13 ankles | 17 (47%); 6 knees, 11 ankles | 39 (39%); 15 knees, 24 ankles | .35 |
| MRI findings | ||||
| Effusion | 15 (25%); 7 knees, 8 ankles | 7 (19%); 4 knees, 3 ankles | 23 (23%); 12 knees, 11 ankles | .63 |
| Synovial hypertrophy | 8 (14%); 1 knee, 7 ankles | 8 (22%); 1 knee, 7 ankles | 16 (16%); 2 knees, 14 ankles | .27 |
| Hemosiderin deposits | 8 (14%); 1 knee, 7 ankles | 8 (22%); 1 knee, 7 ankles | 16 (16%); 2 knees, 14 ankles | .34 |
| Surface erosions | 4 (7%); 1 knee, 3 ankles | 3 (8%); 1 knee, 2 ankles | 7 (7%); 2 knees, 5 ankles | .80 |
| Subchondral cysts | 3 (5%); 1 knee, 2 ankles | 2 (6%); 0 knees, 2 ankles | 5 (5%); 1 knee, 4 ankles | .91 |
| Cartilage degradation | 4 (7%); 1 knee, 3 ankles | 5 (14%); 2 knees, 3 ankles | 9 (9%); 3 knees, 6 ankles | .30 |
Four ankles with a baseline Pettersson score ≥4 were excluded.
Including 2 joints of 1 patient with severe hemophilia treated on demand, and 3 joints of 1 patient with moderate hemophilia on prophylaxis.
P value for comparison of patients with severe hemophilia on prophylaxis/patient with moderate hemophilia treated on demand, adjusted for clustering of joints within patients.

MRI of a right ankle with synovial hypertrophy and hemosiderin deposits. Synovial hypertrophy and hemosiderin deposits (arrowheads) on a sagittal T1-weighted MRI (A) and the coronal proton density–weighted MRI with fat suppression (B). The dashed white line in panel A represents the imaging plane of panel B.
MRI of a right ankle with synovial hypertrophy and hemosiderin deposits. Synovial hypertrophy and hemosiderin deposits (arrowheads) on a sagittal T1-weighted MRI (A) and the coronal proton density–weighted MRI with fat suppression (B). The dashed white line in panel A represents the imaging plane of panel B.
Knees exhibited synovial hypertrophy and osteochondral changes on MRI in only 5 of 26 patients. All patients with knee changes on MRI exhibited abnormalities in at least one ankle as well. No MRI abnormalities in knees were observed in patients with normal ankle joints. Hemosiderin deposits were only observed in 16 of 82 joints (19.5%; CI, 11.6-29.7) with a history of bleeding, compared with none of the joints without reported bleeding (0 of 18 [0%]; CI, 0.0-0.2).
Follow-up of patients is shown in Figure 2; missing data on 5-year bleeding or follow-up radiographs were <10%. After 5 years (IQR, 4.5-5.4; range, 2.8-6.1), we were unable to perform radiographs in 2 patients (8% of joints). Bleeding data could not be obtained in 2 other patients (8% of joints) due to unreliable bleeding registration and emigration. Outcomes after 5 years are presented in Table 2.
Five-year outcome at joint level
| Variable | Severe hemophilia on prophylaxis | Moderate hemophilia treated on demand | Overall* | P† |
|---|---|---|---|---|
| N | 55 | 32 | 92 | |
| Treatment, n | ||||
| Prophylaxis | 55 | 0 | 58 | |
| Bleeding | ||||
| 5-y bleeding | 18/55 (33) | 12/32 (38) | 33/92 (36) | .65 |
| No. of joint bleeds | 0 (0-1) | 0 (0-1) | 0 (0-1) | .72 |
| Progression of arthropathy | ||||
| Progression of arthropathy | 4/55 (7) | 3/32 (9) | 8/92 (9) | .53 |
| Pettersson score at follow-up | 0 (0-0) | 0 (0-0) | 0 (0-0) | .80 |
Data are presented as the median (IQR) or n/N (%) unless otherwise stated. Four ankles with a baseline Pettersson score ≥4 were excluded.
Including 2 joints of 1 patient with severe hemophilia treated on demand, and 3 joints of 1 patient with moderate hemophilia on prophylaxis.
P value for comparison of patients with severe hemophilia on prophylaxis/patients with moderate hemophilia treated on demand, adjusted for clustering of joints within patients.
Five-year bleeding
The majority of patients (88%) reported bleeding in knees or ankles during follow-up (median number of bleeds combined, 3; IQR, 1-4). Joint bleeds within 5 years of baseline MRI were reported in 23 joints (36%; CI, 26-47), including 11 knees and 22 ankles. Bleeding was similar between patients with severe hemophilia on prophylaxis and patients with moderate hemophilia treated on demand (33% vs 38% of joints; P = .65). At the patient level, the AJBRs for knees and ankles in patients with severe hemophilia on prophylaxis (median AJBR, 0.1; IQR, 0.1-0.2) and patients with moderate hemophilia treated on demand (median AJBR, 0.1; IQR, 0.0-0.3) were not significantly different during follow-up (P = .64).
MRI findings of synovial hypertrophy and osteochondral changes were the strongest and only significant predictors for 5-year bleeding (Table 3). Predictors for 5-year bleeding seemed to be strongest for patients with severe hemophilia on prophylaxis and only significant for synovial hypertrophy and osteochondral changes. No significant predictors were observed in the univariate analyses for patients with moderate hemophilia treated on demand. However, an independent increased 5-year bleeding risk for joints with synovial hypertrophy (adjusted odds ratio [OR], 10.1; CI, 3.4-31.3; P < .01) was observed in the multivariate analyses after adjusting for severity of disease, lifetime number of bleeds at joint level, and clustering of joints within patients. Sensitivity analyses using multiple imputation for missing data yielded similar results for the predictive value of synovial hypertrophy for 5-year bleeding (adjusted OR, 8.1; CI, 2.6-24.8; P < .01). Because the MRI findings of synovial hypertrophy and hemosiderin occurred concomitantly in 88% of joints (phi coefficient, 0.85; P < .01), the independent associations of these MRI findings could not be studied in the multivariate analyses. The adjusted analyses showed that disease severity (adjusted OR, 0.7; CI, 0.2-2.5) and joint bleeding history (adjusted OR, 1.8; CI, 0.7-4.4) were not predictive for 5-year bleeding. Additional analyses were performed because unadjusted analyses suggested that osteochondral changes were associated with 5-year bleeding also (unadjusted OR, 5.0; P < .05). Osteochondral changes on MRI were not independently associated with 5-year bleeding in the adjusted analyses (adjusted OR, 1.8; CI, 0.2-16.6; P = .61).
Predictors for 5-year bleeding in joints with absent or limited abnormalities on baseline radiographs
| Predictor | Unadjusted | Adjusted* | |
|---|---|---|---|
| Severe hemophilia and prophylaxis | Moderate hemophilia and on demand | Overall† | |
| N | 55 | 32 | 92 |
| Severe hemophilia | — | — | 0.7 (0.2-2.5) |
| Prophylactic treatment | — | — | — |
| Lifetime number of bleeds at joint level ≥3 | 2.9 (0.9-9.3) | 1.1 (0.3-4.6) | 1.8 (0.7-4.4) |
| MRI findings | |||
| Effusion | 1.0 (0.3-3.7) | 0.5 (0.0-5.6) | — |
| Synovial hypertrophy | 18.0 (2.0-165.0)‡ | 9.0 (0.9-10.2) | 10.1 (3.4-31.3)‡ |
| Osteochondral changes | 10.2 (1.1-100.2)‡ | 3.0 (0.4-21.3) | — |
Data are presented as ORs (95% CIs).
Adjusted for severity of disease, baseline joint bleeding history, and synovial hypertrophy.
Including 2 joints of 1 patient with severe hemophilia treated on demand, and 3 joints of 1 patient with moderate hemophilia on prophylaxis.
Significant predictor for 5-year bleeding.
Further analyses were performed to assess the absolute 5-year bleeding risk in joints with synovial hypertrophy. Joint bleed-free survival after MRI assessment was significantly worse for joints with synovial hypertrophy compared with joints without synovial hypertrophy (Figure 3). The absolute 5-year bleeding risk was 80% (CI, 52-96) for joints with synovial hypertrophy and 27% (CI, 18-39) for joints without synovial hypertrophy (P < .01). Joints with synovial hypertrophy bled more frequently: median of 2 bleeds per 5 years (IQR, 1-3; range, 0-8) vs a median of 0 bleeds per 5 years (IQR, 0-1; range, 0-4) for joints without synovial hypertrophy (P < .01).
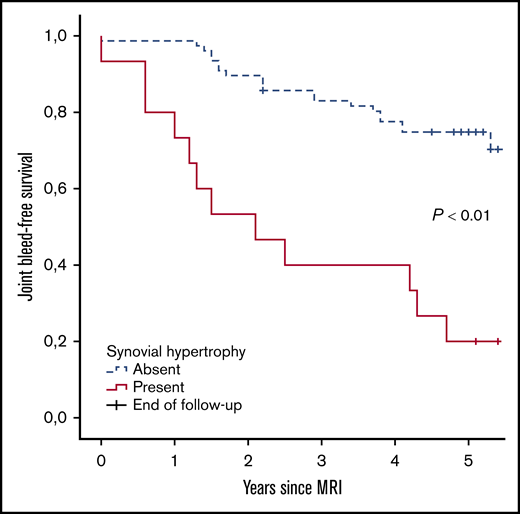
Joint bleed-free survival after MRI assessment for joints with and without synovial hypertrophy. The absolute risk of any 5-year bleeding was 80% for joints with synovial hypertrophy and 27% for joints without synovial hypertrophy.
Joint bleed-free survival after MRI assessment for joints with and without synovial hypertrophy. The absolute risk of any 5-year bleeding was 80% for joints with synovial hypertrophy and 27% for joints without synovial hypertrophy.
Development of radiographic abnormalities
Median time between series of radiographs was 5.1 years (IQR, 4.6-5.6 years). Radiographic changes after 5 years were observed in 1 knee and 7 ankles (8 of 92 joints in total [9%; CI, 4-16]). The Pettersson score increased with 1 point in 2 joints, with 2 points in 4 joints, and with 3 points in 2 joints. Observed changes were narrowing of joint space, irregularity of subchondral bone, and/or subchondral cyst formation. No improvement of radiographs scores was observed at follow-up. Because of the limited number of joints with progression of arthropathy, univariate analyses were only performed for the total group, including patients with both severe and moderate hemophilia.
Joints with normal baseline radiographs (Pettersson score, 0; 86 joints) were evaluated separately to assess the association of MRI abnormalities with the development of radiographic changes. Severity of hemophilia and type of treatment were not associated with development of radiographic changes. Predictors of radiographic development of arthropathy are presented in Table 4. A strong and significant association with radiographic progression of arthropathy was observed for MRI findings of synovial hypertrophy (OR, 24.7; CI, 3.7-163.3) and osteochondral changes (OR, 78.0; CI, 8.6-705.7). Joint effusion on MRI was not associated with progression of arthropathy on radiographs (OR, 0.6; CI, 0.1-5.8).
Unadjusted predictors for 5-year development of arthropathy in apparently normal joints on baseline radiographs
| Predictor | Overall |
|---|---|
| Severe hemophilia | 0.3 (0.0-1.6) |
| Prophylactic treatment | 0.6 (0.1-3.0) |
| Lifetime bleeds at joint level ≥3 | 6.8 (0.8-60.6) |
| MRI findings | |
| Effusion | 0.6 (0.1-5.8) |
| Synovial hypertrophy | 24.7 (3.7-163.3)* |
| Osteochondral changes | 78.0 (8.6-705.7)* |
Data are presented as ORs (95% CIs).
Significant predictor for radiographic progression of arthropathy.
To predict 5-year development of radiographic changes, both subclinical findings on MRI and bleeding during follow-up should be considered. Changes on radiographs after 5 years were therefore stratified according to the presence of MRI findings and bleeding during follow-up in Figure 4. MRI findings (excluding joint effusion) were observed in 4 of 70 apparently normal joints at baseline radiographs with available follow-up data (6%; CI, 2-14). Changes on radiographs after 5 years were observed in 3 of 4 joints with MRI findings (positive predictive value, 75%; CI, 19-99). Radiographic progression of arthropathy was observed in only 1 of 66 joints without MRI abnormalities at baseline (negative predictive value, 98%; CI, 92-100).

Development of radiographic changes in apparently normal joints at baseline with complete 5-year bleeding and follow-up radiographs (n = 70). The data were stratified according to the presence of MRI findings and report joint bleeding during 5-year follow-up (+, present; -, absent). Complete case analyses for patients with normal radiographs at baseline assessment and available data on 5-year bleeding and follow-up radiographs. Joints with baseline MRI findings (excluding joint effusion) had the highest chance of progression of arthropathy: 3 (75%) of 4 joints exhibited radiographic changes after 5 years. Joints without MRI findings exhibited radiographic changes in 1 (2%) of 66 joints only. Two joints with MRI findings at baseline developed clinical synovitis (**) after bleeding and exhibited radiographic changes as well. One other joint developed clinical synovitis (*), although it was normal on baseline MRI, did not experience bleeds, and was normal on follow-up radiographs.
Development of radiographic changes in apparently normal joints at baseline with complete 5-year bleeding and follow-up radiographs (n = 70). The data were stratified according to the presence of MRI findings and report joint bleeding during 5-year follow-up (+, present; -, absent). Complete case analyses for patients with normal radiographs at baseline assessment and available data on 5-year bleeding and follow-up radiographs. Joints with baseline MRI findings (excluding joint effusion) had the highest chance of progression of arthropathy: 3 (75%) of 4 joints exhibited radiographic changes after 5 years. Joints without MRI findings exhibited radiographic changes in 1 (2%) of 66 joints only. Two joints with MRI findings at baseline developed clinical synovitis (**) after bleeding and exhibited radiographic changes as well. One other joint developed clinical synovitis (*), although it was normal on baseline MRI, did not experience bleeds, and was normal on follow-up radiographs.
Discussion
The current study showed that synovial MRI changes are predictive for 5-year joint bleeding and progression of arthropathy in patients with hemophilia and limited arthropathy. Joints with synovial hypertrophy bled sooner and more often. Along with synovial hypertrophy, any IPSG MRI finding other than joint effusion seemed to be associated with development of radiographic changes.
Hemophilic arthropathy was assessed by using standardized imaging scales such as the Pettersson score and the IPSG MRI score.15,18 In this study, MRI was performed without the administration of contrast. MRI without contrast is less sensitive compared with MRI with contrast for the detection of synovial hypertrophy in juvenile idiopathic arthritis.20,21 This method may have resulted in an underestimation of the prevalence of subtle synovial hypertrophy in our study. Although synovial hypertrophy in patients with hemophilia is better delineated on MRI with contrast, it has been reported that the detection (presence vs absence) of synovial hypertrophy on MRI was independent of the use of contrast.22 Because the positive and negative predictive values of synovial hypertrophy on MRI without contrast were already high, the additional value of MRI with contrast is expected to be limited.
Although the number of included patients was relatively low, statistical power was increased by analyzing 4 joints per patient. The outcome of any 5-year bleeding was observed in 36% of joints. We therefore had sufficient power for multivariate analyses to assess the independent association of synovial MRI changes with 5-year bleeding. Missing data on 5-year bleeding or follow-up radiographs were <10% only, and additional sensitivity analyses suggested that this did not affect our results. Development of arthropathy was observed in 8 joints (9%), therefore allowing univariate statistical analyses only. Prolonged follow-up and/or use of more sensitive imaging modalities at follow-up may reveal a higher incidence of development of arthropathy and allow the multivariate analysis of its predictors. The clinical relevance of the observed joint degeneration remains to be established because clinical function was not routinely assessed at follow-up. However, patients with joint abnormalities on radiographs are likely to show a reduction in clinical joint function, according to previous studies reporting a strong correlation (Spearman’s correlation, 0.67) between the Pettersson score and joint function according to the HJHS.23 Eventually, joint degeneration is expected to cause clinical symptoms and affect quality of life.24
The analysis of the predictors of bleeding risk in the current study may have been influenced by including patients with both moderate and severe hemophilia. Baseline joint characteristics and 5-year bleeding rates during follow-up were comparable for patients with moderate hemophilia treated on demand and patients with severe hemophilia on prophylaxis. Despite similar bleeding rates, unadjusted analyses showed stronger predictive values for 5-year bleeding in patients with severe hemophilia on prophylaxis compared with patients with moderate hemophilia treated on demand. All multivariate analyses were adjusted for severity of disease. These analyses showed that synovial hypertrophy was a strong and independent predictor for 5-year bleeding (adjusted OR, 10.1; P < .01).
Comparison with other studies
For comparison with other publications and to evaluate the external validity, we had to consider joint bleeding rates. Patients in the current study were exposed to a median of 3 joint bleeds (sum of knees and ankles) during the 5-year follow-up (median AJBR for knees and ankles, 0.1). Other clinical studies reported a median AJBR of 1.4 in adolescents and 1.1 in adults.25-27 The bleeding data of previous studies include all joints (mainly the elbows, knees, and ankles28 ). Because data on the distribution of joint bleeding in previous studies are unavailable, a direct comparison is impossible. However, it is expected that the bleeding rate in the current population is close to bleeding rates in other studies of patients treated with prophylaxis.
Previous longitudinal studies in hemophilia have focused primarily on evaluation of prophylactic treatment. The aim of the current study was to evaluate the value of early subclinical joint abnormalities on MRI for prediction of joint bleeding and progression of arthropathy. Previously, Pergantou et al29 evaluated progression of arthropathy in 24 children with hemophilia aged 11 ± 4 years (75% severe hemophilia, 67% on prophylaxis). Patients were followed up for 4 years after MRI assessment of elbows (n = 18), knees (n = 27), and ankles (n = 18). At baseline, joints had a mild arthropathy on radiographs (median Pettersson score, 2.1 of 13) and more profound abnormalities on MRI (median Denver MRI score, 4.5 of 10). Progression of arthropathy on radiographs was observed in 15% of joints. In contrast, improvement of radiographic scores was observed in 40% of joints (osteoporosis, enlargement of epiphysis). In the current study, we observed progression of arthropathy in 9% of joints that were normal on baseline radiographs, but we observed no improvement in radiographic scores. The improved radiographic scores as observed by Pergantou et al may be explained by the 3-fold decrease of the annualized bleeding rate from 2.0 to 0.7 as a result of MRI-guided treatment changes in 18 of 40 patients. In addition to treatment effects, patients were adolescents, and osteoporosis and enlargement of epiphysis may remodel during growth.
Clinical implications
How can monitoring of hemophilia treatment be optimized? Although costly clotting factor replacement therapy dramatically improved treatment over the past decades, joint bleeding and subsequent arthropathy still occur in patients on intermediate- and high-dose prophylaxis.7 In addition, occasional joint bleeding is still reported, even with the new nonreplacement therapies.9 A first step for further improvement of monitoring may be to initiate targeted monitoring by identifying joints at risk of bleeding and progression of arthropathy. We evaluated the relevance of early MRI findings and found that synovial hypertrophy was associated with subsequent bleeding. In contrast, normal joints on MRI findings are unlikely to bleed or develop radiographic changes. This finding has implications for both treatment and monitoring. The knowledge on the relevance of early joint changes may be used to start or intensify prophylaxis, emphasize adherence,30 initiate additional treatment with anti-inflammatory medication, or switch to new nonreplacement therapies. These findings emphasize the need for aggressive treatment of synovial hypertrophy with intensive replacement therapy.31 Recovery of joint changes after bleeding episodes vary among patients (K.F., unpublished observational data), and monitoring and individualized treatment based on imaging findings after joint bleeding could limit the development of synovitis and are expected to lower the risk of a re-bleed.
Because MRI is not suitable for routine joint assessment due to limited availability and costs, and radiographs show only osteochondral (ie, late) joint changes, point of care ultrasound may be used as an accurate alternative.32-34 This approach is supported by the European Society of Musculoskeletal Radiology, stating that ultrasound is the first-choice modality to evaluate synovitis.35 Further studies are required to confirm the associations of MRI findings with bleeding and development of arthropathy. It remains to be established whether MRI findings are responsive to treatment changes and whether image-guided treatment changes improve joint outcomes.
In conclusion, MRI evaluation of joints provides relevant information in patients with hemophilia with absent or limited arthropathy. Synovial MRI changes were a strong predictor for 5-year bleeding and progression of arthropathy. Both synovial hypertrophy and osteochondral changes were strongly associated with progression of arthropathy, whereas effusion on MRI was not. These findings emphasize the importance of monitoring joint status and may be used to guide treatment.
Acknowledgments
The baseline collection of MRIs was sponsored by an independent research grant from Pfizer.
K.F. is the epidemiologist for the European Haemophilia Safety Surveillance Study and PedNet registries.
Authorship
Contribution: W.F. performed the research, analyzed the data, and wrote the first draft of the paper; I.C.v.d.S. and F.J.A.B. scored the MRIs; W.P.T.M.M. supervised the study; K.F. designed and supervised the study, including the statistical analyses; and all authors participated in writing the manuscript.
Conflict-of-interest disclosure: W.F. received research grants from Novo Nordisk and Pfizer, which were paid to the institution. K.F. has received speakers fees from Bayer, Baxter/Shire, SOBI/Biogen, CSL Behring, Octapharma, Pfizer, and Novo Nordisk; performed consultancy for Bayer, Baxter, Biogen, CSL-Behring, Freeline, Novo Nordisk, Pfizer, Roche, and SOBI; and has received research support from Bayer, Pfizer, Baxter/Shire, and Novo Nordisk. The remaining authors declare no competing financial interests.
Correspondence: Wouter Foppen, University Medical Center Utrecht, HP E01.132, P.O. Box 85500, 3508 GA Utrecht, The Netherlands; e-mail: w.foppen@umcutrecht.nl.

