

Key Points
Impaired BM ECs preallotransplant are responsible for the defective hematopoiesis postallotransplant.
Prophylactic oral NAC safely and effectively prevents poor hematopoietic reconstitution by improving BM EC function postallotransplant.

Abstract
Poor graft function (PGF) and prolonged isolated thrombocytopenia (PT) remain life-threatening complications after allogeneic hematopoietic stem cell transplantation (allo-HSCT). Endothelial cells (ECs) play a crucial role in regulating hematopoiesis in the bone marrow (BM) microenvironment. However, whether the impaired BM ECs are responsible for defective hematopoiesis in PGF and PT patients requires clarification, and clinical management is challenging. Two prospective clinical trials were included in the current study. In the first trial (N = 68), PGF and PT patients demonstrated defective BM ECs pre-HSCT and impaired BM EC dynamic reconstitution at early time points post-HSCT, which was positively correlated with reactive oxygen species (ROS) levels. Receiver operating characteristic curves showed that BM EC < 0.1% pre-HSCT could identify high-risk patients with PGF and PT. The second trial enrolled patients (N = 35) with EC < 0.1% who accepted oral N-acetyl-l-cysteine (NAC; 400 mg 3 times per day) from −14 days pre-HSCT to +2 months post-HSCT continuously, whereas the remaining EC ≥ 0.1% patients (N = 39) received allo-HSCT only. Prophylactic NAC intervention was safe and effective in preventing the occurrence of PGF and PT in EC < 0.1% patients by promoting the dynamic reconstitution of BM ECs and CD34+ cells, along with reducing their ROS levels, which was further confirmed by in situ BM trephine biopsy analyses. These findings suggest that the impaired BM ECs pre-HSCT are responsible for the defective hematopoiesis in PGF and PT patients. Therefore, improvement of BM ECs through prophylactic NAC intervention may be a promising therapeutic approach to promote hematopoietic reconstitution post-HSCT. This trial was registered at www.clinicaltrials.gov as #NCT03236220 and #NCT02978274.
Introduction
Although most patients achieve rapid and stable hematopoietic recovery after allogeneic hematopoietic stem cell transplantation (allo-HSCT), poor hematopoietic reconstitution, including poor graft function (PGF)1-5 and prolonged isolated thrombocytopenia (PT),6-8 remains a life-threatening complication after allo-HSCT. In particular, with the increasing use of haploidentical allo-HSCT (haplo-HSCT), PGF and PT have become growing obstacles contributing to the high morbidity and mortality post-HSCT.9-12 Due to the limited mechanistic studies, the clinical management of PGF and PT is challenging. Therefore, a better understanding of the pathogenesis of PGF and PT will help guide effective treatments and eventually improve prognosis.
Prompt and stable engraftment is dependent on both hematopoietic stem cells (HSCs) and the bone marrow (BM) microenvironment, where HSCs reside.13-17 BM endothelial cells (ECs), which have been identified as a preferential element of the BM microenvironment, possess the capacity to support and regulate hematopoiesis and megakaryocytopoiesis.15-19 We recently reported that even if the transplanted donor CD34+ cells are quantitatively and functionally normal pretransplant, reactive oxygen species (ROS) induced exhaustion of CD34+ cells in PGF patients post-HSCT.3 Moreover, our previous studies showed that reduced and dysfunctional BM ECs post-HSCT are involved in the pathogenesis of PGF and PT.1,2,4,6,8 However, the BM ECs in PGF and PT patients were evaluated at a median of 2 to 3 months post-HSCT.1,2,4,6,8 Therefore, whether BM EC dysfunction in PGF and PT patients is responsible for defective hematopoiesis, or vice versa, requires further clarification.12
ROS play an important role in the control of EC function and vascular integrity.20,21 Moreover, ROS distinctly influence HSCs and megakaryocytes in the BM microenvironment.22,23 We recently found increased ROS levels in BM ECs and HSCs of PGF and PT patients.3,4,6 N-acetyl-l-cysteine (NAC), a ROS scavenger, has been widely used as an exogenous antioxidant20,23,24 and a clinical mucolytic drug without significant side effects.21,25 Emerging evidence from in vitro and murine studies showed that NAC not only reversed EC dysfunction but also overcame the exhaustion of HSCs and enhanced the engraftment of HSCs.21,23,24 In this regard, we recently reported that NAC could enhance defective HSCs by repairing dysfunctional BM ECs of PGF and PT patients.3,4,6 Our recent study demonstrated that oral NAC could partially repair the dysfunctional BM ECs and improve megakaryocytopoiesis in PT patients, which suggests that NAC is a promising drug for PT patients.6
In the current study, 2 prospective clinical trials were performed to investigate whether defective BM ECs pre-HSCT is the risk factor for the occurrence of PGF and PT. Moreover, we evaluated whether prophylactic NAC intervention could repair the impaired BM ECs and reduce the incidence of PGF and PT post-HSCT.
Methods
Study design and patients
Two prospective clinical trials were included in the study (supplemental Figure 1). The first trial enrolled 68 patients aged 16 to 58 years who were diagnosed with acute leukemia with complete remission and scheduled to receive haplo-HSCT between March 2016 and March 2017 at Peking University People's Hospital. The percentages and ROS levels of BM ECs and CD34+ cells were evaluated at −14 days pre-HSCT and +1 month and +2 months post-HSCT. Receiver operating characteristic (ROC) curves were used to identify the cutoff percentage of BM ECs pre-HSCT to predict patients at high risk for the occurrence of PGF and PT at +2 months post-HSCT. Based on the ROC cutoff percentage of BM ECs pre-HSCT (0.1%), the enrolled patients were risk-stratified into a BM EC ≥ 0.1% group (N = 38) and a BM EC < 0.1% group (N = 30).
Subsequently, between August 2017 and June 2018, 74 patients aged 16 to 55 years who were diagnosed with acute leukemia with complete remission and scheduled to receive haplo-HSCT were consecutively screened for inclusion in the second trial. Based on the ROC cutoff percentage of BM ECs pre-HSCT (0.1%), BM EC < 0.1% pre-HSCT patients (N = 35) who were willing to accept oral NAC treatment (400 mg 3 times per day) from −14 days pre-HSCT to +2 months post-HSCT continuously were enrolled in the cohort study. Exclusion criteria were bronchial asthma and NAC allergy. BM EC ≥ 0.1% pre-HSCT patients (N = 39) received haplo-HSCT only.
The study protocol was approved by the ethics committee of Peking University People's Hospital, and written informed consent was obtained from all patients before study entry, in accordance with the Declaration of Helsinki.
Definitions of PGF, PT, and GGF
As previously described, PGF1-5 was defined as the presence of 2 or 3 cytopenic counts (absolute neutrophil count [ANC] ≤ 0.5 × 10⁹/L, platelet ≤ 20 × 109/L, or hemoglobin ≤ 70 g/L) for at least 3 consecutive days beyond day +28 posttransplantation with a transfusion requirement, associated with hypoplastic-aplastic BM, in the presence of complete donor chimerism. PT6-8 was defined as the engraftment of all peripheral blood cell lines (ANC > 0.5 × 10⁹/L and hemoglobin > 70 g/L without transfusion support) other than a platelet count < 20 × 109/L or a dependence on platelet transfusions for >60 days following allo-HSCT in the presence of complete donor chimerism. Patients with evidence of hematological relapse post-HSCT were excluded. Good graft function (GGF)1-8 was defined as a persistent successful engraftment, as marked by ANC >0.5 × 10⁹/L for 3 consecutive days without granulocyte colony-stimulating factor (G-CSF) administration, platelet > 20 × 109/L for 7 consecutive days without platelet transfusion, and hemoglobin > 70 g/L without red blood cell transfusion, beyond day +28 post-HSCT.
Transplantation protocols
Donor selection, human leukocyte antigen typing, graft harvesting, conditioning regimen (antithymocyte globulin and G-CSF based), acute graft-versus-host disease (aGVHD), and cytomegalovirus (CMV) prophylaxis and treatment were performed as previously described (supplemental Methods).26-31 Comorbidities in HSCT recipients were assessed according to the hematopoietic cell transplantation–specific comorbidity index (HCT-CI).32
Quantity and function analysis of BM ECs
The percentage and function of BM ECs were evaluated at −14 days and 0 days pre-HSCT and +1 month and +2 months post-HSCT. The BM aspirate samples used for the analysis of EC percentage and function were all taken from the same “draw” at the time of BM aspirate collection. As previously described,1,2,4,6,8,33,34 BM ECs and endothelial progenitor cells (EPCs) were identified by mouse anti-human CD34, vascular endothelial growth factor receptor 2 (CD309), and CD133 monoclonal antibodies (BD Biosciences) and analyzed using a LSRFortessa cell analyzer (Becton Dickinson). BM ECs and EPCs were quantified by the percentages of CD34+CD309+ cells and CD34+CD309+CD133+ cells in total BM mononuclear cells, respectively.
The functions of BM ECs and EPCs, including the intracellular ROS levels3,4,6,33 ; double-positive staining with both Dil-acetylated low density lipoprotein (DiI-AcLDL) and fluorescein isothiocyanate–labeled Ulex europaeus agglutinin-I (FITC-UEA-1)4,6,20,33 ; and migration assays4,6,33 were evaluated pre- and post-HSCT as previously reported. Intracellular ROS levels was measured by incubation of the aforementioned EC or EPC marker-stained cells with 10 μM 2′,7′-dichlorofluorescence diacetate (DCFH-DA; Beyotime) at 37°C for 15 minutes. The mean fluorescence intensity of intracellular ROS was detected on a LSRFortessa cell analyzer (Becton Dickinson).3,4,6,33
In situ BM trephine biopsies were stained by the mouse anti-human CD34 (Becton Dickinson) and rabbit anti-human CD133 (Abcam) antibodies. The goat anti-rabbit 555 and donkey anti-mouse 488 (Invitrogen) antibodies and 4′,6-diamidino-2-phenylindole were applied, and the slides were analyzed under a Leica TCS SP8 microscope (Leica Microsystems).6,33,35
End points
The primary end point was the incidence of PGF and PT at +2 months post-HSCT. Secondary end points included treatment-related adverse events during oral administration of NAC, cumulative incidences of relapse (CIR), aGVHD, nonrelapse mortality (NRM), overall survival (OS), disease-free survival (DFS), and the related laboratory evaluation. Hematological relapse was defined according to National Cancer Institute (NCI) workshop definitions. Toxic effects were graded according to the NCI Common Terminology Criteria for Adverse Events, version 3. Common hematological and nonhematological adverse events were monitored twice per week during the oral administration of NAC. Neutrophil engraftment was defined as ANC > 0.5 × 10⁹/L for 3 consecutive days without G-CSF administration. Platelet engraftment was defined as >20 × 109/L for 7 consecutive days without transfusion. aGVHD was diagnosed and graded based on published consensus criteria.36,37
Statistical analysis
The sample size was calculated on the basis of the Simon 2-stage “minimax” design38 to test the null hypothesis that the PGF and PT rate at +2 months among patients with BM EC < 0.1% pre-HSCT (primary end point) would be 40% or higher (ie, before the investigators could proceed to stage 2 of the study, if 6 or fewer of 14 patients had PGF and PT). The 40% rate was estimated on the basis that 12 of 30 patients (40%) in the first trial without NAC had PGF and PT at +2 months. We calculated that a sample of 27 patients would provide 90% power to test a difference in the PGF and PT rate at +2 months of 40% vs 15% at a 1-sided α level of 0.05. We intentionally overrecruited a total of 35 patients to account for cancelled or ineligible patients. All patients who received and completed NAC treatment were evaluated for efficacy and safety.
The follow-up end point was 1 July 2018. Correlation analyses were performed using Pearson correlation. ROC curves were used to demonstrate the association between the percentages of BM ECs before allo-HSCT and the incidence of PGF and PT at +2 months post-HSCT. Multivariate analyses were performed using the Cox proportional hazards model for survival to identify the independent prognostic variables. The parameters with P < .10 according to the univariate analysis were entered into a multivariate model. Cumulative incidence curves were used in a competing risk setting, with relapse treated as a competing event, to calculate NRM probabilities, and with death from any cause as a competing risk for PGF, PT, engraftment, aGVHD, and relapse. Comparisons between cumulative incidences were performed by the Gray test. The probabilities of DFS and OS were estimated with the Kaplan-Meier method and were compared using the log-rank test. Statistical analyses were performed using 1-way analysis of variance (ANOVA) for comparisons among the groups. Subject variables were compared using the χ2 test for categorical variables and the Mann-Whitney U test for continuous variables. Analyses were performed using GraphPad Prism 6.0 (GraphPad Software) and R version 3.4.4 (The R Foundation for Statistical Computing). Unless otherwise specified, all P values were 2-sided and P < .05 was considered significant.
Results
PGF and PT patients had defective BM ECs pre-HSCT and impaired BM EC dynamic reconstitution at early time points after allo-HSCT
In the first trial, 15 of 68 enrolled patients developed PGF or PT, whereas the remaining 53 patients had GGF at +2 months post-HSCT. The typical EC phenotype was demonstrated by positive expression of CD34 and CD309 by flow cytometry (Figure 1A).The percentages of BM ECs were markedly lower at −14 days pre-HSCT (Figure 1B; 0.05% ± 0.01% vs 0.19% ± 0.02%; P = .0005) and +1 month (Figure 1B; 0.04% ± 0.01% vs 0.11% ± 0.01%; P < .0001) and +2 months post-HSCT (Figure 1B; 0.10% ± 0.03% vs 0.17% ± 0.02%; P = .02) in PGF and PT patients than GGF patients. However, the ROS levels of BM ECs were significantly elevated in PGF and PT patients compared with GGF patients at −14 days pre-HSCT (Figure 1C; 2765 ± 171.5 vs 2022 ± 89.72; P = .001), and +1 month (Figure 1C; 3547 ± 244.1 vs 2068 ± 104.2; P < .0001), +2 months post-HSCT (Figure 1C; 2383 ± 223.9 vs 1683 ± 97.3; P = .005).
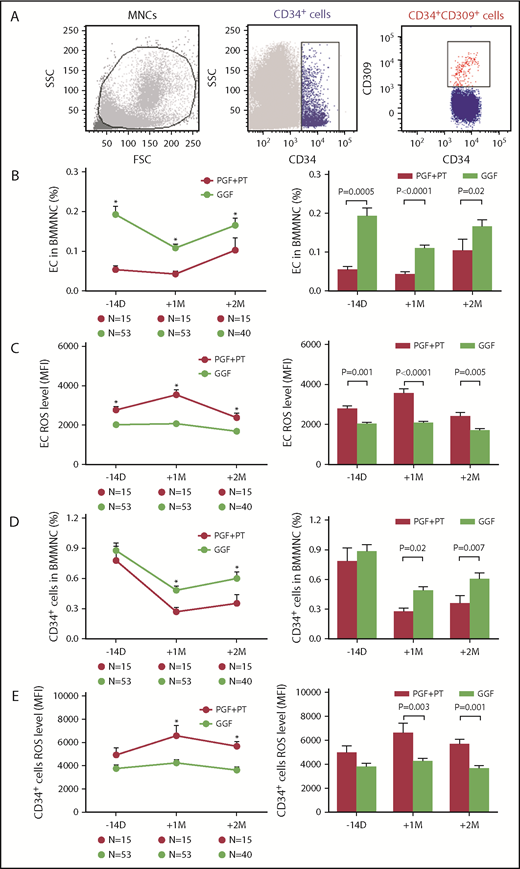
PGF and PT patients demonstrated defective BM ECs pre-HSCT and impaired dynamic reconstitution of BM ECs and CD34+cells at early time points post-HSCT. Dynamic reconstitution (left panel) and statistical analysis (right panel) of BM in the first clinical trial. Representative image of ECs demonstrated by flow cytometry (A), EC percentages (B), EC ROS levels (C), CD34+ cell percentages (D), and CD34+ cell ROS levels (E) analyzed by flow cytometry in PGF, PT, and GGF patients at −14 days pre-HSCT and +1 month and +2 months post-HSCT. The data are expressed as the mean and standard error of the mean (SEM). Statistical analyses were performed using 1-way ANOVA for comparisons among the groups. Subject variables were compared using the χ2 test for categorical variables and the Mann-Whitney U test for continuous variables. P < .05 was considered statistically significant and is provided in the figure. *P < .05. FSC, forward scatter; MFI, mean fluorescence intensity; MNC, mononuclear cell; SSC, side scatter.
PGF and PT patients demonstrated defective BM ECs pre-HSCT and impaired dynamic reconstitution of BM ECs and CD34+cells at early time points post-HSCT. Dynamic reconstitution (left panel) and statistical analysis (right panel) of BM in the first clinical trial. Representative image of ECs demonstrated by flow cytometry (A), EC percentages (B), EC ROS levels (C), CD34+ cell percentages (D), and CD34+ cell ROS levels (E) analyzed by flow cytometry in PGF, PT, and GGF patients at −14 days pre-HSCT and +1 month and +2 months post-HSCT. The data are expressed as the mean and standard error of the mean (SEM). Statistical analyses were performed using 1-way ANOVA for comparisons among the groups. Subject variables were compared using the χ2 test for categorical variables and the Mann-Whitney U test for continuous variables. P < .05 was considered statistically significant and is provided in the figure. *P < .05. FSC, forward scatter; MFI, mean fluorescence intensity; MNC, mononuclear cell; SSC, side scatter.
Significantly reduced percentages of BM CD34+ cells with increased ROS levels in PGF and PT patients after allo-HSCT
Although similar numbers of donor CD34+ cells (3.2 × 10⁶/kg vs 2.9 × 10⁶/kg; P = .32) were transplanted, the percentages of BM CD34+ cells in PGF and PT patients were significantly lower than those in GGF patients at +1 month (Figure 1D; 0.27% ± 0.04% vs 0.48% ± 0.04%; P = .02) and +2 months post-HSCT (Figure 1D; 0.35% ± 0.08% vs 0.60% ± 0.07%; P = .007).
Determination of the cutoff percentage of BM ECs pre-HSCT
ROC curves revealed that the pre-HSCT BM ECs could significantly identify patients with different incidences of PGF and PT at +2 months post-HSCT (Figure 2A; area under the ROC curve, 0.80, P = .0004). Based on the Youden index, a pre-HSCT BM EC cutoff percentage (0.1%), which had a sensitivity of 80% and specificity of 66% to predict the occurrence of PGF and PT at +2 months post-HSCT, was selected for the subsequent analyses.
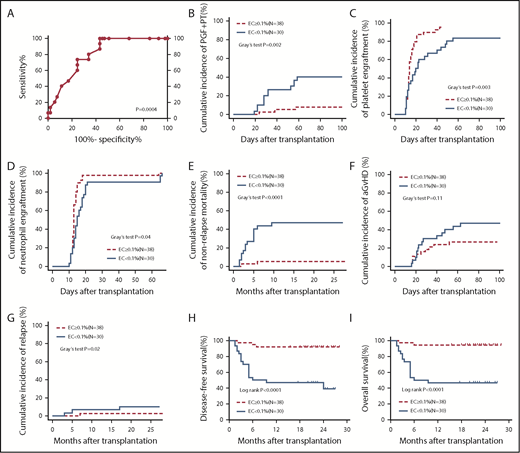
Poor transplant outcomes in the pre-HSCT EC < 0.1% group relative to the EC ≥ 0.1% group. Based on the ROC cutoff percentage of BM ECs pre-HSCT (0.1%), the enrolled patients were assigned to the BM EC ≥ 0.1% group (N = 38) and the BM EC < 0.1% group (N = 30) in the first clinical trial. ROC curve (A), cumulative incidences of PGF and PT (B), platelet engraftment (C), neutrophil engraftment (D), NRM (E), aGVHD (F), and relapse (G), and probabilities of DFS (H) and OS (I) were compared between the EC < 0.1% group and the EC ≥ 0.1% group. Cumulative incidence curves were analyzed using a competing risk setting and were compared using the Gray test. The probabilities of DFS and OS were estimated with the Kaplan-Meier method and were compared using the log-rank test.
Poor transplant outcomes in the pre-HSCT EC < 0.1% group relative to the EC ≥ 0.1% group. Based on the ROC cutoff percentage of BM ECs pre-HSCT (0.1%), the enrolled patients were assigned to the BM EC ≥ 0.1% group (N = 38) and the BM EC < 0.1% group (N = 30) in the first clinical trial. ROC curve (A), cumulative incidences of PGF and PT (B), platelet engraftment (C), neutrophil engraftment (D), NRM (E), aGVHD (F), and relapse (G), and probabilities of DFS (H) and OS (I) were compared between the EC < 0.1% group and the EC ≥ 0.1% group. Cumulative incidence curves were analyzed using a competing risk setting and were compared using the Gray test. The probabilities of DFS and OS were estimated with the Kaplan-Meier method and were compared using the log-rank test.
BM EC < 0.1% pre-HSCT was an independent risk factor for the occurrence of PGF and PT post-HSCT with poor transplant outcomes
In univariate analysis, BM EC < 0.1% pre-HSCT (P = .005), high-risk disease status pre-HSCT (P = .006), and the preceding CMV infection (P = .04) were significantly related to an increased incidence of PGF and PT. In multivariate analysis, BM EC < 0.1% pre-HSCT (hazard ratio, 6.11; 95% confidence interval, 1.72-21.67; P = .005) was independently correlated with an increased incidence of PGF and PT after allo-HSCT (supplemental Table 1).
Based on the ROC cutoff percentage of BM ECs pre-HSCT, the enrolled patients were assigned to an EC ≥ 0.1% group (N = 38) and an EC < 0.1% group (N = 30) in the first trial. As shown in Table 1, most of the demographic and clinical characteristics showed no significant differences between the 2 groups of patients.
Characteristics of allotransplant patients with BM EC < 0.1% or EC ≥ 0.1% pre-HSCT
| Characteristics | 1EC < 0.1%, N = 30 | 1EC ≥ 0.1%, N = 38 | P* | 2EC < 0.1% + NAC, N = 35 | 2EC ≥ 0.1%, N = 39 | P† | P‡ |
|---|---|---|---|---|---|---|---|
| BM ECs pre-HSCT, median (range), % | 0.04 (0.01-0.09) | 0.2 (0.1-0.6) | <.0001 | 0.05 (0.01-0.08) | 0.2 (0.1-0.7) | <.0001 | .36 |
| Blood cell count at +2 mo post-HSCT, median (range) | |||||||
| WBC, ×109/L | 3.2 (1.2-8.3) | 5.1 (1.7-10.7) | .04 | 3.75 (1.4-9.8) | 3.6 (2.1-11.3) | .59 | .67 |
| ANC, ×109/L | 1.5 (0.6-5.1) | 2.2 (0.7-9) | .04 | 1.8 (0.7-8.8) | 1.9 (0.8-7.4) | .95 | .18 |
| Hb, g/L | 90 (61-132) | 99 (69-137) | .13 | 96 (70-137) | 97 (63-124) | .67 | .24 |
| PLT, ×109/L | 39 (13-142) | 72 (28-262) | .04 | 79 (45-175) | 78 (42-196) | .83 | .005 |
| Age at HSCT, median (range), y | 32 (16-52) | 33 (18-58) | .66 | 31 (16-54) | 32 (18-55) | .21 | .42 |
| Sex, male/female | 15/15 | 22/16 | .63 | 17/18 | 17/22 | .82 | 1.00 |
| Underlying disease, n | .81 | 1.00 | .81 | ||||
| AML | 16 | 22 | 17 | 20 | |||
| ALL | 14 | 16 | 18 | 19 | |||
| Status at HSCT, n | 1.00 | .81 | 1.00 | ||||
| Standard-risk | 20 | 26 | 23 | 27 | |||
| High-risk | 10 | 12 | 12 | 12 | |||
| HCT-CI pre-HSCT score | .43 | .91 | .65 | ||||
| 0-2 | 29 | 35 | 33 | 37 | |||
| ≥3 | 1 | 3 | 2 | 2 | |||
| Source of stem cell | 1.00 | 1.00 | 1.00 | ||||
| BM and PB, n | 30 | 38 | 35 | 39 | |||
| Transplanted total nucleated cell dose, median (range), ×108/kg | 7.9 (6.6-12.4) | 8.1 (6.3-10.5) | .85 | 8.2 (6.5-12.4) | 8.2 (5.6-11.5) | .13 | .55 |
| Transplanted CD34+ cell dose, median (range), ×106/kg | 2.8 (1.6-4.3) | 3.1 (1.1-4.5) | .38 | 3.0 (1.9-4.2) | 2.8 (1.1-4.1) | .55 | .82 |
| Donor match, n | .60 | 1.00 | .79 | ||||
| HLA ≤3 locus matched related donor | 22 | 25 | 24 | 27 | |||
| HLA >3 locus matched related donor | 8 | 13 | 11 | 12 | |||
| Sex mismatch, n | |||||||
| Female to male | 3 | 7 | .49 | 5 | 3 | .46 | .72 |
| Female to female | 3 | 6 | .72 | 4 | 6 | 1.00 | 1.00 |
| Male to female | 15 | 10 | .08 | 14 | 16 | .50 | .33 |
| Male to male | 9 | 15 | .45 | 12 | 14 | 1.00 | .79 |
| ABO mismatch, n | |||||||
| No | 16 | 27 | .21 | 20 | 23 | 1.00 | .81 |
| Minor | 9 | 4 | .06 | 5 | 6 | 1.00 | .14 |
| Major | 5 | 7 | 1.00 | 10 | 10 | .80 | .38 |
| Pre-HSCT cycles of chemotherapy, n (range) | 4 (0-7) | 4 (3-8) | .11 | 4 (2-7) | 4 (3-8) | .08 | .49 |
| Conditioning | 1.00 | 1.00 | 1.00 | ||||
| BU/CY + ATG, n | 30 | 38 | 35 | 39 | |||
| aGVHD post-HSCT, n | 14 | 10 | .12 | 14 | 16 | 1.00 | .62 |
| Onset of aGVHD post-HSCT, median (range), d | 24.5 (16-63) | 23.5 (15-52) | .34 | 25 (17-59) | 25 (15-57) | .28 | .87 |
| aGVHD treatment, n | .94 | .87 | 1.00 | ||||
| Steroid | 10 | 7 | 10 | 11 | |||
| Second- or third-line therapy | 4 | 3 | 4 | 5 | |||
| TMA post-HSCT | 0 | 1 | 1.00 | 0 | 1 | 1.00 | 1.00 |
| Onset of TMA post-HSCT, d | 145 | 90 | |||||
| CMV reactivation post-HSCT, n | 24 | 21 | .04 | 26 | 22 | .14 | .77 |
| Onset of CMV reactivation post-HSCT, median (range), d | 35 (20-52) | 36 (22-51) | .56 | 35 (26-52) | 36 (27-54) | .49 | .79 |
| CMV reactivation treated with ganciclovir, n | 18 | 16 | .22 | 20 | 16 | .24 | .82 |
| G-CSF administration post-HSCT, median (range), μg | 5 012 (1 900-12 850) | 3425 (1600-7750) | <.0001 | 3700 (1600-7450) | 3700 (1600-8750) | .51 | .008 |
| Transfusion of PLT post-HSCT, median (range), U | 9.5 (1-36) | 4 (0-10) | <.0001 | 6 (0-18) | 7 (0-20) | .35 | <.0001 |
| Transfusion of RBC post-HSCT, median (range), U | 8 (0-20) | 4 (0-12) | <.0001 | 2 (0-22) | 4 (0-18) | .77 | .04 |
The characteristics of allotransplant patients with BM EC < 0.1% or EC ≥ 0.1% pre-HSCT enrolled in the 2 clinical trials (NCT02978274 and NCT03236220) are shown in the table. The first trial included 2 groups of patients with 1EC < 0.1% (N = 30) and 1EC ≥ 0.1% (N = 38) enrolled from March 2016 to March 2017. The second trial included 2 groups of patients with 2EC < 0.1% + NAC (N = 35) and 2EC ≥ 0.1% (N = 39) enrolled from August 2017 to June 2018. The continuous variables were compared using the Mann-Whitney U test, and the differences in frequency between the 2 groups were compared using the χ2 test. The criterion for statistical significance was P < .05.
ALL, acute lymphocytic leukemia; AML, acute myelogenous leukemia; ATG, antithymocyte globulin; BU/CY, busulfan/cyclophosphamide; Hb, hemoglobin; PB, peripheral blood; PLT, platelet; RBC, red blood count; TMA, thrombotic microangiopathy; WBC, white blood cell.
The P values present the comparison between the 1EC < 0.1% (N = 30) and 1EC ≥ 0.1% (N = 38) groups.
The P values present the comparison between the 2EC < 0.1% + NAC (N = 35) and 2EC ≥ 0.1% (N = 39) groups.
The P values present the comparison between the 1EC < 0.1% (N = 30) and 2EC < 0.1% + NAC (N = 35) groups.
Significantly increased cumulative incidence of PGF and PT in the EC < 0.1% group
There were 12 cases with PGF and PT in the EC < 0.1% group (N = 30) compared with 3 cases in the EC ≥ 0.1% group (N = 38) in the first trial. A significantly higher cumulative incidence of PGF and PT at +2 months (Figure 2B; 38.20% to 41.80% vs 7.01% to 8.77%; P = .002) and lower cumulative incidence of platelet engraftment (Figure 2C; 61.56% to 65.10% vs 88.43% to 90.51%; P = .003) and neutrophil engraftment post-HSCT (Figure 2D; 100% vs 100%; P = .04) were observed in the EC < 0.1% group compared with the EC ≥ 0.1% group. With a median follow-up of 21 months (1.5-28 months), the significantly higher cumulative incidence of NRM (Figure 2E; 44.85% to 48.49% vs 4.55% to 5.94%; P < .0001) and CIR (Figure 2G; 8.91% to 11.09% vs 2.11% to 3.15%; P = .02) at +24 months, along with a decreased estimated probability of DFS (Figure 2H; 28.39% to 63.05% vs 77.48% to 97.38%; P < .0001) and OS (Figure 2I; 28.39% to 63.05% vs 80.55% to 98.66%; P < .0001) at +24 months, was demonstrated in the EC < 0.1% group compared with the EC ≥ 0.1% group. Moreover, the cumulative incidence of aGVHD within 100 days post-HSCT in the EC < 0.1% group was higher than that in the EC ≥ 0.1% group (Figure 2F; 44.84% to 48.50% vs 24.89% to 27.75%; P = .11).
Impaired BM ECs pre-HSCT and their defective dynamic reconstitution at early time points post-HSCT were observed in the EC < 0.1% group
As shown in supplemental Figure 2, the percentages of BM ECs in the EC < 0.1% group were markedly reduced at −14 days pre-HSCT and +1 month and +2 months post-HSCT compared with those in the EC ≥ 0.1% group. In contrast, elevated ROS levels of BM ECs were observed in the EC < 0.1 group at −14 days pre-HSCT and +1 month and +2 months post-HSCT compared with those in the EC ≥ 0.1% group.
Defective dynamic reconstitution of CD34+ cells post-HSCT was demonstrated in the EC < 0.1% group
As shown in supplemental Figure 2, remarkably reduced percentages of BM CD34+ cells were found post-HSCT in the EC < 0.1% group compared with the EC ≥ 0.1% group. Significantly higher levels of ROS were detected in BM CD34+ cells post-HSCT in the EC < 0.1% group compared with the EC ≥ 0.1% group.
Reduced percentages of BM ECs and CD34+ cells were significantly correlated with their elevated ROS levels
As shown in supplemental Figure 3, inverse correlations were found between the percentages of BM ECs and their ROS levels pre-HSCT and post-HSCT. Moreover, the percentages of BM CD34+ cells were inversely correlated with their ROS levels post-HSCT.
Prophylactic NAC intervention improved the quantity of BM ECs and their ROS levels in the EC < 0.1% group
At −14 days pre-HSCT, the percentages of BM ECs were significantly lower in the EC < 0.1% group than in the EC ≥ 0.1% group (Figure 3A; 0.05% ± 0.003% vs 0.23% ± 0.03%; P < .0001). Prophylactic NAC intervention from −14 days pre-HSCT to +2 months post-HSCT significantly increased BM EC percentages at +1 month (Figure 3A; 0.09% ± 0.03% vs 0.05% ± 0.003%; P = .0006) and +2 months post-HSCT (Figure 3A; 0.17% ± 0.03% vs 0.05% ± 0.003%; P = .0009) compared with their baseline levels at −14 days in the EC < 0.1% group. Furthermore, after prophylactic NAC intervention in the EC < 0.1% group, similar percentages of BM ECs were found post-HSCT between the 2 groups (Figure 3A).
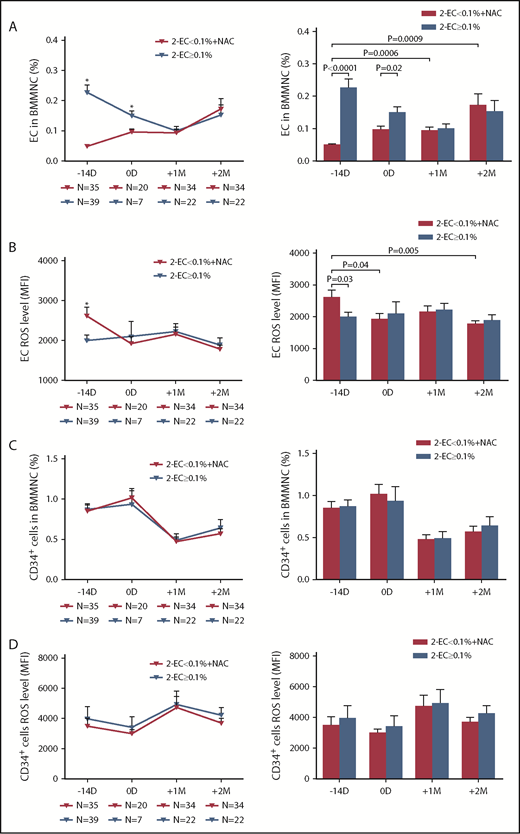
Prophylactic NAC intervention improved the quantity of BM ECs, CD34+cells, and their ROS levels in the EC < 0.1% group to levels similar to those in the EC ≥ 0.1% group post-HSCT. The dynamic reconstitution (left panel) and statistical analysis (right panel) of BM EC percentages (A), EC ROS levels (B), CD34+ cell percentages (C), and CD34+ cell ROS levels (D) were analyzed by flow cytometry in the EC < 0.1% with prophylactic NAC intervention group at −14 days and 0 days pre-HSCT and +1 month and +2 months post-HSCT relative to those in the EC ≥ 0.1% group in the second clinical trial. The data are expressed as the mean and SEM. Statistical analyses were performed using 1-way ANOVA for comparisons among the groups. Subject variables were compared using the χ2 test for categorical variables and the Mann-Whitney U test for continuous variables. P < .05 was considered statistically significant and values are provided in the figure. *P < .05.
Prophylactic NAC intervention improved the quantity of BM ECs, CD34+cells, and their ROS levels in the EC < 0.1% group to levels similar to those in the EC ≥ 0.1% group post-HSCT. The dynamic reconstitution (left panel) and statistical analysis (right panel) of BM EC percentages (A), EC ROS levels (B), CD34+ cell percentages (C), and CD34+ cell ROS levels (D) were analyzed by flow cytometry in the EC < 0.1% with prophylactic NAC intervention group at −14 days and 0 days pre-HSCT and +1 month and +2 months post-HSCT relative to those in the EC ≥ 0.1% group in the second clinical trial. The data are expressed as the mean and SEM. Statistical analyses were performed using 1-way ANOVA for comparisons among the groups. Subject variables were compared using the χ2 test for categorical variables and the Mann-Whitney U test for continuous variables. P < .05 was considered statistically significant and values are provided in the figure. *P < .05.
At −14 days pre-HSCT, the baseline ROS levels of BM ECs in the EC < 0.1% group were significantly higher than those in the EC ≥ 0.1% group (Figure 3B; 2612 ± 219.9 vs 1987 ± 152.3; P = .03). After 14 days of NAC treatment in the EC < 0.1% group, the ROS levels of BM ECs at 0 days were significantly reduced compared with their levels at −14 days pre-HSCT (Figure 3B; 1922 ± 180.8 vs 2612 ± 219.9; P = .04). NAC prophylactic intervention significantly reduced the ROS levels of BM ECs at +2 months post-HSCT compared with their baseline levels at −14 days pre-HSCT in the EC < 0.1% group (Figure 3B; 1773 ± 108.8 vs 2612 ± 219.9; P = .005). No significant differences were found in the ROS levels of BM ECs post-HSCT in the EC < 0.1% group compared with the EC ≥ 0.1% group.
Prophylactic NAC intervention improved the quantity of BM CD34+ cells and their ROS levels in the EC < 0.1% group
The percentages (Figure 3C) and ROS levels (Figure 3D) of BM CD34+ cells post-HSCT demonstrated no significant differences between the EC < 0.1% group with prophylactic NAC intervention and the EC ≥ 0.1% group. The percentages of BM CD34+ cells were positively correlated with those of BM ECs (supplemental Figure 3F).
Prophylactic NAC intervention improved the functions of BM ECs in the EC < 0.1% group
At −14 days pre-HSCT, the numbers of double-positive staining cells (Figure 4A,C; 16.86 ± 1.42 vs 54.67 ± 14.63; P = .02) and migrated cells (Figure 4B,D; 26.39 ± 3.3 vs 68.78 ± 11.75; P = .002) were significantly lower in the EC < 0.1% group than in the EC ≥ 0.1% group. After prophylactic NAC intervention in the EC < 0.1% group, the numbers of double-positive staining cells at 0 days pre-HSCT (Figure 4A,C; 39.5 ± 9.6 vs 16.86 ± 1.42; P = .03) and +2 months post-HSCT (Figure 4A,C; 90.72 ± 16.1 vs 16.86 ± 1.42; P = .002) were significantly increased compared with their baseline levels at −14 days pre-HSCT. Prophylactic NAC intervention in the EC < 0.1% group significantly improved the migratory capability of BM ECs at +2 months compared with those at −14 days pre-HSCT (Figure 4B,D; 74.22 ± 19.34 vs 26.39 ± 3.3; P = .02).
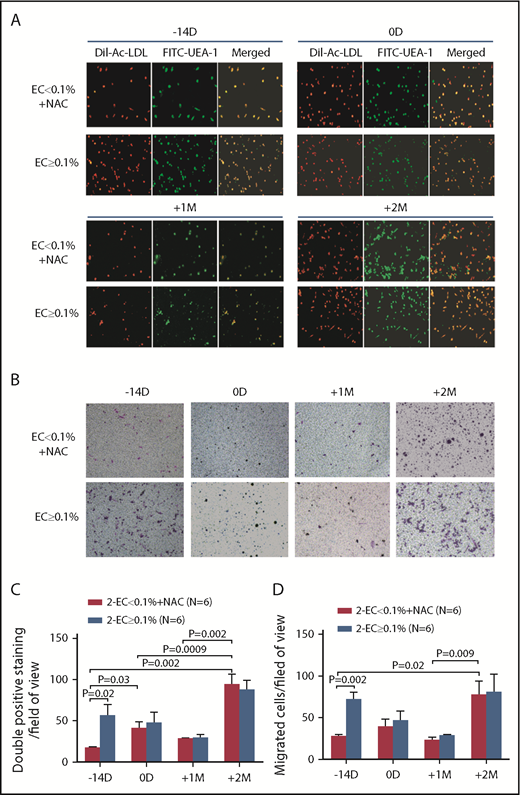
Prophylactic NAC intervention improved the function of BM ECs in the EC < 0.1% group to levels similar to those in the EC ≥ 0.1% group post-HSCT. Representative images of typical BM ECs characterized by double-positive staining (merged in yellow) of both DiI-AcLDL (red) and FITC-UEA-1 (green) (A; original magnification ×4) and transwell migration assays of cultivated BM ECs at day 7 in culture (B; original magnification ×10). The migrated cells (purple) were stained with crystal violet. Quantification of BM double-positive staining cells (C) and EC migration (D) per field of view were compared at −14 days and 0 days pre-HSCT and +1 month and +2 months post-HSCT between the EC < 0.1% with prophylactic NAC intervention group and the EC ≥ 0.1% group. The cells in 3 random fields were counted and averaged. The data are expressed as the mean and SEM. Statistical analyses were performed using 1-way ANOVA for comparisons among the groups. Subject variables were compared using the χ2 test for categorical variables and the Mann-Whitney U test for continuous variables. P < .05 was considered statistically significant and values are provided in the figure.
Prophylactic NAC intervention improved the function of BM ECs in the EC < 0.1% group to levels similar to those in the EC ≥ 0.1% group post-HSCT. Representative images of typical BM ECs characterized by double-positive staining (merged in yellow) of both DiI-AcLDL (red) and FITC-UEA-1 (green) (A; original magnification ×4) and transwell migration assays of cultivated BM ECs at day 7 in culture (B; original magnification ×10). The migrated cells (purple) were stained with crystal violet. Quantification of BM double-positive staining cells (C) and EC migration (D) per field of view were compared at −14 days and 0 days pre-HSCT and +1 month and +2 months post-HSCT between the EC < 0.1% with prophylactic NAC intervention group and the EC ≥ 0.1% group. The cells in 3 random fields were counted and averaged. The data are expressed as the mean and SEM. Statistical analyses were performed using 1-way ANOVA for comparisons among the groups. Subject variables were compared using the χ2 test for categorical variables and the Mann-Whitney U test for continuous variables. P < .05 was considered statistically significant and values are provided in the figure.
Prophylactic NAC intervention improved the dynamic reconstitution of BM EPCs in the EC < 0.1% group
The percentages of BM EPCs in the EC < 0.1% group were markedly reduced at −14 days pre-HSCT (Figure 5B; 0.03% ± 0.004% vs 0.08% ± 0.01%; P = .002) compared with those in the EC ≥ 0.1% group. By contrast, elevated ROS levels of BM EPCs were observed in the EC < 0.1 group at −14 days pre-HSCT (Figure 5C; 2919 ± 307.3 vs 2025 ± 181.8; P = .04) compared with those in the EC ≥ 0.1% group.
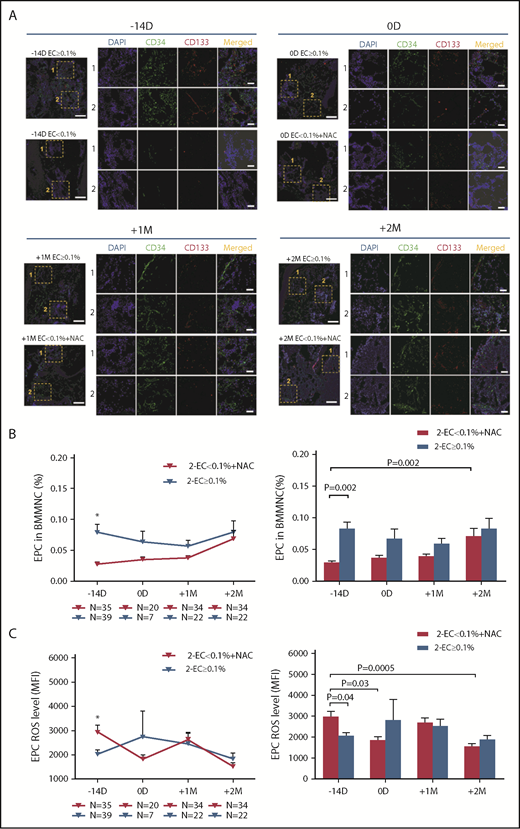
Prophylactic NAC intervention improved the dynamic reconstitution of BM EPCs in the EC < 0.1% group to similar levels relative to those in the EC ≥ 0.1% group. (A) Immunofluorescence staining of EPCs in BM trephine biopsies. Mouse anti-human CD34 (green) and rabbit anti-human CD133 (red) were incubated to identify the BM EPCs. 4′,6-Diamidino-2-phenylindole (DAPI; blue) was used to stain the nucleus. In situ histological analyses of BM trephine biopsies showed the dynamic reconstitution of double-positive (merged in yellow) CD34 (green)- and CD133 (red)-stained EPCs pre- and post-HSCT between the 2 groups of patients (scale bars represent 50 μm). The dynamic reconstitution (left panel) and statistical analyses (right panel) of BM EPC percentages (B) and EPC ROS levels (C) were analyzed by flow cytometry in the EC < 0.1% with prophylactic NAC intervention group at −14 days and 0 days pre-HSCT and +1 month and +2 months post-HSCT relative to the EC ≥ 0.1% group in the second clinical trial. The data are expressed as the mean and SEM. Statistical analyses were performed using 1-way ANOVA for comparisons among the groups. Subject variables were compared using the χ2 test for categorical variables and the Mann-Whitney U test for continuous variables. P < .05 was considered statistically significant and values are provided in the figure. *P < .05.
Prophylactic NAC intervention improved the dynamic reconstitution of BM EPCs in the EC < 0.1% group to similar levels relative to those in the EC ≥ 0.1% group. (A) Immunofluorescence staining of EPCs in BM trephine biopsies. Mouse anti-human CD34 (green) and rabbit anti-human CD133 (red) were incubated to identify the BM EPCs. 4′,6-Diamidino-2-phenylindole (DAPI; blue) was used to stain the nucleus. In situ histological analyses of BM trephine biopsies showed the dynamic reconstitution of double-positive (merged in yellow) CD34 (green)- and CD133 (red)-stained EPCs pre- and post-HSCT between the 2 groups of patients (scale bars represent 50 μm). The dynamic reconstitution (left panel) and statistical analyses (right panel) of BM EPC percentages (B) and EPC ROS levels (C) were analyzed by flow cytometry in the EC < 0.1% with prophylactic NAC intervention group at −14 days and 0 days pre-HSCT and +1 month and +2 months post-HSCT relative to the EC ≥ 0.1% group in the second clinical trial. The data are expressed as the mean and SEM. Statistical analyses were performed using 1-way ANOVA for comparisons among the groups. Subject variables were compared using the χ2 test for categorical variables and the Mann-Whitney U test for continuous variables. P < .05 was considered statistically significant and values are provided in the figure. *P < .05.
Prophylactic NAC intervention significantly increased the BM EPC percentages at +2 months post-HSCT compared with the baseline levels before NAC treatment pre-HSCT (Figure 5B; 0.07% ± 0.01% vs 0.03% ± 0.004%; P = .002). The ROS levels of BM EPCs at 0 days were significantly reduced compared with their baseline levels pre-HSCT (Figure 5C; 1811 ± 199.9 vs 2919 ± 307.3; P = .03). NAC prophylactic intervention significantly reduced the ROS levels of BM EPCs at +2 months post-HSCT compared with their baseline levels at −14 days pre-HSCT in the EC < 0.1% group (Figure 5C; 1522 ± 155.8 vs 2919 ± 307.3; P = .0005).
Consistent with the flow cytometry data, in situ histological analyses of the BM trephine biopsies revealed reduced BM EPCs pre-HSCT in the EC < 0.1% group, and the dynamics of BM EPCs improved to levels similar to those in the EC ≥ 0.1% group post-HSCT (Figure 5A).
Prophylactic NAC intervention reduced the incidence of PGF and PT in the EC < 0.1% group
All EC < 0.1% patients (N = 35) who were enrolled to receive the oral NAC treatment completed NAC treatment without apparent NAC-associated adverse effects. As shown in supplemental Figure 4, no significant differences were observed in the cumulative incidences of PGF and PT at +2 months, platelet engraftment, neutrophil engraftment post-HSCT, NRM, aGVHD, and relapse at +10 months between the EC < 0.1% with prophylactic NAC intervention group and the EC ≥ 0.1% group. Moreover, similar estimated probabilities of DFS and OS at +10 months were observed between the EC < 0.1% with the prophylactic NAC intervention group and the EC ≥ 0.1% group.
Prophylactic NAC intervention reduced the incidence of PGF and PT in the EC < 0.1% group by improving the defective BM ECs
As shown in Table 1, none of the demographic and clinical characteristics, such as HCT-CI pretransplant, the preceding aGVHD and its treatment, thrombotic microangiopathy, CMV infection and its treatment, showed significant differences among the 4 groups of patients. Patients included in the 2 trials satisfied the same inclusion criteria. Thus, the results of the 2 trials were compared. Prophylactic NAC intervention significantly reduced the median G-CSF administration post-HSCT (3700 μg vs 5012 μg; P = .008), transfusion of platelets (6 U vs 9.5 U; P < .0001) or red blood cells (2 U vs 8 U; P = .04) post-HSCT compared with historical low EC controls (Table 1). Prophylactic NAC intervention significantly reduced the cumulative incidences of PGF and PT at +2 months (Figure 6A; 7.63% to 9.51% vs 38.20% to 41.80%; P = .0005) and NRM at +10 months (Figure 6E; 0% vs 45.96% to 47.38%; P < .0001), but increased the cumulative incidences of platelet engraftment (Figure 6B; 96.49% to 97.79% vs 61.56% to 65.10%; P = .003), neutrophil engraftment (Figure 6C; 95% confidence interval, 100% vs 100%; P = .03) at +2 months and the estimated probability of OS at +10 months (Figure 6F; 100% vs 28.39% to 63.05%; P < .0001) post-HSCT in the EC < 0.1% group of the second trial compared with EC < 0.1% in the first trial.
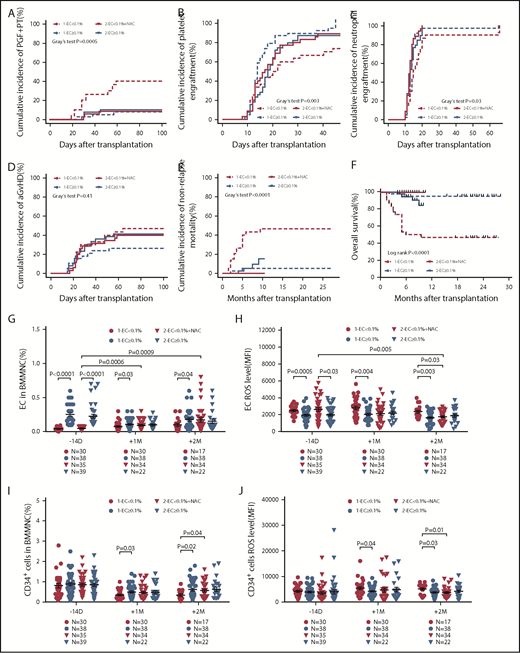
Prophylactic NAC intervention reduced the incidence of PGF and PT in the EC < 0.1% group by improving defective BM ECs. The cumulative incidence of PGF and PT at +2 months (A), platelet engraftment (B), neutrophil engraftment (C), and aGVHD (D) within 100 days post-HSCT, NRM (E) and estimated OS (F) at +10 months post-HSCT, as well as the dynamic reconstitution of BM EC percentages (G), EC ROS levels (H), CD34+ cell percentages (I), and CD34+ cell ROS levels (J) were compared between the EC < 0.1% group and the EC ≥ 0.1% group in the first clinical trial and the EC < 0.1% with prophylactic NAC intervention group and the EC ≥ 0.1% group in the second clinical trial. Cumulative incidence curves were analyzed using a competing risk setting and were compared using the Gray test. Probabilities of OS were estimated with the Kaplan-Meier method and were compared using the log-rank test. The data are expressed as the mean and SEM. P < .05 was considered statistically significant and values are provided in the figure.
Prophylactic NAC intervention reduced the incidence of PGF and PT in the EC < 0.1% group by improving defective BM ECs. The cumulative incidence of PGF and PT at +2 months (A), platelet engraftment (B), neutrophil engraftment (C), and aGVHD (D) within 100 days post-HSCT, NRM (E) and estimated OS (F) at +10 months post-HSCT, as well as the dynamic reconstitution of BM EC percentages (G), EC ROS levels (H), CD34+ cell percentages (I), and CD34+ cell ROS levels (J) were compared between the EC < 0.1% group and the EC ≥ 0.1% group in the first clinical trial and the EC < 0.1% with prophylactic NAC intervention group and the EC ≥ 0.1% group in the second clinical trial. Cumulative incidence curves were analyzed using a competing risk setting and were compared using the Gray test. Probabilities of OS were estimated with the Kaplan-Meier method and were compared using the log-rank test. The data are expressed as the mean and SEM. P < .05 was considered statistically significant and values are provided in the figure.
Prophylactic NAC intervention in the EC < 0.1% group improved the percentages of BM ECs (Figure 6G; 0.17% ± 0.03% vs 0.10% ± 0.02%; P = .25) and reduced the ROS levels of BM ECs (Figure 6H; 1773 ± 108.8 vs 2360 ± 184.8; P = .03) at +2 months post-HSCT compared with those in the EC < 0.1% group without NAC treatment. Meanwhile, increased percentages (Figure 6I; 0.61% ± 0.09% vs 0.34% ± 0.06%; P = .04) and reduced ROS levels (Figure 6J; 3681 ± 337.7 vs 5135 ± 495.9; P = .01) of BM CD34+ cells were observed between the 2 EC < 0.1% groups with or without prophylactic NAC intervention.
Discussion
The current study is the first to demonstrate that defective BM ECs pre-HSCT may contribute to the occurrence of PGF and PT post-HSCT. Multivariate analyses demonstrated that BM EC < 0.1% pre-HSCT is an independent risk factor for the occurrence of PGF and PT. Moreover, prophylactic NAC intervention could reduce the incidence of PGF and PT in the BM EC < 0.1% group by improving the quantity and function of BM ECs, which further showed that the impaired BM ECs pre-HSCT are responsible for defective hematopoiesis after allo-HSCT.
BM ECs play a crucial role in regulating hematopoiesis and megakaryocytopoiesis in the BM microenvironment.15-19,39 We previously reported that PGF and PT patients had impaired BM ECs post-HSCT.1,2,4,6,8 In the current study, although similar numbers of donor CD34+ cells were transplanted, significantly reduced percentages of BM CD34+ cells were found in PGF and PT patients post-HSCT. Moreover, we observed defective BM ECs pre-HSCT and impaired BM EC dynamic reconstitution at early time points post-HSCT, which was positively correlated with their ROS levels. It is conceivable that some patients with high-risk disease and some pretransplant events, such as cumulative toxicity and prior infection, may have defective BM ECs pre-HSCT. Consistent with the host origin of BM stromal cells and BM-derived mesenchymal stem cells, BM ECs predominantly originate from the recipient genotype.40,41 Consequently, the impaired BM ECs pre-HSCT are responsible for the occurrence of PGF and PT by hampering hematopoietic recovery of the successfully engrafted donor HSCs post-HSCT.
Considering the crucial role of BM ECs in supporting hematopoiesis,15-19 Salter et al reported that direct infusion of ECs promoted HSC reconstitution in mice.42 However, the low number of ECs in circulation limited the application of EC infusion in humans. By contrast, the current study demonstrated for the first time that prophylactic NAC intervention was safe and effective in preventing the occurrence of PGF and PT by repairing BM ECs. Indeed, prophylactic NAC intervention promoted the dynamic reconstitution of BM ECs, immature EPCs, and CD34+ cells, while reducing their ROS levels in the EC < 0.1% group to levels similar to those in the EC ≥ 0.1% group post-HSCT, which was further confirmed by in situ BM trephine biopsies analyses. Therefore, our data provided further evidence that the impaired BM ECs pre-HSCT are strongly associated with the occurrence of PGF and PT after allo-HSCT, but the possibility of confounding in its association with PGF and PT cannot be excluded. Consistent with the current study, we recently reported that oral NAC is a beneficial treatment option to improve megakaryocytopoiesis by bolstering the defective BM ECs in patients with PT6 or corticosteroid-resistant immune thrombocytopenia.33 Therefore, improvement of BM ECs may be a promising therapeutic approach to promote hematopoietic reconstitution not only in PGF and PT patients but also in corticosteroid-resistant immune thrombocytopenia patients and even patients with BM failure diseases.
We are aware, however, that whether the incidence of EC < 0.1% in the first trial is typical or a little high due to the enrolled patients in the study requires further clarification. Moreover, the pathogenesis of PGF and PT is complicated, and the underlying molecular mechanisms need to be further explored. It should be noted that the high incidence of NRM in the EC < 0.1% group of the first cohort is mainly due to deaths from infection (30%) due to neutropenia. The incidence of GVHD-related mortality (3.33%) in the EC < 0.1% group is consistent with our previous report (2.26%),43 which might be related to the specific intensive immunosuppression protocol for haplo-HSCT. We described for the first time a convenient and effective oral NAC as a novel prophylactic approach for PGF and PT patients, which provided a rationale for further prospective randomized clinical trials to validate our preliminary findings in the future.
In summary, BM EC < 0.1% pre-HSCT can be used to identify patients at high risk for the occurrence of PGF and PT post-HSCT. Prophylactic NAC intervention was safe and effective in preventing the occurrence of PGF and PT by repairing the impaired BM ECs. Although requiring validation, our data indicate that impaired BM ECs pre-HSCT are responsible for the defective hematopoiesis in PGF and PT patients. Therefore, improvement of BM ECs through prophylactic NAC intervention may represent a promising therapeutic approach to promote hematopoietic reconstitution post-HSCT.
The full-text version of this article contains a data supplement.
Acknowledgments
The authors thank all of the core facilities at Peking University Institute of Hematology for patient care and sample collection, and Cai-Wen Duan from the School of Medicine, Shanghai Jiao Tong University, for excellent assistance with the immunofluorescent staining. American Journal Experts (www.journalexperts.com) provided editorial assistance to the authors during the preparation of the manuscript.
This work was supported by the National Key Research and Development Program (2017YFA0104500), National Natural Science Foundation of China (grants 81870139, 81570127, and 81530046), the Foundation for Innovative Research Groups of the National Natural Science Foundation of China (81621001), Clinical Medicine Plus X–Young Scholars Project of Peking University (PKU2019LCXQ016), and the Science and Technology Project of Guangdong Province of China (2016B030230003).
Authorship
Contribution: X.-J.H. and Y.K. designed the study and supervised the manuscript preparation; Y.K., Y.W., and M.-M.S. performed the research, analyzed the data, and wrote the manuscript; Y.-Y.Z., X.-D.M., Y.-Q.S., Y.-J.C., L.-P.X., X.-H.Z., and K.-Y.L. participated in the collection of patient data; and all of the authors agreed to submit the final manuscript.
Conflict-of-interest disclosure: The authors declare no competing financial interests.
Correspondence: Xiao-Jun Huang, Peking University People's Hospital, Peking University Institute of Hematology, 11 Xizhimen South St, Beijing 100044, China; e-mail: xjhrm@medmail.com.cn.

