

Key Points
A novel syngeneic murine glioma model resembles human gliomas with respect to PDPN expression and intratumoral platelet aggregation.
Deletion of PDPN in glioma cells, but not in astrocytes, results in a significant reduction of intratumoral platelet aggregates.

Abstract
Binding of the sialomucin-like transmembrane glycoprotein podoplanin (PDPN) to the platelet receptor C-type lectin-like receptor 2 induces platelet activation and aggregation. In human high-grade gliomas, PDPN is highly expressed both in tumor cells and in tumor-associated astrocytes. In glioma patients, high expression of PDPN is associated with worse prognosis and has been shown to correlate with intratumoral platelet aggregation and an increased risk of venous thromboembolism (VTE). To functionally assess the role of PDPN in platelet aggregation in vivo, we established a syngeneic orthotopic murine glioma model in C57/Bl6 mice, based on transplantation of p53- and Pten-deficient neural stem cells. This model is characterized by the presence of intratumoral platelet aggregates and by the upregulation of PDPN both in glioma cells and in astrocytes, reflecting the characteristics of human gliomas. Deletion of PDPN either in tumor cells or in astrocytes resulted in glioma formation with similar penetrance and grade compared with control mice. Importantly, only the lack of PDPN in tumor cells, but not in astrocytes, caused a significant reduction in intratumoral platelet aggregates, whereas in vitro, both cell types have similar platelet aggregation-inducing capacities. Our results demonstrate a causative link between PDPN and platelet aggregation in gliomas and pinpoint the tumor cells as the major players in PDPN-induced platelet aggregation. Our data indicate that blocking PDPN specifically on tumor cells could represent a novel strategy to prevent platelet aggregation and thereby reduce the risk of VTE in glioma patients.
Introduction
Under physiological conditions the sialomucin-like transmembrane glycoprotein podoplanin (PDPN) is expressed in various cell types including kidney podocytes, lymphatic endothelial cells, fibroblastic reticular cells of lymphoid organs, and alveolar type I epithelial cells.1 In the brain, PDPN is present in the ependymal cells that line the lateral ventricles (LVs), in neural stem cells (NSCs), and in the choroid plexus.2,3 In glioblastoma multiforme (GBM), an aggressive type of gliomas that arises from glial cells or their precursors, we showed that PDPN expression is negatively regulated by PTEN and its expression correlates with bad prognosis.2 Interestingly, PDPN expression in GBM is also observed in the tumor microenvironment, mainly in reactive astrocytes, although its function in these cells is still elusive.4
The main known function of PDPN under physiological conditions is to induce platelet activation and aggregation via the binding to the platelet receptor C-type lectin-like receptor 2 (CLEC2).5 During embryogenesis, PDPN-mediated platelet aggregation is important for the proper separation of the blood-lymphatic vascular system.6
In tumors, PDPN has been associated with cell invasion, migration, and epithelial-mesenchymal transition, mainly via its ability to activate the ezrin-radixin-moesin protein complex and RhoA.7 Moreover, PDPN expressed on tumor cells has also the capacity to induce platelet aggregation; this process has been shown to play a role in tumor growth and metastasis by promoting the release of platelet-derived growth factors.8 In a murine glioma model, treatment with an antibody against PDPN lead to tumor growth delay and to a better survival.9
Recently, Riedl et al showed that increased expression of PDPN in human glioma specimens is associated with intratumoral platelet aggregates and with an augmented risk of venous thromboembolism (VTE) and mortality.10 VTE is a clinical condition frequently associated with cancer, GBM patients have an especially high risk of developing VTE throughout the course of disease, with an 18% risk of symptomatic events per year.11,12 Other tumor entities, such as pancreatic and ovarian cancers, also have a high incidence of VTE13 ; however, the mechanisms through which tumor cells promote platelet aggregation is yet not fully understood.
In light of the association between PDPN expression with intratumoral platelet aggregates and the development of VTE, we functionally assessed the contribution of PDPN to platelet aggregation in glioma. We established a novel orthotopic murine glioma model characterized by intratumoral platelet aggregates and PDPN overexpression both in tumor cells and in reactive astrocytes. Using cell type–specific deletion of PDPN, we show that PDPN in glioma cells, but not in astrocytes, is required for platelet aggregation.
Methods
Animals
Tamoxifen-inducible Cre recombinase (orphan nuclear receptor tailless [Tlx]-CreERT2) mice14 were crossed with mice carrying pten- and p53-flox alleles (Jackson Laboratory) to obtain Tlx-CreERT2/p53-floxed/pten-floxed (double knockout [DKO]) mice. DKO mice were crossed with Pdpn-flox mice15 to obtain Tlx-CreERT2/p53-floxed/pten-floxed/Pdpn-floxed (triple knockout [TKO]) mice. To induce recombination of floxed alleles, 4-week-old mice were injected intraperitoneally with 1 mg tamoxifen (S5007 Sigma) in 5% ethanol and 95% oil (T5648 Sigma) for 5 consecutive days. GFAP-Cre mice, Tg(Gfap-cre)73.12Mvs, described previously16 (a kind gift of Hermann-Josef Gröne, DKFZ, Heidelberg, Germany), were crossed with Pdpn-flox mice15 to obtain GFAP-Cre/Pdpn-floxed (AstroPDPN-KO) mice. Animal experiments were approved by the German responsible authority (Regierungspräsidium Karlsruhe) and performed in conformity with the German law for Animal Protection (animal license number: G-156/15, G-199/11).
Cell isolation
NSCs were isolated from the subventricular zone (SVZ) of mice 2 weeks after the injection of either tamoxifen or oil according to Guo et al.17 For tumor cell isolation, glioma-bearing mice were euthanized with carbon dioxide; brains were minced and dissociated in Leibovitz-L15 (Life Technologies) containing 10 U/mL papain, 5 mM EDTA, and 200 U/mL DNAse. Cells were grown according to Guo et al.17
Flow cytometry and sorting of glioma cells
Murine glioma single cells were resuspended in phosphate-buffered saline/1% bovine serum albumin (BSA), stained for 20 minutes with antipodoplanin or with an isotype control (Cat.127409 and 402012, respectively; BioLegend), and analyzed by flow cytometry (FACSCalibur, BD). To obtain pure PDPN− NSC from TKO mice (TKO-NSC) population, cells were stained with antipodoplanin (catalog no. 127409, BioLegend), the PDPN− fraction (TKOPdpn neg-NSC) was sorted with a fluorescence-activated cell sorter (FACS) Aria I (Beckton Dickinson).
Intracranial injections
Mice were anesthetized with isoflurane and placed on a stereotaxic frame. A total of 5 × 10⁵ cells in 2 µL phosphate-buffered saline were injected 2 mm lateral (right) to the bregma and 3 mm deep at a flow of 0.2 µL/min using a 10-µL precision microsyringe (World Precision Instruments, Inc) with a 34G needle.
Image acquisition and quantification
Pictures were captured with Zeiss Axio-Scan.Z1 using ZEN software (Zeiss) or with the MEA53100 Eclipse Ti-E inverted microscope (Nikon) using MQS31000 NIS-ELEMENTS AR software (Nikon) with camera MQA11550 DS-Qi1MC for bright field images and MQA11010 DS-Fi1 for immunofluorescent images. For quantification of CD61, CD31, and CD41+ tumor area, we used the Image J software. For CD61 and laminin immunohistochemical staining, we determined the tumor area on each section by counterstaining with hematoxylin; the software automatically detected and calculated the areas of the tumor in which brown staining (from DAB) for CD61 or laminin was present. For CD31 and CD41 immunofluorescence staining, we determined the tumor area on each section by staining with 4′,6-diamidino-2-phenylindole (DAPI); the software automatically detected and calculated the areas of the tumor in which CD31 (Alexa Fluor 546) or CD41 (Alexa Fluor 488) staining was present. For each staining, the result is given as the ratio between the sum of all the areas positive for a determined staining within the selected tumor area and the total area of the tumor. Each tumor-bearing brain was entirely sliced in sections and, for each tumor, 5 coronal sections were chosen to represent the whole glioma, stained and quantified. On average, we took 1 section every 20 to 24 sections that were cut.
Immunohistochemistry and immunofluorescence staining
Formalin fixed paraffin-embedded sections (5 µm) were stained as described previously,2 using the following primary antibodies: Syrian hamster anti-PDPN 8.1.1 (Developmental Studies Hybridoma Bank), rabbit anti-Ki67 (ab15580, Abcam), rabbit anti-OLIG2 (ab109186, Abcam), mouse anti-GFAP (644701, BioLegend), rabbit anti-CD61 (18309-1-AP, Proteintech), and rabbit anti-laminin (10765, PROGEN). Secondary antibodies to detect PDPN were: goat anti-Syrian hamster Alexa Fluor 488 (107-545-142) and goat anti-Syrian hamster Alexa Fluor 647 (107-606-142), both from dianova. Goat anti-mouse Alexa Fluor 555 (A21422, Thermo Fischer Scientific) was used to detect GFAP. For immunohistochemistry, the biotinylated goat anti-rabbit immunoglobulin-G (BA1000) were used together with DAB peroxidase (horseradish peroxidase) substrate kit (SK-4100), both from Vector Laboratories. Cryosections (8 µm) were fixed with 4% paraformaldehyde, permeabilized with 0.1% Triton X-100, blocked with 1% BSA and 10% of goat serum, and incubated overnight with the following primary antibodies: rabbit anti-CD31 (ab92547), rat anti-CD41 (ab33661; both from Abcam) and rat anti-CD62P (550289, BD Biosciences). Secondary antibodies were: goat anti-rabbit Alexa Fluor 546 (A11071) and goat anti-rat Alexa Fluor 488 (A11006; both from Thermo Fischer Scientific). Immunofluorescence staining of isolated NSCs was performed with rabbit anti-nestin N5413 (Sigma) and the secondary antibody was goat anti-rabbit Alexa Fluor 546 (A11071, Thermo Fischer Scientific).
Oligos
Primers for genotyping PDPN alleles were described previously.15
Platelet aggregation assay
Platelet‐rich plasma (PRP) was obtained from blood donated by healthy donors, harvested in citrate buffer tubes (BD Vacutainer 9NC-367704, BD), and centrifuged at 150g for 15 minutes. Platelet‐poor plasma (PPP) was obtained from PRP after centrifugation at 1500g for 5 minutes. A total of 150 μL of either NSCs isolated from DKO mice 2 weeks after tamoxifen injection (DKO-NSCs) or TKOPdpn neg-NSCs at a concentration of 2 × 10⁶cells/mL was added to 600 μL of PRP or PPP and mixed on a roller mixer. At different time points, 150 µL of PRP (PRPabs) and PPP (PPPabs), compared with PRP mixed with either DKO-NSCs or TKOPdpn neg-NSCs was loaded on a 96-well plate, and light absorbance (or turbidity) at 540 nm was analyzed using a microplate reader (CLARIOstar). In general, because the absorbance of PRP decreases on platelet aggregation, PPP was used as a background control for absorbance (full light transmission). The effect of DKO-NSCs and TKOPdpn neg-NSCs were quantified as absorbance relative to PRP, calculated as: 1 − (TKOPdpn neg-NSCs‐PPPabs)/(PRPabs‐PPPabs). Thus, a value of 100% indicates maximal platelet aggregation (equal to PPP, and thus equivalent to removing all platelets), whereas 0% indicates no aggregation.
Platelet activation
Platelet activation was done according to Shattil et al.18 Briefly, 40 µL of whole blood was mixed with 460 µL of N-2-hydroxyethylpiperazine-N′-2-ethanesulfonic acid buffer containing NaCl 137 mM, KCl 2.7 mM, MgCl2 1 mM, glucose 5.6 mM, BSA 1 mg/mL, and N-2-hydroxyethylpiperazine-N′-2-ethanesulfonic acid 20 mM. One microliter each of CD41-APC, CD62P-FITC, or PAC1-FITC antibodies (catalog nos. 303709, 304903, and 362803, respectively; BioLegend) was added to the mix before admixing with 2 × 10⁶ glioma cells. After 20 minutes at room temperature with mild shaking, the samples were analyzed by flow cytometry (FACSCalibur, BD).
Blood platelet count
At the time of euthanasia (as soon as the animals displayed termination criteria), the blood of tumor-bearing mice was taken by intracardiac puncture, diluted with citrate phosphate dextrose solution (C7165-50ML Sigma), and subsequently analyzed with Hemavet950 analyzer (Drew Scientific). Human blood was obtained from healthy volunteers after informed consent, in accordance with the Declaration of Helsinki.
Results
We generated a novel genetic glioma model in which NSC-specific deletion of Pten- and p53-floxed alleles is achieved by CreERT2 fusion protein19 under control of the Tlx promoter (Tlx-CreERT2/p53-floxed/pten-floxed mice). Tlx gene regulatory sequences drive the expression of CreERT2 in NSC/progenitor cells in the adult brain. Thus, pten and p53 (DKO mice) are deleted specifically in the NSC compartment on tamoxifen injection in adult mice.14 DKO mice developed tumors that, according to histopathological features such as microvascular proliferation, necrotic areas, and pseudopalisades (Figure 1A), were classified as high-grade gliomas. The tumors were positive for established glioma markers such as GFAP (supplemental Figure 1A), OLIG2 (Figure 1B, left), and proliferation marker Ki67 (Figure 1B, right), demonstrating that the histological and molecular characteristics resemble those of human high-grade gliomas. Moreover, similar to human samples, DKO gliomas presented intratumoral platelet aggregates (Figure 1C).
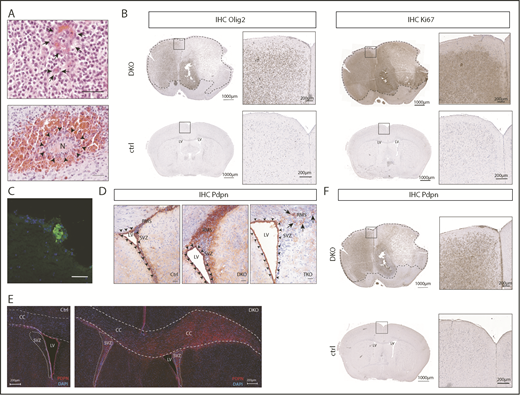
Pten and p53 deletion in neural stem cells leads to development of gliomas with high PDPN expression and intratumoral platelet aggregates. (A) Histopathological features of gliomas developed in DKO mice. Sections were stained with hematoxylin and eosin (H&E). Arrows indicate areas of microvascular proliferation. Arrowheads indicate a necrotic area (N) surrounded by hemorrhage. Scale bars, 50 µm. (B) OLIG2 and Ki67 expression (brown) in brain sections from a glioma-bearing DKO mouse and from a control (ctrl) tumor-free mouse detected by immunohistochemistry. The sections were counterstained with hematoxylin. Dotted lines show tumor mass. (C) Immunofluorescence staining of CD41 (green) of a tumor area from a DKO mouse. Cellular nuclei are stained with DAPI and pseudocolored in blue. Scale bar, 50 µm. (D) PDPN expression (red) detected by immunohistochemistry of brain sections from: ctrl, DKO, and TKO mice euthanized 2 weeks after oil injection (for control), and tamoxifen-induced transgenes recombination (for DKO and TKO). The brain sections show the SVZ of the LV and RMS. Arrowheads indicate ependymal cells. Arrows indicate areas of residual PDPN expression in TKO mice. Sections were counterstained with hematoxylin. Scale bars, 100 µm. (E) Immunofluorescence staining for PDPN of brain sections from a ctrl and DKO mouse euthanized 4 months after oil injection and tamoxifen-induced p53 and pten deletion, respectively. Cellular nuclei are stained with DAPI and pseudocolored in blue. Dashed lines show corpus callosum (CC). Dotted lines show SVZ. (F) PDPN expression (brown) in a brain section from a glioma-bearing DKO mouse and from a ctrl tumor-free mouse detected by immunohistochemistry. The sections were counterstained with hematoxylin. Dotted lines show tumor mass.
Pten and p53 deletion in neural stem cells leads to development of gliomas with high PDPN expression and intratumoral platelet aggregates. (A) Histopathological features of gliomas developed in DKO mice. Sections were stained with hematoxylin and eosin (H&E). Arrows indicate areas of microvascular proliferation. Arrowheads indicate a necrotic area (N) surrounded by hemorrhage. Scale bars, 50 µm. (B) OLIG2 and Ki67 expression (brown) in brain sections from a glioma-bearing DKO mouse and from a control (ctrl) tumor-free mouse detected by immunohistochemistry. The sections were counterstained with hematoxylin. Dotted lines show tumor mass. (C) Immunofluorescence staining of CD41 (green) of a tumor area from a DKO mouse. Cellular nuclei are stained with DAPI and pseudocolored in blue. Scale bar, 50 µm. (D) PDPN expression (red) detected by immunohistochemistry of brain sections from: ctrl, DKO, and TKO mice euthanized 2 weeks after oil injection (for control), and tamoxifen-induced transgenes recombination (for DKO and TKO). The brain sections show the SVZ of the LV and RMS. Arrowheads indicate ependymal cells. Arrows indicate areas of residual PDPN expression in TKO mice. Sections were counterstained with hematoxylin. Scale bars, 100 µm. (E) Immunofluorescence staining for PDPN of brain sections from a ctrl and DKO mouse euthanized 4 months after oil injection and tamoxifen-induced p53 and pten deletion, respectively. Cellular nuclei are stained with DAPI and pseudocolored in blue. Dashed lines show corpus callosum (CC). Dotted lines show SVZ. (F) PDPN expression (brown) in a brain section from a glioma-bearing DKO mouse and from a ctrl tumor-free mouse detected by immunohistochemistry. The sections were counterstained with hematoxylin. Dotted lines show tumor mass.
Because in human gliomas, intratumoral platelet aggregates have been found to correlate with PDPN expression levels, we determined the spatial and temporal expression pattern of PDPN in our newly established genetic model. In brain sections of Tlx-CreERT2/p53-floxed/pten-floxed mice injected with sunflower seed oil (control mice), PDPN expression, assessed by immunohistochemical analysis, was detected in NSCs that migrate from the SVZ to the olfactory bulb through the rostral migratory stream (RMS, Figure 1D) and in ependymal cells that line the LV (Figure 1D), reflecting what has been reported for PDPN under physiological conditions.2,3 Brain sections of DKO mice analyzed 2 weeks after tamoxifen injection did not show any tumor lesions yet; however, they all presented an NSC compartment expansion in the LV SVZ and in the RMS (Figure 1D). Notably, consistent with our previous finding that PDPN is negatively regulated by PTEN,2 a tumor suppressor gene frequently lost in GBM, the expanded NSCs migrating in the RMS of DKO mice 2 weeks after tamoxifen-induced Pten and p53 deletion, express high levels of PDPN (Figure 1D). FACS analysis of DKO-NSCs showed that PDPN expression is increased compared with NSCs isolated from sunflower seed oil–injected mice (supplemental Figure 1B). Both DKO-NSC and NSCs isolated from sunflower seed oil–injected mice populations were positive for the NSC and progenitor marker nestin (supplemental Figure 1C-D,F), in accordance with previous data on the isolation of multipotent NSCs from adult mice.17
The enlargement of the SVZ compared with controls and the concomitant high expression of PDPN was also evident 4 months after tamoxifen-induced p53 and Pten recombination (Figure 1E). In 25% of mice, we could additionally observe that PDPN+ NSCs populated the corpus callosum (Figure 1E), altogether indicating the presence of early malignant lesions originating from the NSCs. Consistent with this hypothesis, established tumors from DKO mice were strongly positive for PDPN (Figure 1F). These tumors developed within 8 to 24 months after tamoxifen injection and with 65% penetrance (supplemental Figure 1G).
To assess the involvement of PDPN in tumor-induced platelet aggregation, DKO mice were crossbred with Pdpn-floxed mice, yielding TKO animals (Tlx-CreERT2/p53-floxed/pten-floxed/Pdpn-floxed mice). Brain sections of TKO mice 2 weeks after tamoxifen injection revealed an SVZ expansion similar to DKO mice. Compared with DKO, PDPN expression in TKO-NSCs was markedly reduced, albeit still present in a small subpopulation, indicating incomplete deletion of PDPN (Figure 1D). Notably, in TKO mice, PDPN expression is fully retained in the ependymal cells, confirming that Tlx promoter-driven cre recombinase activity is NSC-specific (Figure 1D).
In light of the incomplete deletion of PDPN in NSCs, the long latency, and the incomplete penetrance of tumor development, we used our genetic model as the basis for generating a faster and more synchronous glioma model harboring a complete loss of PDPN to define the effect of PDPN in tumor-induced platelet aggregation.
To this end, TKO-NSC mice were isolated 2 weeks after tamoxifen injection. As with the DKO-NSCs (supplemental Figure 1D,F), TKO-NSCs were positive for the NSC and progenitor marker nestin (supplemental Figure 1E-F). As assessed by FACS analysis, >90% of the DKO-NSCs were PDPN+ (Figure 2A), whereas 30% of the TKO-NSCs were PDPN+ (Figure 2C). This fraction of PDPN+ TKO-NSCs contained both the floxed and the recombinant Pdpn alleles consistent with an incomplete recombination of the Pdpn-floxed alleles (supplemental Figure 2A). To obtain a pure population of PDPN− NSCs, the cells were subjected to sorting by flow cytometry (TKOPdpn neg-NSCs; Figure 2C). DKO-NSC and TKOPdpn neg-NSCs were orthotopically implanted in adult C57/Bl6 mice leading to glioma formation within 6 to 8 months. Consistent with the gliomas of the genetic model, established tumors were characterized by histopathological features of high-grade glioma such as microvascular proliferation and necrotic areas with surrounding hypercellular pseudopalisade zones (Figure 2B,D).
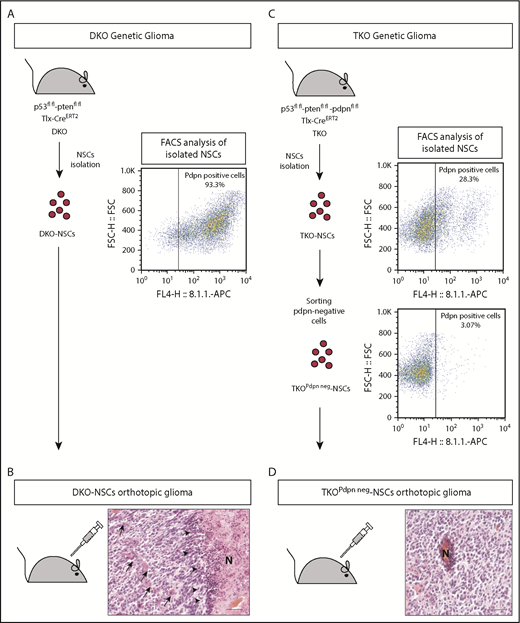
Establishment of an orthotopic glioma model to study PDPN contribution to platelet aggregation. (A) Schematic representation of the genetic and the NSC-derived DKO orthotopic glioma models. NSCs were isolated DKO mice and analyzed by FACS for PDPN expression. (B) Histopathological features of a glioblastoma developed in a mouse with orthotopic transplantation of DKO-NSCs. Arrows indicate areas of microvascular proliferation; arrowheads indicate pseudopalisades. Scale bar, 50 µm. Section was stained with H&E. (C) Schematic representation of the genetic and the NSC-derived TKO orthotopic glioma models. NSCs were isolated from TKO mice and analyzed by FACS for PDPN expression. A FACS-sorted pure population of PDPN− NSCs (TKOPdpn neg-NSC) was isolated from TKO-NSC bulk cells. (D) Histopathological features of a glioblastoma developed in a mouse with orthotopic transplantation of TKOPdpn neg-NSCs. Scale bar, 50 µm. Section was stained with H&E.
Establishment of an orthotopic glioma model to study PDPN contribution to platelet aggregation. (A) Schematic representation of the genetic and the NSC-derived DKO orthotopic glioma models. NSCs were isolated DKO mice and analyzed by FACS for PDPN expression. (B) Histopathological features of a glioblastoma developed in a mouse with orthotopic transplantation of DKO-NSCs. Arrows indicate areas of microvascular proliferation; arrowheads indicate pseudopalisades. Scale bar, 50 µm. Section was stained with H&E. (C) Schematic representation of the genetic and the NSC-derived TKO orthotopic glioma models. NSCs were isolated from TKO mice and analyzed by FACS for PDPN expression. A FACS-sorted pure population of PDPN− NSCs (TKOPdpn neg-NSC) was isolated from TKO-NSC bulk cells. (D) Histopathological features of a glioblastoma developed in a mouse with orthotopic transplantation of TKOPdpn neg-NSCs. Scale bar, 50 µm. Section was stained with H&E.
Immunostaining for human GBM markers revealed that the orthotopic gliomas were positive for GFAP (data not shown), OLIG2, and Ki67 (Figure 3A-B). Notably, immunostaining on tumors derived from TKOPdpn neg-NSCs presented with cells expressing PDPN within the tumor mass (Figure 3B, bottom). This is compatible with the notion that PDPN is also strongly upregulated in cells of the tumor microenvironment and particularly in astrocytes. To exclude any residual PDPN expression in tumor cells derived from TKOPdpn neg-NSCs, glioma cells were isolated from both TKOPdpn neg-NSC and DKO-NSC orthotopic gliomas. Immunostaining (Figure 3C) and flow cytometry (supplemental Figure 2B) showed that tumor cells from TKOPdpn neg-NSC orthotopic gliomas were negative for PDPN compared with tumor cells from the DKO-NSC model, consistent with the restriction of PDPN expression to cells of the tumor microenvironment in TKOPdpn neg-NSC–derived gliomas.
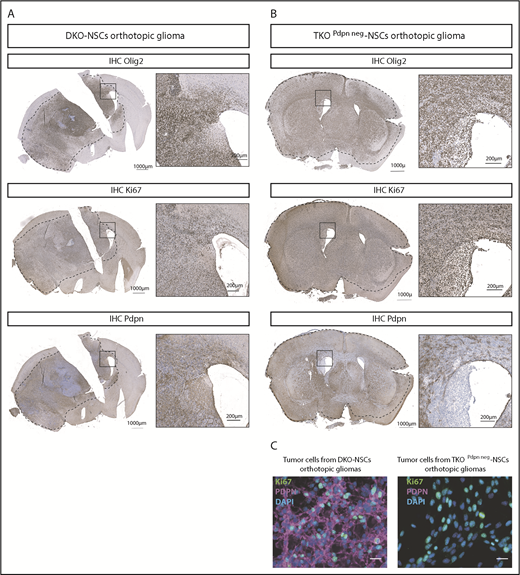
PDPN+and PDPN−orthotopic gliomas resemble human GBM features. OLIG2, Ki67, and PDPN expression (brown) in brain sections from DKO-NSCs (A) and TKOPdpn neg-NSCs (B) orthotopic gliomas detected by immunohistochemistry. The sections were counterstained with hematoxylin. (C) Immunofluorescence staining for Ki67 and PDPN of tumor cells isolated from mice transplanted orthotopically with either DKO-NSCs or TKOPdpn neg-NSCs. Cellular nuclei are stained with DAPI and pseudocolored in blue. Scale bars, 25 µm.
PDPN+and PDPN−orthotopic gliomas resemble human GBM features. OLIG2, Ki67, and PDPN expression (brown) in brain sections from DKO-NSCs (A) and TKOPdpn neg-NSCs (B) orthotopic gliomas detected by immunohistochemistry. The sections were counterstained with hematoxylin. (C) Immunofluorescence staining for Ki67 and PDPN of tumor cells isolated from mice transplanted orthotopically with either DKO-NSCs or TKOPdpn neg-NSCs. Cellular nuclei are stained with DAPI and pseudocolored in blue. Scale bars, 25 µm.
To define the impact of glioma cell–derived PDPN on platelet aggregation, CD41 (Figure 4A) and CD61 (supplemental Figure 3A) staining were performed on tumor sections from TKOPdpn neg-NSC and DKO-NSC orthotopic gliomas. Intratumoral platelet aggregates with larger foci of platelets were present in PDPN+ compared with PDPN− orthotopic tumors (Figure 4A; supplemental Figure 3A). Accordingly, quantification of the CD41+ and CD61+ areas revealed a significant reduction of platelet aggregates in PDPN-deficient tumors (Figure 4B; supplemental Figure 3B). In contrast, intratumoral vessel density was not different as assessed by CD31 (Figure 4C-D), and laminin (supplemental Figure 3C-D) staining indicating that the reduction in platelet aggregates is not attributed to decreased tumor vascularization but is a consequence of PDPN deficiency in tumor cells. Costaining for CD41 and for the endothelial marker CD31 showed that, within tumor areas, CD41+ platelets are detected within the lumen of vessels and as free aggregates within the tumor microenvironment (Figure 4A).
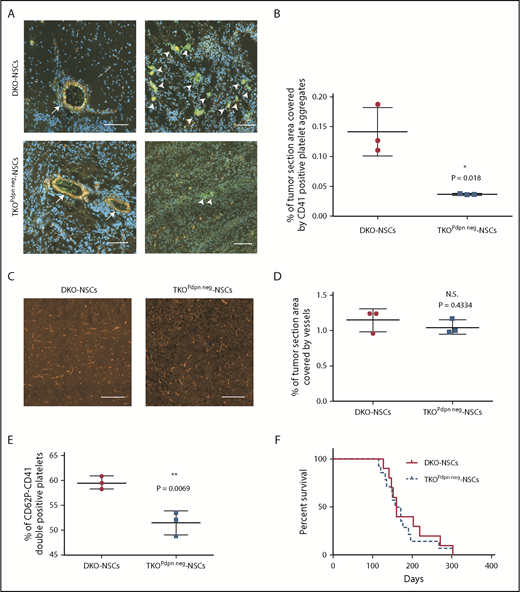
PDPN deletion in glioma cells causes reduction of intratumoral platelet aggregates. (A) Immunofluorescence staining of CD41 (green) and CD31 (red) of DKO-NSC and TKOPdpn neg-NSC orthotopic tumors. Cellular nuclei are stained with DAPI and pseudocolored in blue. Scale bars, 100 µm. Arrows indicate vessels with CD41+ platelets inside the lumen (left); arrowheads indicate CD41+ platelet aggregates within tumor microenvironment (right). (B) Quantification of the tumor area covered by CD41staining. Mean ± standard deviation shown. n = 3; statistical analysis: Student t test. (C) Representative images of DKO-NSC and TKOPdpn neg-NSC orthotopic tumors stained for CD31 (red). Scale bars, 200 µm. (D) Quantification of tumor area covered by CD31+ vessels. Mean ± standard deviation shown. n = 3; statistical analysis: Student t test. (E) In vitro platelet activation measured as CD41-CD62P++ platelets incubated with tumor cells isolated from either DKO-NSC or TKOPdpn neg-NSC orthotopic gliomas. Mean ± standard deviation shown. n = 3; statistical analysis: Student t test. (F) Kaplan-Meier survival curve of mice transplanted with either DKO-NSC or TKOPdpn neg-NSC cells. Statistical analysis: Mantel-Cox test, P = .542. *P < .05; **P < .01. N.S., not significant.
PDPN deletion in glioma cells causes reduction of intratumoral platelet aggregates. (A) Immunofluorescence staining of CD41 (green) and CD31 (red) of DKO-NSC and TKOPdpn neg-NSC orthotopic tumors. Cellular nuclei are stained with DAPI and pseudocolored in blue. Scale bars, 100 µm. Arrows indicate vessels with CD41+ platelets inside the lumen (left); arrowheads indicate CD41+ platelet aggregates within tumor microenvironment (right). (B) Quantification of the tumor area covered by CD41staining. Mean ± standard deviation shown. n = 3; statistical analysis: Student t test. (C) Representative images of DKO-NSC and TKOPdpn neg-NSC orthotopic tumors stained for CD31 (red). Scale bars, 200 µm. (D) Quantification of tumor area covered by CD31+ vessels. Mean ± standard deviation shown. n = 3; statistical analysis: Student t test. (E) In vitro platelet activation measured as CD41-CD62P++ platelets incubated with tumor cells isolated from either DKO-NSC or TKOPdpn neg-NSC orthotopic gliomas. Mean ± standard deviation shown. n = 3; statistical analysis: Student t test. (F) Kaplan-Meier survival curve of mice transplanted with either DKO-NSC or TKOPdpn neg-NSC cells. Statistical analysis: Mantel-Cox test, P = .542. *P < .05; **P < .01. N.S., not significant.
We assessed the activation status of platelets in tumor sections by staining for CD41 and CD62P to discriminate between resting (CD41+) and activated (CD41/CD62P++) platelets. Platelets in the tumor area of DKO-NSC–derived gliomas were all positive for both CD41 and CD62P (supplemental Figure 4A-B), whereas in tumors derived from TKOPdpn neg-NSC, we could hardly detect platelets positive for both markers (supplemental Figure 4C-D). This result indicates that lack of PDPN on glioma cells impairs both platelet aggregation and activation. To quantify this effect, we incubated platelets with glioma cells isolated from DKO-NSC– and TKOPdpn neg-NSC–derived tumors, respectively, and measured platelet activation by flow cytometry as the capacity of the platelets to expose CD62P from the α granules to the plasma membrane or to activate the glycoprotein GPIIb/IIIa (recognized by the PAC1 antibody).20 The percentage of activated platelets, detected as CD41-CD62P++ or CD41-PAC1++ cells, was statistically higher in the presence of PDPN+ compared with PDPN− glioma cells (Figure 4E; supplemental Figure 4E). Altogether, these results show that PDPN is not only correlated,10 but also functionally implicated in platelet activation and aggregate formation in gliomas. Interestingly, despite the reduction of intratumoral platelet aggregates, mice injected with TKOPdpn neg-NSCs did not exhibit prolonged survival compared with DKO-NSC−injected mice (Figure 4F).
In human patients, Riedl and colleagues reported that the blood platelet count was inversely correlated to PDPN expression in glioma specimens.10 We performed blood platelet counts in mice harboring either DKO-NSCs or TKOPdpn neg-NSC–derived tumors. However, we could not observe a statistically significant difference in the blood platelet count in the 2 groups of mice (supplemental Figure 5).
To assess whether PDPN expressed by astrocytes could also be involved in platelet aggregation, we first analyzed the ability of PDPN+ and PDPN− astrocytes, compared with wild-type and PDPN mutant tumor cells, to induce platelet aggregation in vitro. To obtain PDPN-deficient astrocytes, Pdpn-floxed mice were bred with mice carrying a constitutive Cre under the astrocyte-specific Gfap promoter (AstroPDPN-KO mice). Costaining of GFAP and PDPN showed that astrocytes isolated from AstroPDPN-KO mice were completely negative for PDPN compared with controls (Figure 5A).
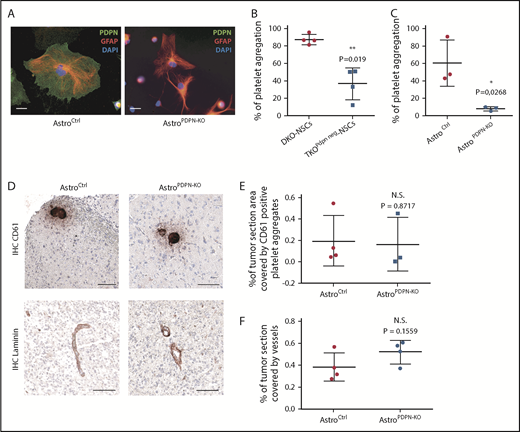
PDPN deletion in reactive astrocytes does not affect intratumoral platelet aggregates. (A) Immunofluorescence staining of astrocytes isolated from mice with the indicated genotype. PDPN (green), GFAP (red), DAPI (blue). Scale bars, 20 µm. (B) In vitro platelet aggregation (percentage) of platelets incubated with tumor cells isolated from DKO-NSC and TKOPdpn neg-NSC orthotopic gliomas. Mean ± standard deviation shown. n = 3; statistical analysis: Student t test. (C) In vitro platelet aggregation (percentage) of platelets incubated with astrocytes isolated from control and AstroPDPN-KO mice. Mean ± standard deviation shown. n = 3; statistical analysis: Student t test. (D) CD61 and laminin staining (brown) of sections from DKO-NSCs orthotopic tumors in AstroCtrl (mice carrying Pdpn-flox alleles) and AstroPDPN-KO mice. The sections were counterstained with hematoxylin. Scale bars, 100 µm. Quantification of tumor area covered by CD61 (E) and laminin (F) staining. Mean ± standard deviation shown. n = 4; statistical analysis: Student t test. *P < .05; **P < .01.
PDPN deletion in reactive astrocytes does not affect intratumoral platelet aggregates. (A) Immunofluorescence staining of astrocytes isolated from mice with the indicated genotype. PDPN (green), GFAP (red), DAPI (blue). Scale bars, 20 µm. (B) In vitro platelet aggregation (percentage) of platelets incubated with tumor cells isolated from DKO-NSC and TKOPdpn neg-NSC orthotopic gliomas. Mean ± standard deviation shown. n = 3; statistical analysis: Student t test. (C) In vitro platelet aggregation (percentage) of platelets incubated with astrocytes isolated from control and AstroPDPN-KO mice. Mean ± standard deviation shown. n = 3; statistical analysis: Student t test. (D) CD61 and laminin staining (brown) of sections from DKO-NSCs orthotopic tumors in AstroCtrl (mice carrying Pdpn-flox alleles) and AstroPDPN-KO mice. The sections were counterstained with hematoxylin. Scale bars, 100 µm. Quantification of tumor area covered by CD61 (E) and laminin (F) staining. Mean ± standard deviation shown. n = 4; statistical analysis: Student t test. *P < .05; **P < .01.
Platelets from healthy human donors were incubated with either PDPN+ or PDPN− glioma cells (isolated from DKO-NSC and TKOPdpn neg-NSC orthotopic tumors, respectively) and astrocytes (derived from control and AstroPDPN-KO mice). We observed that PDPN-expressing glioma cells and astrocytes were both able to induce platelet aggregation, whereas their PDPN− counterparts triggered platelet aggregation to a significantly lesser extent (Figure 5B-C), demonstrating that both PDPN-expressing cell types show similar platelet aggregation-inducing capacities in vitro and that PDPN is a major driver of this process.
We orthotopically injected DKO-NSCs in AstroPDPN-KO and control mice to evaluate the impact of astrocyte-specific PDPN in platelet aggregation formation in vivo. Interestingly, tumor cells gave rise to high-grade gliomas in both groups (data not shown) with similar amounts of intratumoral platelet aggregates and vessel density (Figure 5D-F), indicating that tumor-associated astrocytes, although expressing high PDPN levels and inducing platelet activation in vitro, are not implicated in brain tumor-induced platelet aggregate formation in vivo.
Discussion
GBM is the deadliest central nervous system tumor, with a median survival of 12 to 15 months after diagnosis despite maximal surgical resection followed by radio- and chemotherapy.21 Additionally, GBM is 1 of the human tumors with the highest incidence of VTE.11,12 Riedl and colleagues showed that GBM patients who develop VTE display intratumoral platelet aggregates, with tumors expressing high levels of PDPN having the highest number of platelet aggregates.10 These data strongly suggest that PDPN is functionally implicated in platelet aggregation and VTE development in GBM patients.
We established a novel genetic GBM model, in which NSC-specific Pten- and p53-deletion resulted in high-grade gliomas resembling human tumors with respect to histopathological features, PDPN expression, and platelet aggregates. Because the latency of this model was too long and the penetrance and PDPN deletion was not complete, we isolated p53- and Pten-deleted NSCs and established an orthotopic glioma model that still retained human histopathological features, including high PDPN expression and platelet aggregates. Deletion of PDPN in this novel orthotopic glioma model showed a significant reduction in intratumoral platelet aggregates, demonstrating that PDPN expressed by glioma cells is not only correlated but also functionally involved in the pathogenesis of platelet aggregation. We found that the platelet aggregates within the tumor mass are located inside the vessels and within the tumor microenvironment, suggesting that the platelets can leave the blood circulation to get in direct contact with tumor cells. This could be due to the disruption of the blood-brain barrier, a phenomenon frequently observed in GBM.22
Loss of PDPN in glioma cells did not decrease tumor malignancy, as was suggested by the association of PDPN with migration and invasion reported previously,7 suggesting that the prevalent function of PDPN in glioma cells is triggering platelet aggregation. Because platelet aggregation formation is linked to VTE development and this has been associated with higher risk of mortality,23 1 possible explanation for the same survival rate in mice bearing PDPN+ and PDPN− gliomas could be that platelet aggregation in mice per se is not sufficient to trigger VTE. The formation of thrombi in laboratory animals is usually observed on vessel ligation or chemical injury.24,25 Tumor-induced VTE has not been described in any of the existing murine cancer models, suggesting that this severe tumor-associated complication may not occur spontaneously in laboratory animals, at least not during the experimental observation period.
Our result is in contrast with previously published data in which PDPN inhibition improved survival of a murine GBM model.9 However, Chandramohan and colleagues injected human glioma cell lines subcutaneously in athymic nude mice,9 whereas in our model murine glioma cells were transplanted orthotopically in immunocompetent mice. The discrepancy on survival probability on PDPN inhibition could therefore be ascribed to the differences in the murine models used in the 2 studies. Additionally, we recently showed that in patient-derived xenograft models of GBM PDPN expression in tumor cells is a prognostic biomarker but does not affect tumor progression.26
Interestingly, although in human patients, Riedl and colleagues found that the blood platelet count was inversely correlated to PDPN expression in glioma specimens,10 we could not detect a statistically significant difference among mice harboring PDPN+ glioma cells compared with PDPN− cells. The discrepancy among murine and human data could be due to the absence of VTE in our murine model, but also to the rather small murine platelet aggregate size that may not be sufficient to cause systemic platelet consumption.
Our orthotopic glioma model is characterized by PDPN upregulation not only in glioma cells but also in astrocytes, as has been reported for human glioma specimens. We found that, in vitro, both PDPN-expressing glioma cells and astrocytes displayed similar platelet aggregation-inducing capabilities. However, in vivo, only the tumor cells are relevant for platelet aggregation formation. The different outcome observed in vivo on PDPN deletion in glioma cells compared with astrocytes is not due to a different capacity of the 2 cell types in inducing platelet aggregation. Most likely, in a glioma setting, the tumor cells outnumber the astrocytes of the microenvironment. As a consequence, in this experimental GBM model, which originates from genetically modified tumor cells, platelets might not be sufficiently exposed to reactive astrocytes to efficiently induce platelet aggregation.
Additionally, we showed that PDPN-expressing glioma cells, compared with PDPN− cells, triggered increased platelet aggregation and activation, suggesting that, in an in vivo setting, PDPN-expressing glioma cells, compared with PDPN− tumor cells, have an increased potential in inducing platelet activation and fostering VTE formation. This final last tep is more prominent in human glioma specimens, but does not occur in our glioma murine model.
Both in vivo and in vitro, PDPN− glioma cells are able to induce platelet aggregation, although at a lesser extent compared with PDPN+ cells. Therefore, although PDPN is a major player in platelet aggregation, murine glioma cells might express other protein(s) with platelet aggregation-inducing capabilities, which at least partially compensate for the loss of PDPN expression. For instance, tissue factor–containing microvesicles shed by the GBM cell line U87MG27 and by pancreatic cells28 were described as inducing platelet aggregation in vitro.
Although PDPN on glioma cells is not a driver for malignancy, our results demonstrate that it is functionally involved in platelet aggregation and thus represents a potential molecular target of tumor cell–directed therapy to decrease platelet aggregation formation in glioma patients and, potentially, also VTE. It has been found recently that cobalt hematoporphyrin inhibits CLEC2-PDPN–dependent thrombosis in mice.29 This compound could therefore be a potential candidate to prevent PDPN-mediated platelet aggregation and consequent VTE development in GBM.
The full-text version of this article contains a data supplement.
Acknowledgments
The authors thank Julia Müller for help in establishing the Pdpn-flox mouse; Christine Bauer, Sabrina Lohr, and Angelika Krischke for contributing their technical expertise to this manuscript; and Thomas Reich for his valuable help with scientific illustrations. The authors also thank the DKFZ Central Animal Laboratory for animal care, the DKFZ Light Microscopy Facility for assistance in imaging, and the DKFZ Flow Cytometry Facility for cell sorting.
This work was supported by the Helmholtz Alliance Preclinical Comprehensive Cancer Center (P.A.).
Authorship
Contribution: B.C., H.-K.L., H.P., and P.A. developed the study concept and design; B.C., T.E., J.S., I.S., and P.B. conducted the experimental work and analyzed and interpreted the data; A.K. scored the immunohistochemistry of the tumors; B.C., H.P., and P.A. wrote the original draft; and all authors revised and approved the manuscript before submission.
Conflict-of-interest disclosure: The authors declare no competing financial interests.
The current affiliation for I.S. is Laboratory of Translational Immunology, University Medical Center Utrecht, Utrecht, The Netherlands.
The current affiliation for H.P. is Hopp Children’s Cancer Center at the NCT Heidelberg and Clinical Cooperation Unit Pediatric Oncology, German Cancer Research Center, Heidelberg, Germany.
Correspondence: Peter Angel, Division of Signal Transduction and Growth Control, DKFZ-ZMBH Alliance, German Cancer Research Center (DKFZ), Im Neuenheimer Feld 280, 69120 Heidelberg, Germany; e-mail: p.angel@dkfz.de; and Barbara Costa, Division of Signal Transduction and Growth Control, DKFZ-ZMBH Alliance, German Cancer Research Center (DKFZ), Im Neuenheimer Feld 280, 69120 Heidelberg, Germany; e-mail: b.costa@dkfz.de.

