

Key Points
Criteria for a cytological and phenotypical diagnosis of BPDCN are defined.
First-line treatment with Aspa-MTX followed by allo-transplant is the best way to achieve prolonged survival even in elderly.

Abstract
Blastic plasmacytoid dendritic cell neoplasm (BPDCN) is a rare and aggressive leukemia for which we developed a nationwide network to collect data from new cases diagnosed in France. In a retrospective, observational study of 86 patients (2000-2013), we described clinical and biological data focusing on morphologies and immunophenotype. We found expression of markers associated with plasmacytoid dendritic cell origin (HLA-DRhigh, CD303+, CD304+, and cTCL1+) plus CD4 and CD56 and frequent expression of isolated markers from the myeloid, B-, and T-lymphoid lineages, whereas specific markers (myeloperoxidase, CD14, cCD3, CD19, and cCD22) were not expressed. Fifty-one percent of cytogenetic abnormalities impact chromosomes 13, 12, 9, and 15. Myelemia was associated with an adverse prognosis. We categorized chemotherapeutic regimens into 5 groups: acute myeloid leukemia (AML)–like, acute lymphoid leukemia (ALL)–like, lymphoma (cyclophosphamide, doxorubicin, vincristine, and prednisone [CHOP])–like, high-dose methotrexate with asparaginase (Aspa-MTX) chemotherapies, and not otherwise specified (NOS) treatments. Thirty patients received allogeneic hematopoietic cell transplantation (allo-HCT), and 4 patients received autologous hematopoietic cell transplantation. There was no difference in survival between patients receiving AML-like, ALL-like, or Aspa-MTX regimens; survival was longer in patients who received AML-like, ALL-like, or Aspa-MTX regimens than in those who received CHOP-like regimens or NOS. Eleven patients are in persistent complete remission after allo-HCT with a median survival of 49 months vs 8 for other patients. Our series confirms a high response rate with a lower toxicity profile with the Aspa-MTX regimen, offering the best chance of access to hematopoietic cell transplantation and a possible cure.
Introduction
Blastic plasmacytoid dendritic cell neoplasm (BPDCN) is a rare and aggressive neoplasm1 for which there is currently no consensus regarding the best therapeutic approach. The disease is now clearly categorized in the new World Health Organization (WHO) classification of hematological malignancies and distinguished from acute myeloid leukemia (AML).2 Most patients respond to various chemotherapy regimens, but relapses are almost inevitable, with a median overall survival (OS) of ∼1 year. Better results are reported in the literature with leukemia-type regimens based on AML or acute lymphoblastic leukemia (ALL) chemotherapies.3 Nevertheless, only patients who undergo hematopoietic stem cell transplantation (HCT) seem to have a prolonged survival, especially after allogeneic HCT.3-5
To identify the best treatments currently available, we conducted a retrospective study based on the recruitment to the French BPDCN network between 2000 and 2013. We describe the clinical and biological characteristics of this rare entity using the data from our large series.
Patients and methods
Patients
Based on the French BPDCN network, we identified 109 patients (2000-2013) in 35 French centers. The diagnosis of BPDCN was defined according to WHO recommendations2,6 in each participating center using a mandatory panel of lineage markers detected by flow cytometry or immunohistochemistry on infiltrated blood, bone marrow, or cutaneous lesions. In 52 cases, a larger immunophenotype was performed at the UMR 1098 including plasmacytoid dendritic cell (pDC)–specific markers7,8 (supplemental Data 1). Data collection is described in supplemental Data 1.
Treatment definitions
The initial chemotherapeutic regimens were categorized into 5 groups: AML-like (anthracyclines associated with cytarabine as in “5 + 7” AML treatments), ALL-like (multidrug associations as in ALL treatments), Aspa-MTX (high-dose methotrexate with asparaginase as in natural killer [NK]-T lymphoma treatments), CHOP-like (classical regimen used in the treatment of non-Hodgkin lymphomas and combining cyclophosphamide, doxorubicin, vincristine, and prednisone), and not otherwise specified (NOS) regimens (all other drugs alone or in combination). We also identified patients receiving autologous or allogeneic HCT (auto-HCT and allo-HCT, respectively).
Statistical analyses
Quantitative variables are described as mean ± standard deviation or median (range) and compared using the Student t or Mann-Whitney U test, as appropriate. Categorical variables are described as number (percentage). Overall response rates and relapse rates among responders are described using number and percentage with 95% confidence intervals. Categorical variables were compared using the χ2 or Fisher’s exact test, as appropriate. OS curves were constructed using the Kaplan-Meier method, and treatment groups were compared using the log-rank test. Censored patients are those alive or lost to follow-up at the date of last contact. Univariate and multivariate Cox regression analyses were performed. Variables with P < .2 on univariate analysis were entered into multivariate survival analysis. The data were considered significant only when P < .05. Analyses were performed using SAS version 9.4 (SAS Institute, Cary, NC).
The study was approved by our institutional review board (CPP Est II) and the Advisory Committee for Data Processing in Health Research (Comité Consultatif sur le Traitement de l’Information en Matière de Recherche dans le Domaine de la Santé).
Results
Patient characteristics
We identified 109 eligible patients, of whom 23 were excluded because of incomplete information. Clinical and biological characteristics were available for 86 patients (69 males and 17 females, sex ratio = 4) with a median age at diagnosis of 64 (11-89) years (Table 1). Cutaneous lesions were largely predominant and preceded hematological or visceral involvement in 41 patients (47.7%) by a mean time of 2.5 months. A single cutaneous lesion was present in 40 patients (46.5%), while disseminated skin involvement was visible in 33 patients (38%), and disease remained localized to the skin for only 2 patients. A neurological lesion was documented in 7 patients (8%). The performance status was slightly altered (grade 3-4) in 11 patients (12.8%).
Clinical and biological characteristics of the study population (N = 86)
| n (%) or mean [range] | |
|---|---|
| Tumoral involvement (N = 86) | |
| Skin | 73* (84.9) |
| Lymph nodes | 48 (55.8) |
| Spleen | 19 (22) |
| Liver | 15 (17.4) |
| Cerebrospinal fluid | 4 (4.5) |
| Eye | 3 (3.5) |
| Complete blood count (n = 79) | |
| White blood cells, ×109/L | 1 [0.8-53.8] |
| Neutrophils | 2.7 [0.02-10] |
| Eosinophils | 0.2 [0-4.1] |
| Basophils | 0.02 [0-0.2] |
| Lymphocytes | 2.1 [0.3-9.3] |
| Monocytes | 0.5 [0-3] |
| Myelemia | 0.1 [0-1.6] |
| Blasts | 5.4 [0-45] |
| Hemoglobin, g/dL | 11.2 [6.5-18.4] |
| Platelets, ×109/L | 106 [13-302] |
| Bone marrow aspirates (n = 73), % | |
| Blasts† | 64.0 [0-100] |
| Neutrophil line | 17.0 [0-66] |
| Eosinophils line | 0.8 [0-21] |
| Basophils line | 0.1 [0-3] |
| Erythroblasts | 10.0 [0-50] |
| Lymphocytes and plasma cells | 8.0 [0-48] |
| Monocytes | 1.4 [0-9] |
| Blast morphologies, %‡ | |
| Vacuoles only | 26/21 |
| Pseudopodia and vacuoles | 68/17 |
| Undifferentiated morphology | 65/7 |
| Lymphoid-like morphology | 18/68 |
| Monocytoid-like morphology | 17/6 |
| Blasts with granulations | 17/3 |
Including 40 cases with a single cutaneous lesion.
Percentage of total bone marrow cells.
Number of cases presenting these characteristics/mean proportion of blast cells presenting this morphology.
Complete blood cell count
The results of the complete blood cell count at diagnosis 2 revealed that 64% of patients had anemia at diagnosis, 75% had thrombopenia, and 38% had neutropenia (Table 1). Only 13% of cases had no cytopenia at diagnosis. Hyperleukocytosis was uncommon (31% of cases), and 3 cases had a white blood cell count >50 × 109/L with elevated blast cell count. In 69% of cases, blast cells were found on blood smear, and 40% had myelemia ranging from 0.1 to 1.6 × 10⁹/L. We observed monocytosis in 9 patients (from 1.1 g/L to 3 × 10⁹/L), of whom 1 patient had a history of polycythemia, 1 had a history of myelodysplasia (MDS- EB1), and 1 had chronic myelomonocytic leukemia (CMML). Three patients had hypereosinophilia (>0.7 × 10⁹/L), and this was associated with monocytosis in 1 case (patient P1202). No hematological antecedent was reported for these cases, and no evaluation of genetic alterations of PDGFRA, PDGFRB, or FGR1A was performed. We observed hyperlymphocytosis in 7 cases (from 4.1 to 9 × 10⁹/L). All were adults, and none had known hematological malignancies.
Bone marrow aspiration and morphology
Blastic infiltration was observed in 70 out of 73 cases (96%), including 4% with <20% of blasts. Only 3 cases had cutaneous involvement only and no bone marrow infiltration. Dysplasia in ≥1 lineage was observed in 31% of cases, more frequently impacting the granular lineage (85%). The mean age of patients with dysplasia did not differ from that of nondysplasia patients (64.6 vs 63 years). Peroxidase and esterase results were negative in all cases in which they were tested (n = 34 and n = 15, respectively).
Morphologic analysis of the blast population (n = 73) showed that morphologies were heterogeneous. Typical morphology showed medium-sized cells with a blastic round or (less frequently) irregular nucleus that was frequently peripheral. Small nucleoli were frequent. Importantly, the cytoplasm displayed faint and heterogeneous basophilia with large or small gray areas inducing a “granite” or “cloudy sky” coloration and no granulation for the majority of cases. In a large number of cases, we observed small vacuoles (sometimes coalescent) in an unusual arrangement under the cytoplasmic membrane or like rosary beads (94% of cases) and frequently large (less or more) pseudopodia (68% of cases) in a fraction of the blastic population only (3% to 75% for vacuoles and 2% to 43% for pseudopodia) (Figure 1A-D). Of note, nearly 18% of cases presented blast cells with a dominant lymphoid-like morphology (nearly two-thirds of the blast population), which can lead to confusion for diagnosis (Figure 1E). A low proportion (7%) of blasts with immature morphologies (high nuclear-to-cytoplasmic ratio, fine chromatin, and large nucleolus) were present in 65% of cases (Figure 1H). Few cells with a monoblastic-like morphology (mean 6%) were found in 17% of cases, and it is noteworthy that rare cases presented a clear monoblastic-like morphology in almost the entire blast population, with very visible nucleoli and reinforced basophilia (Figure 1F-G). Importantly, azurophilic fine or large granulations could be observed (17% of cases) in a small fraction of blasts (3%) (Figure 1I-J).

Representative morphologies of BPDCN in blood or bone marrow aspirates. (A-D) Typical morphology with large pseudopodia, microvacuoles in some blasts, an eccentrically located nucleus, and heterogeneous coloration of the cytoplasm (lightly basophile with some gray areas). The nuclei are sometimes prominent (C). (E) Lymphoid-like morphology with small cells, very small cytoplasm, and mature chromatin of the nucleus. In this case, other cells (arrows) are bigger and present a more immature profile. (F-G) Monoblast-like blasts. Cells are bigger and more basophilic, with irregular nuclei and prominent nucleoli. Case G is BPDCN secondary to acute transformation of CMML. (H) A more immature morphology with a high nucleocytoplasmic ratio, diffuse chromatin, nucleoli, and basophilic cytoplasm. (I-J) Presence of granules in the cytoplasm (arrows). (K) Atypical big and round vacuoles in the cytoplasm. May-Grünwald-Giemsa, original magnification ×1000.
Representative morphologies of BPDCN in blood or bone marrow aspirates. (A-D) Typical morphology with large pseudopodia, microvacuoles in some blasts, an eccentrically located nucleus, and heterogeneous coloration of the cytoplasm (lightly basophile with some gray areas). The nuclei are sometimes prominent (C). (E) Lymphoid-like morphology with small cells, very small cytoplasm, and mature chromatin of the nucleus. In this case, other cells (arrows) are bigger and present a more immature profile. (F-G) Monoblast-like blasts. Cells are bigger and more basophilic, with irregular nuclei and prominent nucleoli. Case G is BPDCN secondary to acute transformation of CMML. (H) A more immature morphology with a high nucleocytoplasmic ratio, diffuse chromatin, nucleoli, and basophilic cytoplasm. (I-J) Presence of granules in the cytoplasm (arrows). (K) Atypical big and round vacuoles in the cytoplasm. May-Grünwald-Giemsa, original magnification ×1000.
Immunophenotype
BPDCN cells always expressed CD4 and CD123 (interleukin-3α receptor), HLA-DR, and cTCL1 at a high level and very frequently expressed CD56 (99.9%), CD304 (93.6%), CD303 (75%), CD36 (92.5%), CD38 (84%), and CD45RA (89%) (Table 2 and Figure 2). Of note, the level of CD4, CD56, and CD303 was frequently low in intensity (lower than the expression on normal T cells, NK cells, or pDCs). The BPDCN score7 was 5/5 for 58% of cases, 4/5 for 13%, and 3/5 for 29% of cases.
Expression of hematopoietic markers in the blastic population in BPDCN cases
| Immunophenotype | Positive result/tested (%) |
|---|---|
| Myeloid markers | |
| CD33 | 28/65 (43) |
| CD13 | 1/60 (1.6) |
| CD15 | 3/47 (6.4) |
| CD65 | 1/39 (2.5) |
| CD117 | 12/66 (18) |
| CD36 | 50/54 (92.5) |
| CD64 | 1/35 (2.8) |
| CD14 | 0/59 (0) |
| MPO | 0/86 (0) |
| B-lymphoid markers | |
| CD19 | 0/62 (0) |
| CD22 | 8/40 (20) |
| cCD22 | 0/35 (0) |
| cCD79a | 4/57 (7) |
| cMu | 0/19 (0) |
| Sig | 0/19 (0) |
| T-lymphoid markers | |
| CD3 | 0/86 (0) |
| cCD3 | 0/86 (0) |
| CD7 | 38/64 (59) |
| CD2 | 24/59 (40.6) |
| CD5 | 3/52 (5.7) |
| CD1 | 1/25 (4) |
| CD16 | 0/40 (0) |
| CD57 | 0/8 (0) |
| CD8 | 0/49 (0) |
| cDC markers | |
| CD11c | 0/51 (0) |
| CD1c | 5/23 (21.7) |
| CD141 | 0/23 (0) |
| Immature and other markers | |
| CD34 | 1/73 (1.3) |
| Tdt | 4/27 (14.8) |
| CD133 | 0/7 (0) |
| CD10 | 9/53 (17) |
| CD38 | 37/44 (84) |
c, intracytoplasmic expression; cDC, classical dendritic cell; cMu, intracytoplasmic heavy-chain μ; MPO, myeloperoxidase; Sig, surface immunoglobulin; Tdt, intranuclear terminal deoxynucleotidyl transferase.
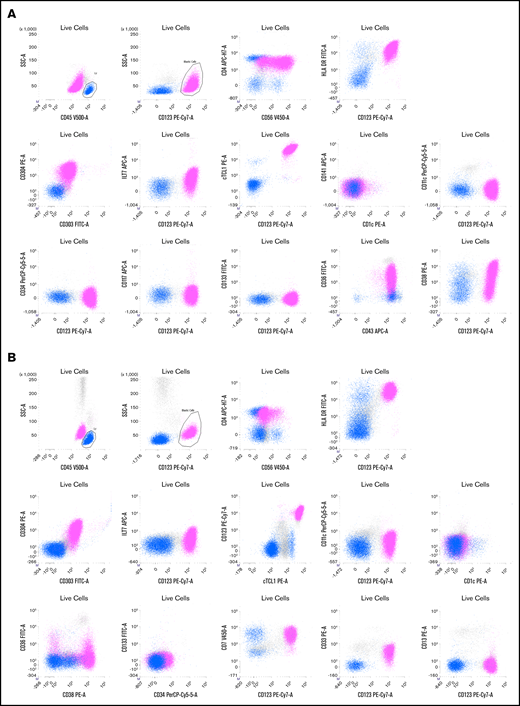
Two representative examples of BPDCN patients. Live cells are gated on a first forward scatter (FCS)/side scatter (SSC) to exclude debris and a FCS area (A)/FSC height (H) gate to select singlets (not shown). The CD45bright /SSClow cells are lymphocytes (blue), and CD45dim /CD123bright cells are a BPDCN blastic population (pink). (A) Patient P165. Blasts are CD4+ (lower than T lymphocytes in blue) and CD56+ with a bimodal expression, CD303+, CD304+ HLA-DR+, cTCL1+, ILT7low, CD36+, CD38+, and CD43+.There is no expression of classical dendritic cell markers (CD1c, CD141, and CD11c) or immature markers (CD34, CD133, and Tdt). (B) Patient P149. Blasts are CD4+ and CD56partial and low, CD303+, CD304+ HLA-DR+, cTCL1+, ILT7−, CD36−/partial, and CD38+. The blasts also expressed CD7 and CD33 without CD13. Classical dendritic cell markers (CD1c, CD141, and CD11c) and immature markers (CD34 and CD133) are negative. APC, allophycocyanin; FITC, fluorescein isothiocyanate; PE, phycoerythrin.
Two representative examples of BPDCN patients. Live cells are gated on a first forward scatter (FCS)/side scatter (SSC) to exclude debris and a FCS area (A)/FSC height (H) gate to select singlets (not shown). The CD45bright /SSClow cells are lymphocytes (blue), and CD45dim /CD123bright cells are a BPDCN blastic population (pink). (A) Patient P165. Blasts are CD4+ (lower than T lymphocytes in blue) and CD56+ with a bimodal expression, CD303+, CD304+ HLA-DR+, cTCL1+, ILT7low, CD36+, CD38+, and CD43+.There is no expression of classical dendritic cell markers (CD1c, CD141, and CD11c) or immature markers (CD34, CD133, and Tdt). (B) Patient P149. Blasts are CD4+ and CD56partial and low, CD303+, CD304+ HLA-DR+, cTCL1+, ILT7−, CD36−/partial, and CD38+. The blasts also expressed CD7 and CD33 without CD13. Classical dendritic cell markers (CD1c, CD141, and CD11c) and immature markers (CD34 and CD133) are negative. APC, allophycocyanin; FITC, fluorescein isothiocyanate; PE, phycoerythrin.
BPDCN expressed at ≥1 myeloid marker in 47% of cases including 2 myeloid markers in 9% of cases. The most frequent was CD33 (43%), as previously described,7 followed by CD117 (18%) and CD15 (6.4%). Others were rare (Table 2). One case expressed CD13, CD33, and CD117 (and CD123, CD303, and CD304). No case expressed MPO or CD14. At least 1 T-lymphoid marker was expressed in 71.8% of cases, including 19% that expressed 2 of these markers. The most frequent was CD7 (59%), followed by CD2 (40%). No cases expressed CD3 (intracytoplasmic or membrane), CD16, or CD57 (Table 2). One B-lymphoid marker was expressed in a smaller number of cases (15.7%), the most frequent being CD22 (20%); cCD79a was rare (7%), while CD19, CD20, intracytoplasmic heavy-chain μ, and surface immunoglobulin were never detected. It is noteworthy that surface CD22–positive cases were negative on intracytoplasmic testing, and all cases with intracytoplasmic CD22 testing (n = 28) were negative. B marker expression was statistically associated with a higher level of blood blastosis (median 6.5 × 10⁹/L vs 0.38 × 10⁹/L, P = .028) and more frequent splenomegaly (56% vs 17%, P = .013). Finally, we found that the simultaneous expression of isolated markers of myeloid or lymphoid lineages was not uncommon (Figure 3). The most frequent scenario was coexpression of myeloid and T-lymphoid antigens (n = 30), but all combinations were possible (myeloid marker plus B [n = 4)], lymphoid B + T [n = 5]), even the association of B, T, and myeloid antigens (n = 4) (Table 3). Three of these cases also expressed a BPDCN profile with CD123high, HLA-DRhigh, CD4+, CD56+ plus CD303+, and CD304+ or cTCL1+.
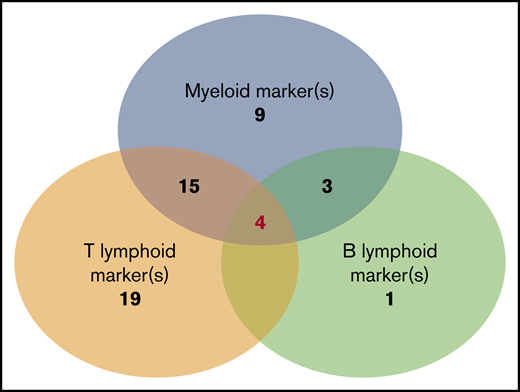
Number of BPDCN cases that express nonspecific lineage markers and association of different expression combinations. The analysis presents 61 patients in whom a large myeloid and B-/T-lymphoid panel were analyzed (CD19, CD20, CD22, cCD22, and cCD79a; T: cCD3, CD3, CD2, CD5, and CD7; myeloid: CD13, CD33, CD15, CD65, CD117, MPO, CD11c, CD14, and CD64). Numbers indicate the number of cases in each group of associated markers. Of note, 4 cases simultaneously expressed B, T, and myeloid markers.
Number of BPDCN cases that express nonspecific lineage markers and association of different expression combinations. The analysis presents 61 patients in whom a large myeloid and B-/T-lymphoid panel were analyzed (CD19, CD20, CD22, cCD22, and cCD79a; T: cCD3, CD3, CD2, CD5, and CD7; myeloid: CD13, CD33, CD15, CD65, CD117, MPO, CD11c, CD14, and CD64). Numbers indicate the number of cases in each group of associated markers. Of note, 4 cases simultaneously expressed B, T, and myeloid markers.
Clinical and biological presentation of the 4 BPDCN cases expressing a combination of lymphoid markers (B and T) plus myeloid markers
| Patients | P101 | P1506 | P1603 | P201 |
|---|---|---|---|---|
| Age, y | 76 | 66 | 69 | 81 |
| T-cell markers | ||||
| CD2 | − | − | − | + |
| CD5 | − | − | − | − |
| CD7 | + | + | + | − |
| CD3 | − | − | − | − |
| cCD3 | − | − | − | − |
| B-cell markers | ||||
| CD22 | − | + | + | + |
| CD79a | + | − | − | − |
| cCD22 | − | ND | ND | ND |
| CD19 | − | − | − | − |
| Myeloid markers | ||||
| CD13 | − | − | − | − |
| CD117 | + | − | − | − |
| CD15 | − | − | − | − |
| CD65 | − | − | − | − |
| CD33 | + | + | + | + |
| CD38 | + | + | ND | ND |
| CD36 | + | + | + | + |
| MPO | − | − | − | − |
| pDC markers | ||||
| HLA-DR | + | + | + | + |
| CD4 | + | + | + | + |
| CD56 | + | + | + | + |
| CD123 | + | + | + | + |
| CD303 | ND | + | ND | + |
| CD304 | ND | + | ND | + |
| cTCL1 | ND | + | + | ND |
| Karyotype | Failure | Normal | Normal | Normal |
| Bone marrow aspirate | ||||
| Dysplasia | No | Dysgranulopoiesis | Dysgranulopoiesis | Trilineage dysplasia |
| Blast morphology | Large pseudopodia, rare vacuoles, undifferentiated cells | Medium size, some vacuoles, immature | Typical with vacuoles and pseudopodia | Typical with vacuoles and pseudopodia |
| Cutaneous lesions | Extensive petechiae skin purpura, from thighs to neck | Multiple brown lesions on the back and trunk | Purplish nodular lesions on the forehead and scalp | Diffuse ecchymotic lesions on the trunk, face, upper and lower limbs |
| Immunohistochemistry | CD4+ CD56+ MPO− CD3− CD20− CD138− immunoglobulin− | CD4+ CD56+ CD3− CD20− MPO− | CD123+ CD4+ CD56+ CD45RA+ CD34− MPO− TDT− CD15− CD3− CD2− CD8− CD20− | CD4+ CD56+ CD68+ CD123+ CD303+ TCL1+ CD2AP+ |
c, intracytoplasmic detection; ND, not done.
Markers of conventional dendritic cells were rare: CD11c and CD141 were not detected, but CD1c was found in 21.7% of cases at a low level. No case expressed CD11c or CD1c. Immature markers were rare, as shown by only 1 case expressing CD34, 18% of cases expressing CD117, 14.8% expressing terminal deoxynucleotidyltransferase, and no expression of CD133 (0/7 tested). They were not related to other markers, except for CD117+, which was associated with less frequent CD303 expression (25% for cases expressing CD117 vs 78% for others; P = .01). The CD34+ patient (a 41-year-old woman) presented cutaneous lesions and bone marrow infiltrated by a blastic population that expressed CD4+, CD34+ plus CD117+ and Tdt+, CD7+ (without other T markers), CD123+, CD303+, CD304+, CD68+, and CD43+ but absence of CD56.
Conventional cytogenetic analysis
Karyotypes were obtained for 72% of patients (62/86). A cytogenetic abnormality was found in 59.7% of cases (37/86), with 14.5% of cases presenting a single abnormality, 9.7% with 2 abnormalities, and 35.5% presenting ≥3 abnormalities. Neither the total number of abnormalities nor any particular abnormality impacted the prognosis or clinical presentation. Deletions were predominant, involving especially minimal deleted regions of chromosomes 13, 12, 7, 9, 15, 5, 6, and 17 (Figure 4). Chromosomal gains were less frequent than deletions; however, we observed 1q gains (n = 5) and gains of chromosome 8 (n = 5).

Chromosomal abnormalities evidenced by conventional cytogenetic analysis in 62 cases. (A) Distribution of karyotype results. (B) Percentage and type of abnormality for each chromosome depicted on the left. Chromosomal abnormalities of particular interest are listed on the right, with loci concerned (green), candidate genes already described (blue), and number of patients (red) for each type of abnormality (gray) (ie, monosomies, trisomies, deletions, isochromosome, addition, and translocations). add, addition; chr, chromosome; del, deletion.
Chromosomal abnormalities evidenced by conventional cytogenetic analysis in 62 cases. (A) Distribution of karyotype results. (B) Percentage and type of abnormality for each chromosome depicted on the left. Chromosomal abnormalities of particular interest are listed on the right, with loci concerned (green), candidate genes already described (blue), and number of patients (red) for each type of abnormality (gray) (ie, monosomies, trisomies, deletions, isochromosome, addition, and translocations). add, addition; chr, chromosome; del, deletion.
Clonality
Immunoglobulin H clonality was tested in only 11 cases, and the result was negative in all cases. A T-cell receptor γ rearrangement was detected in 5 out of 19 cases analyzed and was statistically associated with more prevalent expression of 1 myeloid marker (100% of T-cell receptor γ rearrangement–positive cases vs 18% for others; P = .01).
Treatment response
Complete data were evaluable in 78 patients (Table 4). A first complete remission (CR) was obtained in 47 patients (60.2%) with a median duration of 13 (1.5-15) months, and relapse occurred in 17 patients at a median of 19.2 (1.5-23.5) months (Table 2). The differences in relapse rates were not statistically significant between treatment groups. In CR patients, the remission duration ranged from 2 to 399 months with a median of 32 months. The CR rates and remission durations were not statistically different between the AML-like, ALL-like, and Aspa-MTX groups, but median duration of remission was longer in the AML-like/ALL-like/Aspa- MTX group than in the CHOP-like/NOS group (47 vs 7 months respectively; P = .038). Nine patients received idarubicin as first-line therapy; 7 of them obtained CR, and only 1 relapsed after 10 months. The other 6 patients remain in CR and received HCT (allo-HCT, n = 5; auto-HCT, n = 1), and only 1 relapsed after transplantation. Thirty patients with no documented neurological involvement received prophylactic intrathecal chemotherapy as a part of their first-line treatment.
Response to first-line treatment
| Treatment group | Complete remission, n (%) | Remission duration, median (range), mo | Relapse rate, n (%) of CR patients | HCT, n (%) of CR patients |
|---|---|---|---|---|
| AML-like (n = 19) | 13 (68.4) | 68 (4-399)* | 4 (28.5) | 7 (2 auto) (36.8-53.8) |
| ALL-like (n = 19) | 15 (78.9) | 47 (6-224) | 5 (33.3) | 7 (46.7) |
| Aspa-MTX (n = 16) | 12 (75) | 26 (5-166) | 4 (33.3) | 6 (37.5-50) |
| CHOP-like (n = 16) | 6 (37.5) | 17 (4-22)* | 4 (66.7) | 2 (12.5-33.3) |
| NOS (n = 10) | 1 | 35 | 0 | 0 |
Data are missing for 1 patient.
A second line of treatment was administered in 34 of primary refractory (n = 28) or relapsing (n = 6) patients. Only 6 patients exhibited a subsequent response, and 3 received allo-HCT. None of the patients treated with an AML-like regimen as first-line therapy experienced a further response; 2 patients in the ALL-like group, 1 patient in the Aspa-MTX group, 2 patients in the CHOP-like group, and 1 patient in the NOS group obtained CR after salvage chemotherapy; all but 1 patient ultimately died of progressive BPDCN. We identified 3 patients who received bortezomib and 2 azacitidine as salvage therapy; a short and transient partial response was observed for these 5 patients with a rapid and fatal progression in all cases.
Transplantation
Thirty-four patients received HCT (30 allo-HCT and 4 auto-HCT). Twenty-six of them were transplanted while in initial remission (23 allo-HCT and 3 auto-HCT), and 8 patients received allo-HCT in subsequent response (complete and partial remission, n = 5) after a rescue chemotherapy or in progressive disease (n = 3).
A myeloablative conditioning regimen was used in 24 allo-HCT patients, 120-cGy total body irradiation with cyclophosphamide in 17 patients, and 12.8 mg/kg busulfan and fludarabine in 7 patients. A reduced-intensity regimen was used in the remaining 6 patients, including single-dose total body irradiation (200 cGy) in 5 cases. The donor was an identical sibling in 15 cases, an unrelated matched donor in 11 cases, and an unrelated mismatched donor in the 4 last cases.
A protocol comprising carmustine, cytarabine, etoposide, and melphalan was used for the conditioning regimen of the 4 auto-HCT patients; 3 were transplanted in first CR, and 1 received a subsequent allo-HCT after a relapse after auto-HCT.
Fourteen patients relapsed after HCT: 4 auto-HCT patients (100%) after 2, 4, 7, and 17 months, respectively, and 10 allo-HCT patients (33%) with a median time of 12 (3−15) months after HCT. One patient received a second allo-HCT. All patients who relapsed after HCT ultimately died of BPDCN progression.
Survival
Patients who responded to the first line of treatment (n = 47, 54.6%) showed longer median OS than refractory patients (8 vs 20 months) (Figure 4; P < .0001). Median OS was longer in patients who received AML-like, ALL-like, or Aspa-MTX regimens (18, 15, or 15 months, respectively) than in those who received CHOP-like or NOS regimens as first-line treatment (11 or 4 months, respectively) (P < .0001; Figure 5). There was no significant difference in survival of patients receiving AML-like and ALL-like regimens or Aspa-MTX regimens.

Comparison of survival according to treatment type and response. OS according to response to first-line treatment (A) and initial treatment groups (AML-like, ALL-like, and Aspa-MTX vs CHOP-like and NOS) (B).
Comparison of survival according to treatment type and response. OS according to response to first-line treatment (A) and initial treatment groups (AML-like, ALL-like, and Aspa-MTX vs CHOP-like and NOS) (B).
Eleven patients (42.3%) are alive in persistent CR after allo-HCT at the time of analysis. The median OS for patients who received HCT (autologous [n = 3] or allogeneic [n = 31]) and other patients (n = 52) was respectively 49 and 8 months (P < .0001; Figure 6).

Prognostic factors
In univariate analyses, 7 factors were found to have a significant impact on OS (Table 5). Multivariate analysis confirmed the significant impact of treatment group (AML-like, ALL-like, and Aspa-MTX vs CHOP-like and NOS), Eastern Cooperative Oncology Group status, and myelemia (Table 5). Age had a significant impact only when considered as a continuous variable. The beneficial effect of HCT persisted independently of age in multivariate analysis. The role of the conditioning regimen and type of donor for allo-HCT could not be analyzed due to the small sample size.
Univariate and multivariate analysis of prognostic factors for OS
| Univariate analysis | Multivariate analysis | |||||
|---|---|---|---|---|---|---|
| HR | 95% CI | P | HR | 95% CI | P | |
| Treatment (lymph-like/other vs ALL-like/AML-like/NK-T-like) | 2.396 | 1.391-4.125 | .002 | 2.461 | 1.361-4.449 | .003 |
| Age (continuous variable) | 1.026 | 1.011-1.041 | .0007 | |||
| ECOG status 0-2 vs 3-4 | 0.278 | 0.137-0.565 | .001 | 0.268 | 0.124-0.576 | .001 |
| Myelemia, × 109/L | 4.245 | 1.467-12.289 | .008 | 4.696 | 1.365-16.153 | .001 |
| Monocytes, × 109/L | 1.423 | 0.912-2.221 | .1200 | |||
| White blood cells, × 109/L | 0.881 | 0.736-1.0555 | .168 | |||
| Platelets, × 109/L | 0.996 | 0.992-1.000 | .079 | |||
The estimates of the parameters are given with their 95% confidence intervals. A P value < .05 is considered statistically significant.
CI, confidence interval; ECOG, Eastern Cooperative Oncology Group; HR, hazard ratio.
Discussion
Currently, the treatment of BPDCN remains challenging for physicians. According to the literature, the best OS is observed in BPDCN patients who receive allo-HCT in first CR.4,9 We conducted this retrospective study in an attempt to identify the best first-line treatment to obtain the maximum of patients in first CR who might then be eligible for allo-HCT. Our data also explore the clinical and biological presentation of this rare disease based on the French BPDCN network data collection, which achieved almost exhaustive analysis of French cases over a 10-year period. Cases are now more easily diagnosed, taking into account the recent diagnostic criteria, including new pDC markers.2,8 In our series, most diagnoses were centrally reviewed (cytology and immunophenotyping), and we confirm the rarity of the disease, with 10 to 15 new cases identified per year in France. The clinical presentation is in accordance with the classical, well-known features, namely older men with cutaneous lesions, good performance status, and pancytopenia, frequently with leukemic cells in the blood. We do not identify specific clinical features other than cutaneous involvement in 85% of patients and lymph node involvement in half of the patients. Isolated cutaneous or visceral lesions were rare in our series, and we did not observe frequent neurological involvement at diagnosis. We identified older age and altered general state as adverse clinical prognostic features with a significant impact on OS. This probably hampers the possibility of those patients receiving intensive treatment followed by HCT.
Diagnosing BPDCN in hematology laboratories requires in-depth knowledge of the biological characteristic of this rare form of leukemia, since BPDCN blasts can harbor heterogeneous morphologies, as well as an immunophenotype that is sometimes close to non-pDC leukemia (particularly AML or immature ALL). We highlight frequently observed cytological characteristics that might alert cytologists, including a typically light-blue/gray cytoplasm with some clearer areas (“cloudy sky”) and very frequent microvacuoles, thin or large pseudopods only in a fraction of the blastic population, and frequent eccentric nucleus. Importantly, this characteristic population is frequently associated with some blasts with undifferentiated pseudomonoblastic or pseudolymphoid morphology. It is noteworthy that the pseudolymphoid morphology could be preponderant, hampering the diagnosis with a false suspicion of lymphoma.10 More surprisingly, we observed a small number of the blastic population that presents peroxidase negative granulations, a finding that has not been described before. Myelemia is the sole biological adverse prognostic feature affecting OS. Myelemia was present in 40% of cases, including 11 cases with myelemia >0.3 × 10⁹/L associated with monocytosis in 6 cases, probably indicating a proliferative component in these patients. Indeed, 2 of them had a known history of polycythemia vera or CMML.
Immunophenotyping is mandatory to confirm the diagnosis of BPDCN. The most specific lineage markers never expressed in BPDCN are MPO, CD14, and CD64 (only found at low level in 1 case) for myeloid lineage, cCD3 and CD3 for T lineage, and CD19 and cCD22 for B lineage (whereas cCD79a is found in 7% of cases). Other less specific markers are frequently expressed, most frequently isolated, but sometimes associated and even for myeloid plus B- and T-lymphoid markers, leading to difficulty affirming the BPDCN diagnosis. Overall, these data highlight that immunophenotyping of BPDCN must include an investigation of pDC markers, including CD123, CD303, CD304, and cTCL1. Moreover, expression of myeloid and/or B-/T-lymphoid markers must not exclude this diagnosis. Practically, isolated expression of lineage markers (such as CD33, CD7, and CD22) without specific markers (such as CD19, cCD3, MPO, CD14, and CD64) with HLA-DRhigh, CD4, and CD56 must raise a hypothesis of BPDCN, which must then be confirmed using pDC marker expression (Figure 7). Histopathological analysis of cutaneous lesions is complementary and is especially required for patients with skin lesions only using validated pDC-associated markers such as TCL1, CD2AP, SPIB, TCF4, and MX1.11-16 Moreover, overexpression of BCL2 represents a hallmark of tumoral pDCs vs normal pDCs,16,17 indicating a potential therapeutic role of anti-BCL2 treatment. It is noteworthy that only 1 case expressed immature markers (CD34+ CD117+) and absence of CD56: it could be related to the immature BPDCN profile described by Martín-Martín et al.18
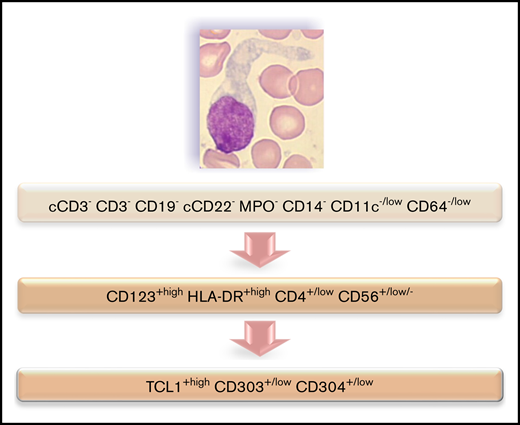
Flowchart illustrating the phenotypic diagnosis of BPDCN. In the absence of expression of specific lineage markers, high expression of CD123 and HLA-DR plus CD4 (which can be low) and CD56 (which can be low or negative) raises the possibility of BPDCN, even if isolated or associated less-specific lineage markers are expressed (such as CD7, C2, CD33, CD13, CD117, CD22, and cCD79a). Diagnosis should be confirmed using cTCL1, CD303, and CD304. c, intracytoplasmic; −, negative (expressed in <20%of the blastic population); +, positive (>20%); low, intensity of expression less than normal cells expressing this marker (eg, NK cells for CD56, normal pDCs for CD303 and CD304, T cells for CD4, and monocytes for CD11c and CD64).
Flowchart illustrating the phenotypic diagnosis of BPDCN. In the absence of expression of specific lineage markers, high expression of CD123 and HLA-DR plus CD4 (which can be low) and CD56 (which can be low or negative) raises the possibility of BPDCN, even if isolated or associated less-specific lineage markers are expressed (such as CD7, C2, CD33, CD13, CD117, CD22, and cCD79a). Diagnosis should be confirmed using cTCL1, CD303, and CD304. c, intracytoplasmic; −, negative (expressed in <20%of the blastic population); +, positive (>20%); low, intensity of expression less than normal cells expressing this marker (eg, NK cells for CD56, normal pDCs for CD303 and CD304, T cells for CD4, and monocytes for CD11c and CD64).
Cytogenetics revealed abnormalities classically described in BPDCN.19,20 These abnormalities are potentially related to the deletion of genes implicated in cancer development, such as RB1 (13q14), involved in cell-cycle control and tumor removal21 ; ETV6 and CDKN1B (12p11-13)21,22 ; and IKZF1 (7p12), TP53 (17p13), NR3C1 (5q31),23 and rearrangements of MYB (6q23)24 and KMT2A,25 as previously described in BPDCN. 8q24 aberration, suggestive of MYC rearrangement, was only detected in 1 patient. MYC rearrangements appear particularly recurrent in Japanese populations,26-31 with a prevalence estimated at 38% in the largest cohort,32 frequently associated with immunoblastoid morphology. In contrast, prevalence seems to be lower in white patients, based on karyotype studies (4% to 8%),19,33-35 and although cryptic cases are possible, prevalence remains lower in studies based on immunochemistry and fluorescence in situ hybridization assays (15%),36 raising the hypothesis of a lower frequency of MYC rearrangement/immunoblastoid morphologies in white populations. Cytogenetic abnormalities did not impact survival, although numbers of cases with informative karyotypes and lesions of interest (5q for example) were limited in our series. Of note, 2 of the cases with 12p11-13 rearrangements exhibited hypereosinophilia and balanced translocation potentially involving PDGFRA/PDGFRB, consistent with the 2 aspects of the neoplasm: a hypereosinophilic contingent with PDGFRA/PDGFRB deregulation and a pDC contingent with ETV6 invalidation reported as an early clonal event in BPDCN.22
Our data confirm that achievement of CR after first-line treatment is required to obtain long survival and that prolonged survival is observed only in patients receiving allo-HCT during first CR.3-5,37 Very few patients received auto-HCT as consolidation of CR, and all of them relapsed in our cohort. However, the small number of patients involved precludes any conclusion.38,39 When we analyzed pretransplant treatment, the highest CR rates were observed after leukemia-like regimens, with no difference observed between AML-like or ALL-like regimens. We confirm that the use of a less intense regimen based on MTX and asparaginase40 offers similar CR rates, which then translate into prolonged survival if the patient receives allo-HCT. We have demonstrated in preclinical models that idarubicin is one of the most efficient drugs against BPDCN,41 and patients in our cohort showed a good response to idarubicin. Based on these results, we are now conducting a prospective phase 2 trial in France to test a MTX-asparaginase–based regimen associated with a single dose of idarubicin. All responding and eligible patients will be offered HCT (allogeneic or autologous). The use of CHOP-like regimens gives lower CR rates, thereby preventing access to HCT in good conditions and survival of <1 year for the majority of patients. Patients refractory to or relapsing after the first treatment do not respond easily to further treatments, and the success of second-line therapy is very low, even when an allo-HCT is performed in subsequent response.
Recent biological data offer some avenues for alternative treatments such as bortezomib,42 venetoclax,43-46 IDH2 inhibitor,47 pralatrexate,47-49 and azacytidine.50-52 We identified 2 patients receiving bortezomib and 2 patients receiving azacitidine, with a 50% response rate but a response duration of <6 months. Most interesting data were obtained with immunotherapy,53 especially with a CD123-directed conjugated immunotoxin (Tagraxofusp). Frankel et al first reported high CR rates (>80%) with acceptable toxicity, but remission duration remained short (6 months),54 especially in children.55
Subsequently, Pemmeraju et al56 reported 32 untreated patients with an overall response rate of 90% and clinical CR in 72% of patients, enabling a successful bridge to transplant in 13 patients (45%) (ie, 10 allo-HCT and 3 auto-HCT). With a follow-up of 25 months, disease-free survival in these untreated patients, grafted in first CR, reached 52% at 24 months. The authors mentioned grade 3 to 5 adverse events with 3 deaths observed during exposure to tagraxofusp after a severe capillary leak syndrome observed during the first cycles of treatment in 8 patients. They conclude that “with vigilant monitoring and early interventions, capillary leak syndrome was manageable and did not preclude restarting tagraxofusp after resolution.” It seems that this treatment should also be considered as a useful bridge to transplant in naive BPDCN patients. Some encouraging but preliminary results are also described with an anti-CD123–conjugated monoclonal antibody.57
In conclusion, diagnosis of BPDCN remains challenging for biologists, since most will only encounter it once or twice a year or less. Although the criteria are well defined by the WHO classification, its presentation in the hematology laboratory (cytology, immunophenotype) is quite heterogeneous, and cytogenetics and mutation profiles are not specific. We present one of the largest series of BPDCN patients to date, highlighting criteria that should alert the biologist to the possibility of BPDCN and prompt investigation of pDC marker expression to confirm diagnosis. After diagnosis, the question of the best treatment of these patients is a major issue for physicians, and our results shed some light on this point. The attainment of high CR rates after first-line treatment is the best way to achieve prolonged survival in BPDCN patients if the results can be consolidated with allo-HCT. Leukemia-like regimens have shown their efficacy in our data and in the literature, although toxicity in the population of elderly BPDCN patients remains a challenge. Our series confirms the potential for a high response rate, similar to leukemia-like regimens, with the association of MTX and asparaginase, with a low toxicity profile, even in elderly patients. We believe that this approach offers the vast majority of BPDCN patients their best chance at gaining access to HCT as a consolidation treatment, which remains the best way to ensure prolonged response.
Acknowledgments
The authors thank Fiona Ecarnot for her help preparing the manuscript, Louis Benazet for collecting data, Aurore Pugin for statistical analysis, and Franck Leroux for data management, as well as the Groupe Français d’Hématologie Cellulaire, the Groupe d’Etude Immunologique des Leucémies, the Groupe Français de Cytogénétique Hématologique, and the Société Française d’Hématologie.
This study was supported by the Institut National du Cancer (PRT-K-15-175), the Ligue Contre le Cancer Conférence de Coordination Interrégionale du Grand est Bourgogne Franche-Comté, and the association Cent pour Sang la Vie.
Authorship
Contribution: C.V. performed statistical analysis; E.P., Y.D., T. Petrella, A.R., F.R., C.F., and S.B. acquired and analyzed data; biologists and physicians from institutions 5-73 provided patient samples, clinical data, and expertise; F.R., D. Binda, S.P., F.S., E.S., M.P., L.S., and T. Petrella provided guidance and expertise in their respective areas of study; F.G.-O., C.V., F.R., and E.D. wrote the manuscript; M.D., O.A., and P.S. commented on the manuscript; F.G.-O., F.A.-D., D. Binda, and E.D. supervised research; and all authors provided input and edited and approved the final version of the manuscript.
Conflict-of-interest disclosure: The authors declare no competing financial interests.
Correspondence: Eric Deconinck, Service Hématologie, CHU Besançon, 25000 Besançon, France; e-mail: edeconinck@chu-besancon.fr.

