

Key Points
HA exposure alters hemostatic systems and contributes to the onset of VTE at a younger age.
Aggravated disruption of coagulation, platelet, and endothelial function differentiates HA-induced VTE from VTE on the plains.

Abstract
High-altitude (HA) hypoxia exposure is believed to induce venous thromboembolism (VTE) in otherwise healthy individuals, although this needs to be fully established. The present study aims to ascertain the role of HA exposure in aggravating any predisposition toward VTE and to explore whether the etiology of HA-induced VTE is different from that of VTE closer to sea level. We compared manifestation-matched male VTE patients from HA (HAPs) and VTE patients from the plains closer to sea level (SLPs) for 54 parameters, including coagulation-related, fibrinolytic, and thrombophilic variables, as well as markers for stress and inflammatory response and platelet and endothelial activation. Our results established an association between HA hypoxia and VTE in alterations of primarily hemostatic variables. Approximately 96% of HAPs presented with ≥10 altered parameters out of 54 studied compared with 7% of SLPs. Elevated platelet count, von Willebrand factor, and clotting factors and altered coagulation exhibited significant associations with VTE events and altitude exposure (all P < .05). Additionally, most VTEs at HA were associated with younger age groups, unlike those on the plains. A receiver operator characteristic curve analysis revealed differences between HAPs and SLPs for CD40 ligand (area under the curve [AUC], 0.90; 95% confidence interval [CI], 0.84-0.96]), P-selectin (0.79; 0.70-0.88), platelet factor-4 (0.90; 0.84-0.96), intracellular adhesion molecule-1 (0.86; 0.79-0.93), vascular cell adhesion molecule-1 (0.97; 0.95-0.99), vascular endothelial growth factor (0.87; 0.8-0.94), FLT4 (0.94; 0.89-0.99), and Toll-like receptor-2 (0.98; 0.96-1.0) (all P < .05). In conclusion, this study suggests that HA exposure perturbs the molecules associated with vascular integrity and contributes to the early onset of VTE.
Introduction
Venous thromboembolism (VTE), a multifactorial disorder, may occur as a result of alterations in inherited thrombophilic traits or acquired factors or a perturbance in molecular mechanisms associated with coagulation and hemostasis.1-5 Hypoxia experienced at high altitude (HA) has been proposed as a plausible risk factor for VTE. The extreme conditions at HA may enforce venous stasis that may facilitate the development of a prothrombotic milieu.5-11 Human studies have suggested alterations in hematology and the hypercoagulable state12-14 and activation of platelets and endothelium at HA.15,16 However, a dearth of comprehensive research has constrained our understanding of the possible crucial role of hypoxic environments in the dysregulation of hemostatic systems that may result in fatal episodes. A more elaborate assessment of the factors associated with the etiology of VTE is needed for a better understanding of its pathogenesis. Furthermore, limited epidemiological evidence suggests the occurrence of VTE at HA is likely to be much higher than reported. A few clinical case studies and an initial report claiming that the death of 5 of 7 trekkers is due to VTE in the Himalayan region suggests a greater occurrence rate on ascension to higher altitudes.17-20 Therefore, the available diverse reports on the prothrombotic nature of HA hypoxia increase our concern about this disease.21-26
Our previous studies have suggested that hypoxia induced an increase in platelet adhesion and activity.27 Similarly, another study from the Himalayas suggested that enhanced platelet factor-4 (PF4), factor V, factor VII, plasma fibrinogen, and fibrinolytic activity might create an environment conducive for the occurrence of VTE.13 In addition, hypoxia inducible factor (HIF) activated by HA hypoxia induces the expression of various stress-response pathways. These pathways, in turn, trigger a procoagulant state, as evidenced by the increase in various coagulation markers and sterile inflammation at HA.28 Using animal models, we have also recently demonstrated the prothrombotic propensity of HA hypoxia, via involvement of calpain27 and/or through the reinforcement of the inflammasome complex, to augment thrombus formation in response to hypoxia.28 As a continuation, the present study comprehensively investigated parameters related to coagulation and hemostasis, platelets and endothelial cell activation, and inflammation and stress molecules in a comparable number of manifestation-type–matched VTE patients from HA (HAPs) and VTE patients from the plains closer to sea level (SLPs). Genetic and thrombophilic predisposing factors and other comorbidity risk factors were also analyzed. Additionally, the levels of marker molecules in different VTE types at both altitudes were evaluated. This comprehensive cross-sectional observational study permits determination of the impact of elevated altitude on the diverse components of the hemostatic system during thrombotic events in otherwise physically fit young individuals. This study would also be helpful in determining the distinct biomolecular signature exhibited by VTEs at altitude compared with those on the plains closer to sea level. The exploration and identification of these differences could result in a better understanding and, thus, management of the disease at HA and, consequently, in the development of newer and improved therapeutic strategies.
Methods
Study design and participants
This study was conducted as per the ethical standards of the Indian Council of Medical Research (01/IEC/DIPAS/12), and written informed consent was obtained from all patients in accordance with Declaration of Helsinki guidelines. The present study consisted of 2 groups of a comparable number of VTE patients <60 years of age. The HAP group consisted of males patients who developed VTE while staying at HA (>3000 m; n = 53). The SLP consisted of male patients who developed VTE close to sea level (admitted to Army Hospital [Research and Referral]) during the same period and were not exposed to HA in the past 2 years (<350 m; n = 45). HAPs were air evacuated to tertiary care hospitals (Western Command Hospital Chandimandir or Army Hospital [Research and Referral]) located near sea level. Individuals with a familial history of thrombotic episodes and those already on anticoagulant therapies or prescribed antiplatelet drugs were excluded. Also excluded from the study were individuals with preexisting systemic diseases, malignancy, any prior surgery, vasculitis, or factor V Leiden (1691G/A, rs6025) and prothrombin (20210G/A, rs1799963) mutations. Blood samples were collected from each individual by venipuncture immediately after admission to the hospital and prior to receiving any medication. Patients with VTE symptoms were investigated for confirmatory diagnosis and managed accordingly (supplemental Methods). Here, we attempted to investigate the possible association between alterations in diverse components related to the hemostatic system and thrombotic events at altitude.
Laboratory investigations
All markers relevant to the development of thrombotic events under the influence of HA hypoxia, as per our existing knowledge and support from the literature, have been included in this study.
Hematology, coagulation, and thrombophilia screening.
The hematology profile, consisting of hemoglobin (Hb), red blood cell (RBC) count, total platelet count, and total leukocyte count, was assessed. Prothrombin time, activated partial thromboplastin time, thrombin time, fibrinogen, von Willebrand factor (VWF), D-dimer, thrombin-antithrombin (TAT) complex, and plasmin-antiplasmin (PAP) complex were also investigated. Additionally, a complete thrombophilia screen, consisting of protein C and S deficiency, antithrombin III (AT) deficiency, clotting factors (V, VII, VIII, X), lupus anticoagulant, and activated protein C resistance, was performed, followed by a lipid profile for each individual.
Evaluation of soluble markers for platelet activation, endothelial cell activation, stress and inflammatory responses.
Platelet activation markers, such as plasma soluble P-selectin, CD40 ligand (CD40L), and PF4, were measured. The plasma levels of endothelial cell activation markers (intracellular adhesion molecule-1 [ICAM1], vascular cell adhesion molecule-1 [VCAM1], vascular endothelial growth factor [VEGF], VEGF receptor-3 [VEGFR3]/FLT4, Toll-like receptor-2 [TLR2], and E-selectin) were also determined. All markers were measured using sandwich enzyme-linked immunosorbent assay methods, as per the manufacturer’s protocols (R&D Systems), whereas E-selectin was measured using a bead-based flow cytometry assay (eBioscience) Heat shock protein-70 (HSP70) and HIF-1α were also analyzed by sandwich enzyme-linked immunosorbent assay and oligo-based colorimetric assay (R&D Systems), respectively. Inflammatory response molecules, consisting of 18 chemokines and cytokines, were measured using a bead-based flow cytometry assay (eBioscience). A detailed description of the methods used is provided in supplemental Methods.
Statistical analysis
Data were analyzed using IBM SPSS 21.0 and GraphPad Prism 7.03 software. Distribution of age classes and type of VTE manifestation are presented as absolute number plus percentage of the population in each group. Data are presented as median with interquartile range (IQR), mean with standard deviation, or mean with 95% confidence interval (CI), as appropriate. The number of individuals with absolute alterations in hematology, lipid, coagulation, and thrombophilia profiles, together with platelet activation, endothelial cell activation, stress, and inflammatory molecules, exceeding a threshold (defined as 90th percentile in SLPs) or falling below a threshold (defined as 10th percentile in SLPs) were compared using contingency analysis to calculate the relative strength of association (RA). Here, RA is defined as the degree of relationship between a causal factor and the occurrence of a disease. We evaluated RA as the ratio of proportions that explained how strongly the alteration in the studied parameter is associated with VTE incidences at HA. RA was calculated as the ratio of the percentages of HAPs and SLPs exhibiting alteration from the normal threshold cutoff. CI was calculated using the Koopman asymptotic score method. The data are presented as RA and 95% CI. Furthermore, we performed receiver operator characteristic (ROC) curve analysis to determine the influence or association of HA on/with each platelet and endothelial cell activation marker molecule. The sensitivity was plotted against 100% specificity, and the area under the curve (AUC) was estimated for each parameter used as an index of association between HA and VTE manifestation; a higher AUC reflects a greater association. CIs for the odds ratios, along with sensitivity and specificity, were calculated. P < .05 was considered statistically significant. Although we studied 54 parameters separately in the 2 groups, we opted not to make corrections to our P value. Although the Bonferroni correction controls for false positives (type I errors), the adjusted P value after applying the Bonferroni correction for our 54 studied parameters would be .00093. Here, applying corrections would become too conservative and might increase the risk of generating false negatives (type II errors). Thus, we opted not to apply the Bonferroni correction to avoid reducing the power of our study.
Results
Characteristics of the study population
The demographic characteristics of the patients, such as age, altitude of residence, duration of stay at HA, and clinical presentation, are shown in Table 1. The clinical presentation of HAPs and SLPs was heterogeneous and predominantly identified as cerebral venous thrombosis (CVT), deep vein thrombosis (DVT), and portal vein thrombosis (PVT). Furthermore, the distribution of VTE subtypes was comparable in HAPs and SLPs; this ruled out the possibility of a deviation in results due to unequal VTE types. The percentage of patients with CVT, DVT, and PVT was 26.42%, 67.92%, and 5.66%, respectively, in HAPs and 26.67%, 68.89%, and 4.44%, respectively, in SLPs (all P > .05), confirming successful matching for manifestation types.
Basic demographic and clinical characteristics and medical history of the study population
| All VTE patients (N = 98) | Study group | |||
|---|---|---|---|---|
| HAP (n = 53) | SLP (n = 45) | P | ||
| Age, median (IQR), y | 34 (30-41) | 33 (29-38) | 36 (31-3) | .025 |
| Altitude of residence, median (IQR), m | 4328.16 (3352.8-5852.16) | 335.28 (193.55-453.54) | <.0001 | |
| Duration of stay at HA, mo | 7.5 (4.3-10.9) | — | — | |
| Venous thrombosis type | ||||
| CVT | 26 (26.53) | 14 (26.42) | 12 (26.67) | 1.000 |
| DVT | 67 (68.37) | 36 (67.92) | 31 (68.89) | 1.000 |
| DVT proximal | 2 (2.98) | 1 (2.78) | 1 (3.23) | 1.000 |
| DVT distal | 47 (70.15) | 26 (72.22) | 21 (67.74) | .840 |
| DVT proximal + distal | 12 (17.91) | 7 (19.44) | 5 (16.13) | 1.000 |
| DVT + PTE | 6 (8.96) | 2 (5.56) | 4 (12.90) | .410 |
| PVT | 5 (5.10) | 3 (5.66) | 2 (4.44) | 1.000 |
| Diet | ||||
| Vegetarian | 39 (39.80) | 23 (43.40) | 16 (35.56) | .540 |
| Nonvegetarian | 59 (60.20) | 30 (56.60) | 29 (64.44) | .540 |
| Exposure to HA in previous 24 mo | 12 (12.25) | 12 (22.64) | 0 | .0004 |
| Hospitalization in previous 24 mo | 0 | 0 | 0 | — |
| Familial history of thrombosis | 0 | 0 | 0 | — |
Unless otherwise indicated, data are n (%).
—, no value; PTE, pulmonary thromboembolism.
HA exposure influences the age at which the VTE is induced
Next, we assessed the age distribution: 81.13% of the HAP population was ≤40 years of age, whereas only 62.22% of SLPs fell into this range. The median (IQR) age of 33 (29-38) years in HAPs was significantly lower than in their corresponding SLPs, which was 36 (31-43.5) years (Figure 1A). Likewise, patients with CVT, DVT, and PVT from HA were comparatively younger than their manifestation type–matched SLP counterparts (Figure 1B). Collectively, these data reveal that higher numbers of HA hypoxia–affected patients belonged to the younger age group compared with SLPs.
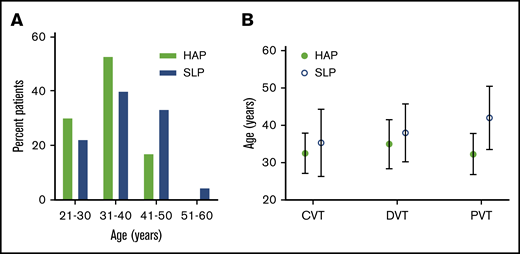
Age distribution of the study patients. (A) Age class distribution of VTE patients. (B) Median (standard deviation) age of patients from both study groups with CVT, DVT, and PVT.
Age distribution of the study patients. (A) Age class distribution of VTE patients. (B) Median (standard deviation) age of patients from both study groups with CVT, DVT, and PVT.
Exposure to HA exaggerates the hypercoagulative state
To investigate whether exposure to HA hypoxia facilitates the prothrombotic state, we compared hemogram, coagulative variables, thrombophilia, and lipid profiles of HAPs and SLPs. As shown in supplemental Table 1, Hb levels, RBCs, and platelet counts were considerably higher in HAPs than in SLPs. The relative percentage change in platelet count was 13.30% higher in HAPs than in SLPs (P = .001). Similarly, RBC count and Hb concentration were 7.7% and 4.1% higher in HAPs than in SLPs (P = .015 and .012, respectively). However, the contingency analysis demonstrated that only elevated platelet counts were significantly associated with HA hypoxia exposure, as confirmed by RA (4.46; 95% CI, 1.65-12.03; P = .0005; Table 2). Furthermore, extensive alterations in coagulation and thrombophilia were concomitantly linked to HA in the context of VTE episodes, as evidenced by RA and 95% CI for VWF antigen (3.18, 1.22-8.71), D-dimer (2.97, 1.13-8.19), TAT (2.97, 1.13-8.19), PAP (4.03, 1.59-10.79), factor V (3.18, 1.22-8.71), factor VII (4.67, 1.87-12.35), factor VIII (5.94, 2.44-15.48), and factor X (4.03, 1.59-10.79).
Effect of altitude on the plasma levels of hemostasis variables and markers of platelet, endothelial cell, stress, and inflammatory responses in HAPs and SLPs and their strength of association with HA-VTE
| HAPs (n = 53), n (%) | SLPs (n = 45), n (%) | RA (95% CI) | P | |
|---|---|---|---|---|
| Hematology | ||||
| Hb (>16.98 mg/dL) | 12 (22.64) | 4 (8.89) | 2.55 (0.88-7.35) | .099 |
| RBCs (>5.94 × 10¹²/L) | 6 (11.32) | 4 (8.89) | 1.27 (0.38-4.23) | .749 |
| Platelets (>278 × 109/L) | 21 (39.62) | 4 (8.89) | 4.46 (1.65-12.03) | .0005 |
| Total leukocytes (>8.24 × 10⁹/L) | 11 (20.75) | 4 (8.89) | 2.34 (0.80-6.83) | .159 |
| Lipid profile, mg/dL | ||||
| Total cholesterol (>260.80) | 2 (3.77) | 4 (8.89) | 0.42 (0.08-2.21) | .409 |
| Triglycerides (>385.40) | 3 (5.66) | 4 (8.89) | 0.64 (0.17-2.43) | .699 |
| High-density lipoprotein (<29.20) | 5 (9.43) | 4 (8.89) | 1.06 (0.33-3.48) | >.9999 |
| Low-density lipoprotein (>129.60) | 8 (15.09) | 4 (8.89) | 1.70 (0.58-5.06) | .538 |
| Coagulation profile | ||||
| Prothrombin time (<13.26 s) | 11 (20.75) | 4 (8.89) | 2.34 (0.85-6.63) | .159 |
| Activated partial thromboplastin time (<35.50 s) | 2 (3.77) | 3 (6.67) | 0.57 (0.10-3.24) | .659 |
| Thrombin time (<18.20 s) | 11 (20.75) | 3 (6.67) | 3.11 (1.01-9.98) | .079 |
| Fibrinogen (>356.40 mg/dL) | 12 (22.64) | 4 (8.89) | 2.55 (0.88-7.35) | .099 |
| D-dimer (>1.10 mg/L) | 14 (26.42) | 4 (8.89) | 2.97 (1.13-8.19) | .035 |
| VWF antigen (>163%) | 15 (28.30) | 4 (8.89) | 3.18 (1.22-8.71) | .021 |
| TAT complex (>0.19 ng/mL) | 14 (26.42) | 4 (8.89) | 2.97 (1.13-8.19) | .035 |
| PAP complex (>0.41 ng/mL) | 19 (35.85) | 4 (8.89) | 4.03 (1.59-10.79) | .002 |
| Thrombophilia profile, % | ||||
| Protein C (<19.60) | 5 (9.43) | 4 (8.89) | 1.06 (0.33–3.49) | >.999 |
| Protein S (<26.60) | 10 (18.87) | 4 (8.89) | 2.12 (0.76-6.10) | .247 |
| Antithrombin III (<45.80) | 7 (13.21) | 4 (8.89) | 1.49 (0.50-4.54) | .541 |
| Factor V (>137) | 15 (28.30) | 4 (8.89) | 3.18 (1.22-8.71) | .021 |
| Factor VII (>129.40) | 22 (41.51) | 4 (8.89) | 4.67 (1.87-12.35) | .0002 |
| Factor VIII (>131.20) | 28 (52.83) | 4 (8.89) | 5.94 (2.44-15.48) | <.0001 |
| Factor X (>140.40) | 19 (35.85) | 4 (8.89) | 4.03 (1.59-10.79) | .002 |
| Activated protein C resistance (positive) | 0 | 2 (4.44) | 0 (0-1.59) | .208 |
| Lupus anticoagulant deficiency (positive) | 22 (41.51) | 17 (37.78) | 1.10 (0.68-1.81) | .836 |
| Platelet activation molecules, ng/mL | ||||
| CD40L (>7.39) | 40 (75.47) | 5 (11.11) | 6.79 (3.15-15.78) | <.0001 |
| P-selectin (>103.60) | 18 (33.96) | 4 (8.89) | 3.82 (1.50-10.27) | .003 |
| PF4 (>58.04) | 42 (79.25) | 4 (8.89) | 8.92 (3.77-22.76) | <.0001 |
| Endothelial cell activation molecules, ng/mL | ||||
| ICAM1 (>47.01) | 29 (54.72) | 4 (8.89) | 6.16 (2.53-16) | <.0001 |
| VCAM1 (>23.32) | 45 (84.91) | 4 (8.89) | 9.55 (4.06-24.32) | <.0001 |
| VEGF (>16.79) | 24 (45.28) | 4 (8.89) | 5.09 (2.06-13.40) | <.0001 |
| FLT4/VEGFR3 (>65.75) | 46 (86.79) | 4 (8.89) | 9.76 (4.15-24.84) | <.0001 |
| TLR2 (>7.86) | 50 (94.34) | 4 (8.89) | 10.61 (4.54-26.92) | <.0001 |
| E-selectin (>1452) | 18 (33.96) | 4 (8.89) | 3.82 (1.50-10.27) | .003 |
| Stress molecules | ||||
| HIF-1α (>1.50-fold) | 45 (84.9) | 4 (8.89) | 9.55 (4.06-24.32) | <.0001 |
| HSP70 (>9.96 ng/mL) | 49 (92.5) | 4 (8.89) | 10.40 (4.44-26.40) | <.0001 |
| Cytokines and chemokines, ng/mL | ||||
| Interleukin-1α (>1.12) | 4 (7.55) | 3 (6.67) | 1.13 (0.27-4.79) | >.999 |
| Interleukin-1β (>9.26) | 14 (26.42) | 4 (8.89) | 2.97 (1.05-8.40) | .035 |
| Interleukin-4 (<0.50) | 1 (1.92) | 4 (8.89) | 0.22 (0.03-1.87) | .179 |
| Interleukin-6 (>0.23) | 12 (22.64) | 3 (6.67) | 3.40 (1.02-11.29) | .047 |
| Interleukin-8 (>6.52) | 4 (7.55) | 4 (8.89) | 0.85 (0.23-3.20) | >.999 |
| Interleukin-10 (<1.95) | 0 | 4 (8.89) | 0 (0-0.79) | .041 |
| Interleukin-12p70 (>0.39) | 14 (26.42) | 4 (8.89) | 2.97 (1.05-8.39) | .035 |
| Interleukin-13 (<0.19) | 3 (5.66) | 4 (8.89) | 0.64 (0.15-2.70) | .699 |
| Interleukin-17A (>0.68) | 9 (16.98) | 4 (8.89) | 1.91 (0.63-5.79) | .371 |
| Interferon-α (>0.42) | 7 (13.21) | 4 (8.89) | 1.49 (0.46-4.75) | .541 |
| Interferon-γ (>14.70) | 11 (20.75) | 4 (8.89) | 2.34 (0.85-6.63) | .159 |
| Tumor necrosis factor-α (>1.18) | 14 (26.42) | 4 (8.89) | 2.97 (1.05-8.39) | .035 |
| Latency associated protein (<20.65) | 4 (7.55) | 4 (8.89) | 0.85 (0.23-3.20) | >.999 |
| Granulocyte colony-stimulating factor (>0.54) | 10 (18.87) | 4 (8.89) | 2.12 (0.71-6.31) | .247 |
| Monocyte chemoattractant protein-1 (>0.60) | 7 (13.21) | 4 (8.89) | 1.49 (0.46-4.75) | .541 |
| Interferon-γ–induced protein-10 (>0.24) | 14 (26.42) | 4 (8.89) | 2.97 (1.05-8.39) | .035 |
| Macrophage inflammatory protein-1α (>2.04) | 9 (16.98) | 4 (8.89) | 1.91 (0.63-5.79) | .371 |
| Macrophage inflammatory protein-1β (>3.33 ng/mL) | 5 (9.43) | 4 (8.89) | 1.06 (0.30–3.72) | >.999 |
HA environment causes greater RA between VTE manifestation and platelet and endothelial cell activation markers
To scrutinize the plausible effects of HA exposure on platelet and endothelial cell activation in the studied VTE patients, we compared plasma levels (ng/mL) of these markers in HAPs and SLPs. Levels of soluble P-selectin (median, 61.23; IQR, 52.09-124.30), CD40L (8.64, 7.52-11.49), and PF4 (60.91, 58.69-62.93) in HAPs were significantly elevated compared with their levels in SLPs (32.95, 22.34-66.34; 6.14, 3.36-7.06; and 51.18, 45.93-54.9, respectively; P < .0001). Similarly, median concentrations (ng/mL) of ICAM1 (47.43), VCAM1 (27.68), VEGF (15.82), VEGFR3/FLT4 (76.4), TLR2 (8.53), and E-selectin (1120) in HAPs were higher compared with SLPs (38.23, 15.83, 11.74, 60.9, 6.1, and 839, respectively) (supplemental Table 1). Of note, the observed RA score > 2.75 suggests a substantial association between these examined molecules and exaggerated VTE episodes at HA (Table 2).
Alterations in the markers of stress response are correlated with platelet and endothelial cell activation in altitude-induced VTE
HAPs exhibited ∼2.5-fold higher plasma concentrations of HIF-1α and HSP70 relative to SLPs (supplemental Table 1). These 2 stress molecules were also found to be significantly associated with HA hypoxia, with an RA of 9.55 (95% CI, 4.06-24.32) and 10.40 (95% CI, 4.44-26.40), respectively (Table 2). Furthermore, the expression pattern of HIF-1α and HSP70 was found to be positively correlated (P = .01) with those of platelet and endothelial activation markers in the context of HA exposure (supplemental Figure 1).
We also investigated the plasma level of 18 cytokines and chemokines in study groups (supplemental Table 1). We observed increases in proinflammatory cytokines/chemokines in HAPs compared with SLPs; however, increased expression of few anti-inflammatory molecules (interleukin-4 [IL-4] and IL-13) was also observed in HAPs. Contingency analysis crude data suggest a strong relative association (P < .05) for IL-1β, IL-6, IL-12p70, IL-17A, interferon-α, interferon-γ, tumor necrosis factor-α, and latency-associated protein with HA hypoxia attributable to an accelerated prothrombotic state at altitude.
HA environment alters a greater number of parameters associated with hemostasis
Interestingly, of 54 parameters, HAPs expressed a higher number of altered parameters in comparison with SLPs. More than 95% of HAPs presented with ≥10 altered parameters, whereas 57% presented with ≥15 altered parameters (Figure 2A). In comparison, SLPs presented with only up to 14 altered parameters, and only 7% expressed >10 altered parameters.
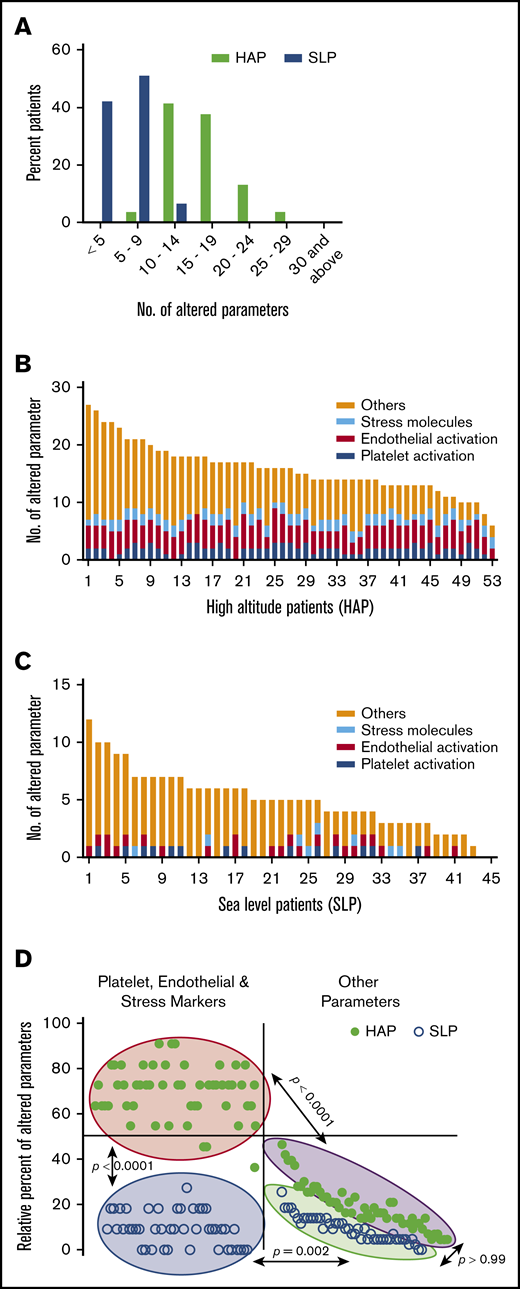
Distribution of altered parameters in study patients. (A) Distribution of patients according to number of altered parameters. Patient-wise distribution of parameters altered from threshold cutoff in the HAP (B) and SLP (C) study groups. (D) Clustered distribution of the percentage of altered parameters in study groups. Filled circles represent HAP. Open circles represent SLP. Other parameters consist of hemostasis and inflammatory response.
Distribution of altered parameters in study patients. (A) Distribution of patients according to number of altered parameters. Patient-wise distribution of parameters altered from threshold cutoff in the HAP (B) and SLP (C) study groups. (D) Clustered distribution of the percentage of altered parameters in study groups. Filled circles represent HAP. Open circles represent SLP. Other parameters consist of hemostasis and inflammatory response.
Next, we assessed the hyperresponsiveness of individuals toward HA. Parameters with an absolute alteration from the cutoff value were evaluated in the HAP and SLP groups (supplemental Table 2). The distribution of altered parameters plotted in rank order for each HAP and SLP shows the hyperactivation of ∼70% of 11 markers for platelet, endothelial, and stress in HAPs, whereas <10% of these markers were found to be activated in SLPs (Figure 2B-C). Comparing the tails of the number of altered parameters in each individual, the means for the markers of platelet, endothelial, and stress activation were 7.66 (95% CI, 7.31-8.02) for HAPs and 1.02 (95% CI, 0.78-1.27) for SLPs. Moreover, the remaining parameters (hematology, coagulation, thrombophilia, and inflammatory response) were 8.23 (7.06-9.4) in HAPs and 3.98 (3.26-4.69) in SLPs. Further, we demonstrated the extent of alterations in platelet activation, endothelial cell activation, and stress response molecules in the 2 study groups; the HAP and SLP groups showed 2 separate clusters for these markers (P < .0001). Interestingly, the remaining parameters in HAPs and SLPs were also clustered differently (P < .0001; Figure 2D).
HA exposure results in differences in the marker levels between VTE types, demonstrating P-selectin as a discriminator of DVT and CVT
We subsequently evaluated the levels of studied markers within the entire study group (supplemental Figure 2). Table 3 shows the differences in the median marker levels among VTE types within the 2 study groups. Strikingly, P-selectin exclusively showed significantly higher concentrations in DVT patients vs CVT patients in both study groups. The median difference was 16.11 ng/mL (95% CI, 1.22-59.43; P = .02) in HAPs and 16.14 ng/mL (95% CI, 5.13-36.43; P = .006) in SLPs. The remaining molecules showed insignificant differences in median levels in both types of VTE. Of note, PVT was excluded from this evaluation because very few patients (<5) were assigned to this category.
Within-group differences in the markers of platelet activation, endothelial cell activation, and stress response
| HAP group, DVT (n = 36) vs CVT (n = 14) | SLP group, DVT (n = 31) vs CVT (n = 12) | |
|---|---|---|
| P-selectin, ng/mL | 16.11 (1.22-59.43)* | 16.14 (5.13-36.43)† |
| CD40L, ng/mL | 1.01 (−0.42 to 2.72) | 0.34 (−0.58 to 1.9) |
| PF4, ng/mL | 1.46 (−1.09 to 5.23) | 3.36 (−0.27 to 7.11) |
| ICAM1, ng/mL | 1.46 (−3 to 6.08) | 1.48 (−1.6 to 6.88) |
| VCAM, ng/mL | −0.03 (−3.69 to 2.75) | 1.16 (−0.71 to 3.6) |
| VEGF, ng/mL | 0.41 (−1.05 to 2.46) | 1.22 (−0.66 to 3.09) |
| FLT4/VEGFR3, ng/mL | 3.5 (−1.25 to 9.75) | 0.75 (−1.75 to 4.75) |
| TLR2, ng/mL | −0.07 (0.59 to 0.27) | 0.15 (−0.15 to 0.69) |
| E-selectin, ng/mL | 321.1 (−397.4 to 836.3) | −120.5 (−374.9 to 181.4) |
| HSP70, ng/mL | −2.42 (−11.25 to 4.67) | −0.83 (−2.08 to 0.5) |
| HIF-1α, fold expression | 0.34 (−0.16 to 0.94) | −0.06 (−0.32 to 0.18) |
Data are differences in the median (95% CI).
Significant at P = .01.
Significant at P = .001.
Platelet and endothelial cell hyperactivation is extensively associated with HA-induced VTE
To further study HA-associated VTE and how it differs from VTE on the plains closer to sea level, we performed ROC analysis by assigning SLPs as study controls and HAPs as study cases (Figure 3A-B). We observed good overall discrimination on the basis of obtained results with AUC > 0.7 except E-selectin (AUC, 0.62; 95% CI, 0.5-0.73; P < .05). AUC was the highest for TLR2 (AUC, 0.98; 95% CI, 0.96-1.0; P < .0001). The sensitivity and specificity percentages were also evaluated (supplemental Table 3). Among the platelet activation markers, the sensitivity and specificity for CD40L were 76% (95% CI, 62-86) and 89% (95% CI, 76-96), respectively. The sensitivity for PF4 was higher (81%; 95% CI, 68-91) than for P-selectin (34%; 95% CI, 22-48), but the specificity was the same (91%; 95% CI, 79-98). Among the endothelial activation markers, ICAM1, VCAM1, and E-selectin had sensitivity of 57% (95% CI, 42-70), 85% (95% CI, 72-93), and 35% (95% CI, 22-50), respectively, with identical specificity (91%; 95% CI, 79-98). Similarly, TLR2 and VEGF had sensitivity of 94% (95% CI, 84-99) and 45% (95% CI, 32-60), with the same specificity (89%; 95% CI, 76-96). However, VEGFR3/FLT4 exhibited a sensitivity and specificity of 87% (95% CI, 73-95). Further, matrix correlation analysis identified a significant correlation between markers molecules, with P < .01 (Figure 3C).

Association between HA hypoxia exposure and severity of prothrombotic episodes. ROC curve depicting the association of HA with VTE episodes as discrimination between HAPs (A) and SLPs (B) in terms of platelet and endothelial activation markers. (C) Correlation among platelet and endothelial activation molecules.
Association between HA hypoxia exposure and severity of prothrombotic episodes. ROC curve depicting the association of HA with VTE episodes as discrimination between HAPs (A) and SLPs (B) in terms of platelet and endothelial activation markers. (C) Correlation among platelet and endothelial activation molecules.
Discussion
This extensive study compared clinically confirmed cases of VTE from 2 ethnicity-matched groups differing only in altitude exposure and explored HA as an independent risk factor for predisposition toward a thrombotic phenotype. Although several clinical reports, including case reports and cohort studies, suggested the prothrombotic bent of hypoxia at HA, a few studies have instead supported its nonprothrombogenic nature.10,18,19,21,25,26,29-34 Thus, with the paucity of adequate information about any underlying connection between HA and a shift in coagulation mechanisms, we focused on the identification of factors that could ascertain the crucial role of HA in the aggravation of VTE events and, consequently, help to establish strategies to reduce these life-threatening episodes at altitude. The present study evaluated 54 markers of parameters that have relevance to the development of thrombotic events under the influence of HA hypoxia as per our existing knowledge with support from the literature.
We observed that the majority of patients in the HAP group were younger than 40 years of age and comparatively younger than SLPs, although this observation is not in accordance with some previous findings. Earlier, White summarized that the risk of VTE increases exponentially from <5/100 000 at age 10 years to ∼500/100 000 at age 80 years, with immobility and hospitalization as major contributors for the manifestation at advanced age.35 In this study, we included only physically active VTE patients with no history of hospitalization to eliminate the immobility factor. Although 1 study suggested that thrombotic episodes in young adults are comparatively rare, and more risk factors are required to precipitate thrombosis at a younger age,36 alterations in the thrombophilia profile were found to be prominent risk factors for VTE at a young age.37,38 However, none of these studies were from HA regions. The present study suggested various altered hemostasis variables at HA as plausible risk factors for VTE episodes at a young age, thereby exclusively associating VTE incidence at altitude with age during the event.
We evaluated hemostatic variables in blood samples collected from all patients prior to any medication and immediately after their hospitalization. Elevated levels of Hb, RBC counts, platelet counts, and fibrinogen, accompanied by enhanced plasma concentrations of D-dimer and VWF in HAPs, were in agreement with earlier reports,12-14,39-41 suggesting augmented coagulation in healthy persons exposed to hypobaric hypoxia, simulated at altitude ∼2400 m22 or after a long airplane flight.29 Interestingly, alterations in platelet count, as evidenced by contingency analysis, differentiated VTE at HA from VTE on the plains. The significant increase in fibrinogen, VWF, and clotting factors V, VII, VIII, and X in HAPs suggests the acute-phase reactant behavior of these coagulation proteins in stress-like conditions, such as HA hypoxia. Furthermore, enhanced thrombin generation (increased TAT level), along with activation of the fibrinolytic system (increased PAP level), in HAPs has been observed during HA stress.42-45 Also, thrombin activation likely contributes to amplification of the inflammatory response and favors a thrombogenic response by releasing CD40 ligand.46 In the present study, relative deficiencies in protein C, protein S, and AT were also observed in HAPs and SLPs, which, again is in accordance with earlier reports suggesting a higher prevalence of protein S deficiency in Asian populations compared with other risk factors, such as protein C and AT.47-50 However, our study demonstrated greater protein S deficiency in HAPs compared with SLPs. This was in accordance with a report of protein S deficiency in an animal model resulting from hypoxia exposure.50 Furthermore, AT deficiency leads to inhibition of prostacyclin release from endothelial cells, leading to platelet activation and aggregation and neutrophil tethering to blood vessels, and it increases the production of various cytokines and chemokines from endothelial cells.51
Our study also revealed enhanced platelet and endothelial cell activation at HA. Notably, the increase in platelet and endothelial cell activation marker levels, as reflected by increased P-selectin, ICAM1, and VCAM1 expression, suggests their crucial role in the intensification of endothelial layer permeability.52 Surprisingly, P-selectin was found to be upregulated in VTE patients at HA compared with VTE patients on the plains, and its level was significantly different in CVT and DVT patients from HA, as well as in those closer to sea level. Interestingly, our previous study on rodents exposed to hypobaric hypoxia (HA simulation) had also revealed platelet hyperreactivity and elevated P-selectin levels in the hypoxia-induced prothrombotic phenotype.27 Further investigation of P-selectin in a larger cohort of VTE patients is necessary to establish a stronger association and causative function of this marker. This might also give us an effective molecule that could help in the differentiation between VTE types, such as DVT and CVT. We also observed upregulation of CD40L and PF4 in HAPs compared with SLPs. CD40L is thought to interact with activated platelets to promote adhesion molecule expression, and it induces vascular cells to express P-selectin, which is quintessential for platelet and endothelial surface interaction during thrombogenesis.53-56 Although platelet hyperactivation or reactivity is associated with hypoxia, studies measuring platelet count still dominate over those evaluating platelet activation molecules in thrombosis under hypoxia.57,58 In this study, we demonstrated that exposure to HA hypoxia affects the platelet count and alters platelet activation markers. Elevated platelet activation molecules are suggested to couple with Weibel-Palade bodies and induce the acute release of P-selectin and VWF, promoting the coagulation process.59,60 Further, the correlation between platelet and endothelial activation molecules that transforms the endothelial phenotype to prothrombotic in the vessel wall during stress-like environments, such as inflammation or hypoxia, has been witnessed in the presence of platelet-binding and stimulating agents, such as VWF.61-64
Our study also observed higher concentrations of HIF-1α and HSP70 in HAPs compared with SLPs, suggesting the significance of the higher stress response toward VTE manifestations in the presence of a hypoxic environment. Accumulating evidence indicates that NF-κB and HIF-1α are linked in a regulatory loop that substantiates the involvement of hypoxia in innate immunity and inflammation.65 Additionally, we observed alterations in the concentrations of inflammatory cytokines and chemokines in HAPs. Reports suggest that hydroxylases, which are normally inhibited during hypoxia, modulate inflammation via posttranslational modifications in the IL-1β pathway,66 with higher levels of circulatory proinflammatory cytokines, even in healthy volunteers or during acute mountain sickness on ascension to HA.67 Intriguingly, our study also observed increased levels of a few anti-inflammatory molecules, such as IL-4 and IL-13. Perhaps higher concentrations of anti-inflammatory cytokines in HAPs counterbalanced the effect of elevated proinflammatory molecules at HA. Previously, our group had shown enhanced expression of IL-1β in the presence of HIF-1α that potentially accelerates the prothrombotic state through the NLRP3 inflammosome.28 Thus, HA hypoxia–induced hypercoagulation and HA hypoxia–associated inflammation converge to present an interrelated role of hypoxia-induced inflammatory changes in hypercoagulation despite being of separate lineage.
A probable limitation of this study is the number of subjects included. The hostile and inhospitable climatic conditions and logistic limitations, such as air evacuation of patients from HA, along with the administration of emergency medication before sample collection, restricted the population size. A large cohort study is required to validate the distinct profile of HA VTE. Enrollment of only men in this pilot study is another limitation of our study, although this avoids potential confounders in the form of sex hormones and oral contraceptives in females that are considered additional risk factors for VTE.5,68 Therefore, the observations from the present study cannot be generalized, and the inclusion of females with unprovoked VTE may provide an improved study design in the future that results in appropriate sex-stratified outcomes.
In conclusion, our results validate the prothrombotic nature of HA and identify serious concerns about the impact of HA exposure on vascular health at a young age. Also, the comprehensive analysis of such a large number of parameters in our study may assist in understanding the underlying causative factors of thrombotic episodes with higher frequency at HA. The present study underlines the importance of screening various markers as probable health safety measures before and during HA hypoxia exposure to make a real impact on the control of hypoxia-induced VTE.
Acknowledgments
The authors thank all of the patients who participated. Shashi Bala Singh, Iti Garg, and Manish Sharma are acknowledged for help during the study. The authors thank Emmanuel J. Favaloro and Aastha Mishra for editing the manuscript and the Director General of Armed Forces Medical Sciences, India for approving the study.
This work was supported by the Defence Research and Development Organization (Project SL-10/DIP-255).
Authorship
Contribution: A.P. and M.Z.A. designed the study, performed statistical analyses, wrote the first draft of the manuscript, and created the figures and tables; M.Z.A. supervised the study; A.P., N.B., T.T., T.C., A.S., and N.G. collected samples and acquired study data; A.P., N.B., T.T., A.S., N.G., and B. Kumari performed laboratory investigations; T.C., V.N., B. Kumar, and M.Z.A. provided methodological advice; A.P., N.B., T.T., and M.Z.A. interpreted the data; A.P., T.T., A.S., N.G., B. Kumar, and M.Z.A. edited the manuscript; and all authors commented on and approved the final version of the manuscript.
Conflict-of-interest disclosure: A.P. is a senior research fellow at Council of Scientific and Industrial Research/University Grants Commission. The remaining authors declare no competing financial interests.
Correspondence: Mohammad Zahid Ashraf, Department of Biotechnology, Jamia Millia Islamia, New Delhi 110025, India; e-mail: mohammadzashraf@gmail.com and zashraf@jmi.ac.in.

