

Key Points
Low-dose IL-2 is well tolerated and is a promising therapy for steroid-refractory cGVHD in children.
IL-2 dose escalation above 1 million IU/m2 per day is not well tolerated and does not improve CD4Treg expansion or clinical responses.

Abstract
Low-dose interleukin-2 (IL-2) therapy for chronic graft-versus-host disease (cGVHD) generates a rapid rise in plasma IL-2 levels and CD4+CD25+CD127−Foxp3+ regulatory T-cell (CD4Treg) proliferation, but both decrease over time despite continued daily administration. To test whether IL-2 dose escalation at the time of anticipated falls in plasma levels could circumvent tachyphylaxis and enhance CD4Treg expansion, we conducted a phase 1 trial in 10 adult and 11 pediatric patients with steroid-refractory cGVHD (www.clinicaltrials.gov: NCT02318082). Daily IL-2 was initiated in children and adults (0.33 × 10⁶ and 0.67 × 10⁶ IU/m2 per day, respectively). Dose escalations were scheduled at weeks 2 and 4 to a maximum dose of 1 × 10⁶ IU/m2 per day in children and 2 × 10⁶ IU/m2 per day in adults. Patients continued at their maximum tolerated dose (MTD) until week 8. Children tolerated IL-2 dose escalation with partial responses (PRs) in 9 of 11 patients (82%) at multiple cGVHD sites, including lung. Patient-reported outcome scores for skin and lung improved significantly in pediatric patients. In contrast, 5 of 10 adults required dose reduction, and only 2 of 7 evaluable patients (29%) had PRs at week 8. CD4Tregs and natural killer cells expanded in both cohorts without significant changes in conventional CD4+ T cells (Tcons) or CD8+ T cells. Children achieved a higher median CD4Treg/Tcon ratio at week 8 (0.4 vs 0.18, P = .02) despite lower IL-2 doses. We show for the first time that low-dose IL-2 is safe and effective in children with advanced cGVHD. In adults, escalation above the previously defined MTD did not improve CD4Treg expansion or clinical response.
Introduction
Chronic graft-versus-host disease (cGVHD) is the leading cause of nonrelapse morbidity and mortality following conventional allogeneic hematopoietic stem cell transplantation (HSCT), occurring in 60% to 70% of adults and 20% to 50% of children surviving >100 days posttransplant.1-3 Systemic steroids are the first-line therapy for cGVHD but have limited efficacy and considerable toxicity. The effects of prolonged steroid therapy on growth and bone density are particularly significant in children.4 Second-line treatment options are limited, and steroid-refractory (SR) cGVHD presents a major therapeutic challenge.
Patients with active cGVHD have poor reconstitution of CD4+CD25+FOXP3+ regulatory T cells (CD4Tregs), which normally make up 5% to 10% of the circulating CD4+ T-cell population and function to suppress auto- and alloreactive immune responses.5-9 Preferential augmentation of CD4Tregs may be helpful in the control of cGVHD. We have used an in vivo CD4Treg-expansion approach with low-dose interleukin-2 (IL-2), which promotes thymic differentiation and peripheral proliferation, survival, and function of CD4Tregs.10,11 Prior adult cGVHD trials established that daily subcutaneous administration of low-dose IL-2 at a maximum tolerated dose (MTD) of 1 × 10⁶ IU/m2 per day was safe and well tolerated for prolonged periods. Importantly, this regimen induced preferential CD4Treg expansion with objective partial responses (PRs) in 50% to 60% of adults with SR cGVHD.12-14
During fixed-dose IL-2 therapy, plasma IL-2 levels rose rapidly by week 1 but then declined as the absolute CD4Treg count rose.15 This may reflect increased IL-2 sequestration via binding to high-affinity IL-2 receptors constitutively expressed on expanded circulating CD4Tregs. We hypothesized that IL-2 dose escalation at the time of the anticipated fall in plasma levels could sustain higher plasma IL-2 levels and further augment CD4Treg expansion without inducing conventional CD4 T-cell (CD4Tcon) activation. We conducted a phase 1 study of individual patient IL-2 dose escalation in children and adults with SR cGVHD. Because there was no previous experience with low-dose IL-2 for cGVHD in pediatric patients, treatment in this cohort was initiated at 0.33 × 10⁶ IU/m2 per day and escalated to a final dose of 1.0 × 10⁶ IU/m2 per day, the previously established MTD for adults. Daily IL-2 was initiated at 0.67 × 10⁶ IU/m2 per day in the adult cohort and escalated to a maximum dose of 2 × 10⁶ IU/m2 per day, twice the previously established MTD. We reasoned that this dose, which exceeded MTD in the prior dose-finding study, would be tolerable because uptake of IL-2 by the expanding CD4Tregs would lower the effective plasma concentration. We show for the first time that low-dose IL-2 is safe in children with advanced SR cGVHD and can lead to clinically meaningful responses while enabling significant reduction or discontinuation of corticosteroids. However, dose escalation above the fixed-dose MTD was not tolerated in adults and did not improve CD4Treg expansion or clinical response relative to fixed daily dosing.
Methods
Phase 1 clinical protocol
This was a single-arm single-center phase 1 trial to assess the safety and MTD of 8-week individual patient dose-escalated IL-2 in patients with SR cGVHD. Eligibility criteria included age ≥2 years; active cGVHD, despite prednisone ≥0.25 mg/kg per day for ≥4 weeks; stable prednisone dose without addition or discontinuation of other immunosuppressive medications for ≥4 weeks prior; Karnofsky/Lansky performance status ≥60%; and adequate renal, hepatic, pulmonary, and cardiac function. However, patients with hepatic or pulmonary dysfunction due to cGVHD were eligible. Exclusion criteria included prednisone >1 mg/kg per day; concurrent calcineurin inhibitor plus sirolimus; history of thrombotic microangiopathy; T-cell–targeted therapy during the 100 days prior; and active malignancy or uncontrolled infection.
Daily subcutaneous IL-2 (aldesleukin [Proleukin]) was initiated at dose-level A (0.67 × 10⁶ IU/m2 per day in adults and 0.33 × 10⁶ IU/m2 per day in children). Dose escalations occurred at week 2 and week 4 (Figure 1A). In the absence of dose-limiting toxicities (DLTs) or severe non-DLT adverse events (AEs), patients continued their individual MTD IL-2 thereafter. Participants with clinical benefit at the week-8 assessment could continue daily IL-2 indefinitely. Dose modification of corticosteroids and other immunosuppressive medications was permitted after week 8. Patients were evaluable for toxicity at any time during the 8-week treatment period and for response after ≥4 weeks of IL-2. The trial was approved by the Dana-Farber/Harvard Cancer Center Institutional Review Board (www.clinicaltrials.gov: NCT02318082). Prior written informed consent was obtained per the Declaration of Helsinki.
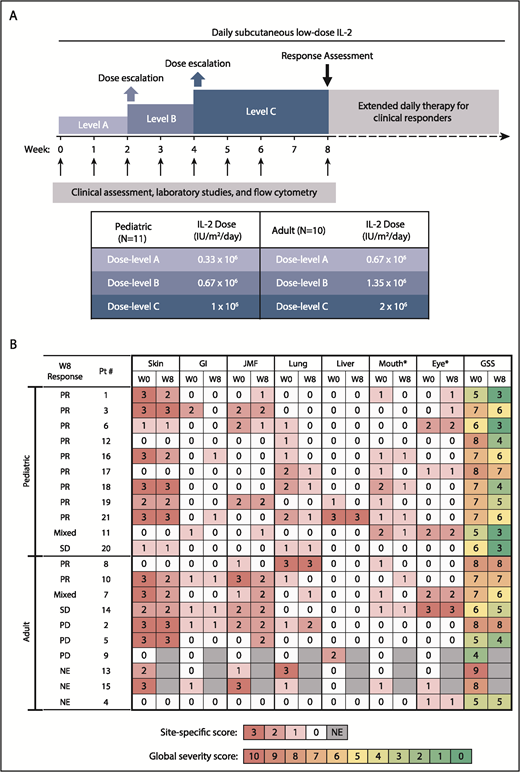
Study design and clinical response. (A) Study design. (B) Skin, gastrointestinal (GI), joint/muscle/fascia (JMF), lung, liver, mouth, and eye cGVHD scores at baseline (W0) and at week 8 (W8). *Oral and ocular sites were not included in determination of response, because additional topical therapy was permitted for those sites. GSS, global severity score; NE, not evaluable; PD, progressive disease; SD, stable disease.
Study design and clinical response. (A) Study design. (B) Skin, gastrointestinal (GI), joint/muscle/fascia (JMF), lung, liver, mouth, and eye cGVHD scores at baseline (W0) and at week 8 (W8). *Oral and ocular sites were not included in determination of response, because additional topical therapy was permitted for those sites. GSS, global severity score; NE, not evaluable; PD, progressive disease; SD, stable disease.
Clinical assessments
cGVHD assessments using 2014 National Institutes of Health consensus criteria16 were performed at baseline, after 8 weeks of IL-2 therapy, and every 16 weeks during extended-duration therapy until 1 year from the start of IL-2 treatment or when IL-2 was stopped. Laboratory testing and flow cytometry were performed at baseline and on weeks 1, 2, 3, 4, 5, 6, and 8 and every 8 weeks while receiving extended-duration IL-2. Patient-reported outcomes (PROs) were assessed using the Lee cGVHD Symptom Scale.17
Flow cytometry analysis
CD4Tregs were defined as CD3+CD4+CD25med-highCD127low, CD4Tcons were defined as CD3+CD4+CD25neg-lowCD127med-high, and natural killer (NK) cells were defined as CD56+CD3−. For intracellular marker analysis, CD4Tregs, CD4Tcons, and CD8 T cells, were defined as CD3+CD4+FOXP3+, CD3+CD4+FOXP3−, and CD3+CD4−CD8+, respectively.8 Subsets within CD4Tregs were defined as naive T cells (CD45RA+CD62L+), central memory (CM) T cells (CD45RA−CD62L+), and effector memory T cells (CD45RA−CD62L−). Within CD4 T cells, coexpression of CD45RA and CD31 identified recent thymic emigrants (RTEs).18,19 Apoptosis susceptibility was assessed by intracellular B-cell lymphoma 2 (BCL-2) expression.20 Programmed death-1 (PD-1) expression was detected using the PE-conjugated anti–PD-1 (eBioJ105; eBioscience) monoclonal antibody. Labeled cells were acquired in a FACSCanto II flow cytometer and analyzed using BD FACSDiva (both from BD Biosciences) and FlowJo software (TreeStar). Gating and analysis strategies have been described previously.8,13
Plasma cytokine measurements
Plasma IL-2 concentrations were measured by High Sensitivity ELISA (eBioscience) and soluble IL-2 receptor-α concentrations were measured by Quantikine ELISA (R&D Systems), per the manufacturer’s instructions, using cryopreserved plasma samples. Additional plasma cytokine and chemokine concentrations were assessed using the Cytokine 25-Plex Human Panel (Invitrogen, LHC0009M; Thermo Fisher Scientific). Assays were performed in duplicate according to the manufacturer’s recommended protocol, analyzed using the Luminex FlexMAP 3D system, and quantified by standard curve extrapolation.
T-cell receptor β repertoire analysis
Cryopreserved peripheral blood mononuclear cells from 4 pediatric patients (patients 1, 6, 11, and 12; supplemental Table 1) were sorted into CD4Tregs, CD4Tcons, and CD8 T cells. Genomic DNA was extracted (QIAGEN) from the purified populations. Survey-level T-cell receptor β (TCRβ) sequencing was performed using the ImmunoSEQ platform, with subsequent analysis using algorithms developed by Adaptive Biotechnologies.21 Prior to TCRβ repertoire analysis, all samples were normalized using the random sampling method22 to the same number of productive reads (1000), because various reads can affect the diversity scores. After normalization, the Hill-based diversity profile (α = 5) was calculated as a measure of TCRβ repertoire diversity.23 The diversity values were log2 transformed.
Statistical analysis
Baseline characteristics were reported descriptively. Immunologic parameters were analyzed descriptively and graphically and compared using the Wilcoxon rank-sum test for group comparisons and the Wilcoxon signed-rank test for paired comparison. Overall survival (OS) and progression-free survival (PFS) were estimated using the Kaplan-Meier method. The log-rank test was used for group comparisons of Kaplan-Meier estimates. Time-to-events were measured from study enrollment to death (OS) or to death/disease progression (PFS), whichever occurred first. Testing was 2-sided at the significance level of 0.05. Multiple comparisons were not adjusted. Analyses were performed using SAS 9.3 (SAS Institute Inc., Cary, NC) and R v2.13.2 (the CRAN project).
Results
Patient characteristics
Twenty-one participants (10 adult, 11 pediatric) were enrolled between February 2015 and October 2017 (Table 1). Median ages were 57 and 12 years for the adult and pediatric cohorts, respectively. Median time since cGVHD onset was 2 years in the adult cohort vs 1.1 years in the pediatric cohort, but the difference was not statistically different (P = .17). At enrollment, adult and pediatric patients had similar number of sites of cGVHD involvement (3.5 vs 3, P = .58) and number of prior systemic cGVHD therapies (3 vs 2, P = .11). Median follow-up in all survivors was 32 months (range, 18-48).
Patient and transplant characteristics
| Adult (n = 10) | Pediatric (n = 11) | All (N = 21) | P | |
|---|---|---|---|---|
| BMT to study, median (range), y | 3.6 (1-12.1) | 1.8 (1-4.5) | 2.4 (1-12.1) | .07 |
| cGVHD onset to study, median (range), y | 2.0 (0.1-11.8) | 1.1 (0.1-3) | 1.5 (0.1-11.8) | .17 |
| No. of cGVHD sites involved, median (range) | 3.5 (1-6) | 3 (1-4) | 3 (1-6) | .58 |
| No. of prior cGVHD therapies, median (range) | 3 (1-6) | 2 (1-4) | 2 (1-6) | .11 |
| NIH consensus global cGVHD severity, n (%) | .34 | |||
| Mild | 1 (10) | 0 (0) | 1 (5) | |
| Moderate | 5 (50) | 9 (82) | 14 (67) | |
| Severe | 4 (40) | 2 (18) | 6 (28) | |
| Daily prednisone dose at enrollment, median (range), mg/kg* | 0.3 (0-0.6) | 0.5 (0-1) | 0.3 (0-1) | .06 |
| Prior grade I-IV acute GVHD, n (%) | 6 (60) | 6 (54.5) | 12 (57.1) | 1.0 |
| Age, median (range), y | 57 (33-71) | 12 (2-23) | 23 (2-71) | <.0001 |
| Patient sex, n (%) | .36 | |||
| Male | 6 (60) | 9 (81.8) | 15 (71.4) | |
| Female | 4 (40) | 2 (18.2) | 6 (28.6) | |
| Primary disease, n (%) | .11 | |||
| AML | 2 (20) | 2 (18.2) | 4 (19.0) | |
| CLL | 2 (20) | 0 (0) | 2 (9.5) | |
| CML | 1 (10) | 0 (0) | 1 (4.8) | |
| Hodgkin disease | 1 (10) | 0 (0) | 1 (4.8) | |
| Anemia/red cell disorder | 0 (0) | 2 (18.2) | 2 (9.5) | |
| Immunodeficiency | 0 (0) | 1 (9.1) | 1 (4.8) | |
| ALL | 0 (0) | 5 (45.6) | 5 (23.8) | |
| MDS | 1 (10) | 1 (9.1) | 2 (9.5) | |
| NHL | 3 (30) | 0 (0) | 3 (14.3) | |
| Conditioning regimen intensity, n (%) | .002 | |||
| Myeloablative | 2 (20) | 10 (90.9) | 12 (57.1) | |
| Nonmyeloablative | 8 (80) | 1 (9.1) | 9 (42.9) | |
| HLA molecular typing (A, B, C, DRB1), n (%) | .16 | |||
| Matched unrelated | 8 (80) | 5 (45.4) | 13 (61.9) | |
| Matched related | 2 (20) | 3 (27.3) | 5 (23.8) | |
| Mismatch unrelated | 0 (0) | 3 (27.3) | 3 (14.3) | |
| Patient or donor CMV serostatus, n (%) | .15 | |||
| Positive | 1 (10) | 5 (45.5) | 6 (28.6) | |
| Graft source, n (%) | <.0001 | |||
| Bone marrow | 0 (0) | 11 (100) | 11 (52.4) | |
| PBSC | 10 (100) | 0 (0) | 10 (47.6) |
ALL, acute lymphoblastic leukemia; AML, acute myelogenous leukemia; BMT, bone marrow transplantation; CLL, chronic lymphocytic leukemia; CML, chronic myelogenous leukemia; CMV, cytomegalovirus; MDS, myelodysplastic syndrome; NHL, non-Hodgkin lymphoma; NIH, National Institutes of Health; PBSC, peripheral blood stem cell.
One pediatric patient and 1 adult patient were SR but were already weaned off systemic steroids at study entry.
Safety and tolerability
All 21 patients who started IL-2 were evaluable for safety. During the initial 8-week period, DLTs occurred in 3 adult patients: 2 were attributed to IL-2 (grade-3 transaminitis and grade-2 constitutional AE of flu-like symptoms) and 1 was unrelated to IL-2 (grade-3 infection). Two additional adult patients required IL-2 dose reduction for non-DLT constitutional AEs (flu-like symptoms/fatigue/malaise and arthralgia/myalgia), and another 2 adult patients came off study prior to week 8 (noncompliance and 1-month treatment hold during infection). In the pediatric cohort, there were no DLTs during the first 8 weeks, but 1 patient had grade-3 hypophosphatemia and hypokalemia at week 7, and 1 patient developed grade-2 hypothyroidism at week 8. All 11 pediatric patients tolerated dose escalation to dose-level C compared with only 5 of 10 adult patients in the initial treatment period (supplemental Table 1). During extended treatment, 2 pediatric patients required reduction to dose-level B (grade-4 electrolyte abnormalities and grade-1 flu-like symptoms), and 1 adult required reduction to dose-level A for injection site reactions.
Clinical response and survival outcomes
There were no complete responses at week 8. Three of the 10 adult participants were nonevaluable for response at week 8: 2 because of early removal from the study and 1 because of a lack of evaluable sites at baseline (ocular cGVHD only). Of the 7 evaluable adult patients, 2 (28.5%) had PR, 2 (28.5%) had SD, including mixed response not meeting PR criteria, and 3 (43%) had progressive disease (Figure 1B). Of the 11 pediatric patients, 9 (82%) had PR, 2 (18%) had SD or mixed response, and none had PD at 8 weeks. Response sites included skin (n = 4/13, 31%), mouth (n = 5/10, 50%), gastrointestinal tract (n = 2/5, 40%), liver (n = 1/3, 33%), lung (n = 7/10, 70%; by National Institutes of Health Lung Symptom Score with stable forced expiratory volume [FEV1] in 3 patients and increase in FEV1 by 9% in 1 patient), and joint/muscle/fascia (n = 3/8, 38%).
Paired pre- to posttreatment analysis was performed for each of the 7 PRO subscale assessments. Within the pediatric cohort, skin symptom PROs improved from a baseline median score of 1 (range, 0.6-1.6) to 0.4 (range, 0.2-1.2; P = .02) at week 8. In addition, breathing symptom PROs improved from a median baseline score of 0.4 (range, 0.2-0.8) to 0 (range, 0-0.4; P = .008) at week 8. The adult cohort did not have significant pre- to posttreatment change in any PRO subscale (Figure 2; data not shown).
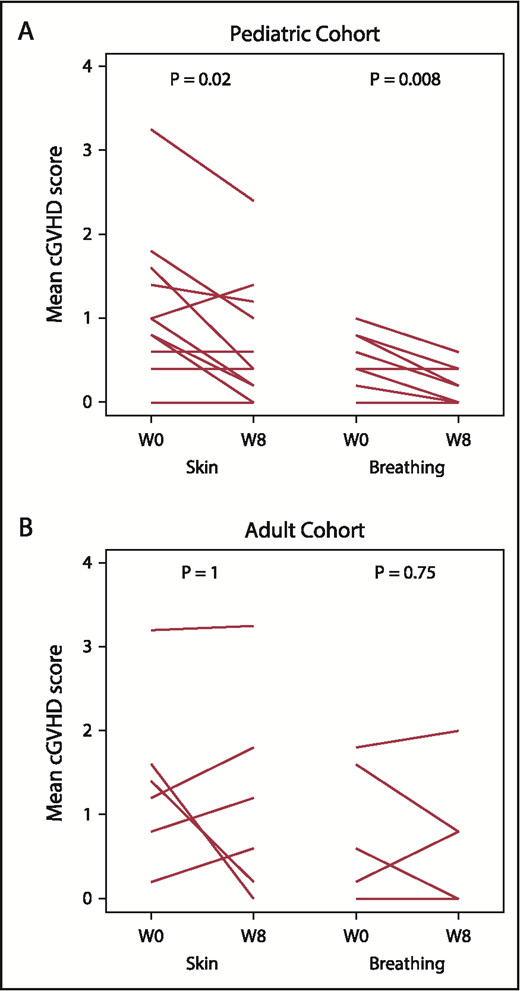
Patient reported outcomes (Lee cGVHD Symptom Scale). Paired pre- to posttreatment analysis for “Skin” and “Breathing” subscales in the pediatric (A) and adult (B) cohorts. Each line represents an individual patient’s data at baseline and at week 8. W0, baseline (pretreatment); W8, week 8 (posttreatment).
Patient reported outcomes (Lee cGVHD Symptom Scale). Paired pre- to posttreatment analysis for “Skin” and “Breathing” subscales in the pediatric (A) and adult (B) cohorts. Each line represents an individual patient’s data at baseline and at week 8. W0, baseline (pretreatment); W8, week 8 (posttreatment).
Four adult and all 11 pediatric patients with subjective clinical benefit elected to continue extended-duration IL-2 therapy (median, 44 weeks; range, 8-141). Four pediatric patients remain on therapy (median, 82 weeks; range, 70-120). One additional adult achieved PR at 32 weeks, and 2 additional pediatric patients achieved PR at weeks 23 and 24. Notably, daily low-dose IL-2 led to complete resolution of sclerotic hidebound skin in 2 pediatric patients during extended IL-2 therapy (Figure 3A). The median corticosteroid dose for the pediatric cohort decreased from 0.5 mg/kg per day (range, 0.1-0.9) at baseline to 0.1 mg/kg per day (range, 0-0.4) at 6 months (Figure 3B). Seven of the 10 pediatric patients receiving baseline corticosteroids discontinued them entirely during extended IL-2 therapy.
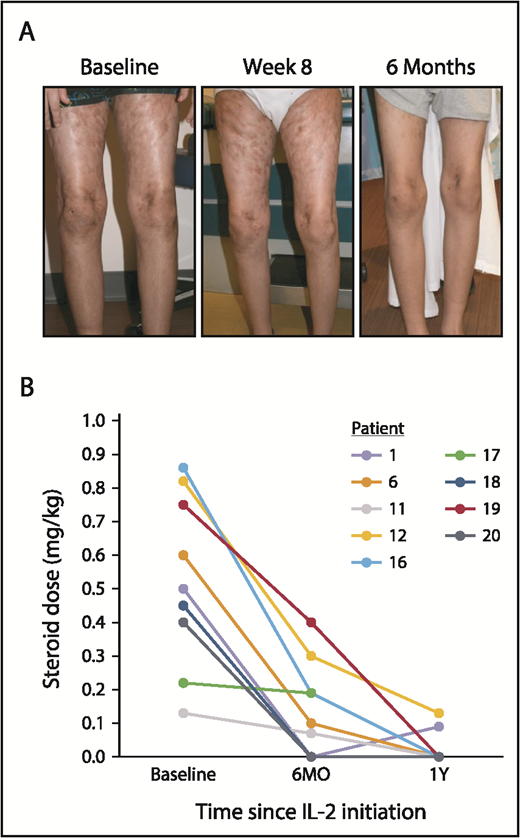
Sclerotic skin response and change in corticosteroid doses over time in pediatric patients. (A) Sclerodermatous cGVHD of the skin in a pediatric patient (patient 16) at baseline and after 8 weeks and 6 months of low-dose IL-2 therapy. There was complete resolution of sclerotic skin by 6 months, although residual hyperpigmentation of the skin remained. Patient 1 (not shown) also had a similar skin response. (B) Change in daily corticosteroid doses (mg/kg) for pediatric patients at baseline, 6 months (6MO), and 1 year (1Y) of IL-2 therapy. Each line represents an individual patient over time.
Sclerotic skin response and change in corticosteroid doses over time in pediatric patients. (A) Sclerodermatous cGVHD of the skin in a pediatric patient (patient 16) at baseline and after 8 weeks and 6 months of low-dose IL-2 therapy. There was complete resolution of sclerotic skin by 6 months, although residual hyperpigmentation of the skin remained. Patient 1 (not shown) also had a similar skin response. (B) Change in daily corticosteroid doses (mg/kg) for pediatric patients at baseline, 6 months (6MO), and 1 year (1Y) of IL-2 therapy. Each line represents an individual patient over time.
Two-year OS was 90% in the adult cohort and 91% in the pediatric cohort (P = .5). Two-year PFS was 90% and 82% in the adult and pediatric cohorts, respectively (P = .27) (supplemental Figure 1). Three patients died during extended follow-up: 1 nonevaluable adult patient (worsening of cGVHD) and 2 pediatric patients (both with systemic infections followed by worsening of cGVHD). One pediatric patient had relapse of myelodysplastic syndrome (MDS) and discontinued IL-2 therapy at week 45 (supplemental Table 2).
Clinical laboratory parameters
Dose-escalated daily IL-2 did not induce cytopenias or thrombotic microangiopathy. As in previous IL-2 trials,12-14 peripheral eosinophilia was observed in both cohorts, increasing from a median of 20 cells per microliter (interquartile range [IQR], 10-120) at baseline to a peak of 410 cells per microliter (IQR, 50-800) at week 4, plateauing thereafter at 340 cells per microliter (IQR, 80-610) by week 8.
Plasma IL-2 levels and CD4Treg expansion
In the pediatric cohort, the dose-escalation regimen led to a gradual increase in plasma IL-2 levels from a baseline median of 6.6 pg/mL to a peak of 49.5 pg/mL at week 5, before plateauing in the median range of 30.3 to 31.8 pg/mL between weeks 6 and 8 (Figure 4A). This rise in plasma IL-2 levels correlated with a steady increase in absolute CD4Treg numbers, which peaked at week 6 with a median 11.5-fold increase from baseline. The adult cohort had a rapid rise in plasma IL-2 levels from a baseline median of 4 pg/mL to 41.6 pg/mL by week 1 but then levels plateaued between 29.1 and 42.9 pg/mL from weeks 2 to 5 and decreased further to a median of 16.2 pg/mL by week 8 (Figure 4B). As in the previous fixed-dose IL-2 trials, the absolute CD4Treg numbers in adults peaked at week 3, with a median 7.1-fold increase from baseline, and then plateaued to a median 4.7-fold increase by week 8. However, the findings in the adult cohort are confounded by the inability of many participants to tolerate escalation to dose-level C. When examined separately, the adults who achieved dose-level C showed higher plasma IL-2 levels coincident with IL-2 dose escalations (supplemental Figure 2A). Changes in soluble IL-2 receptor levels closely followed changes in the CD4Treg counts during therapy and were not significantly different between the 2 cohorts (supplemental Figure 2B).
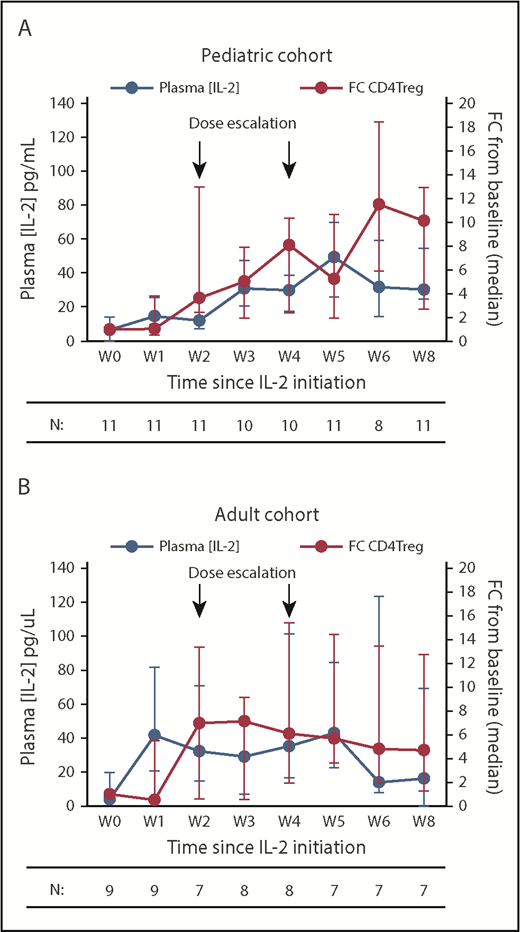
Plasma IL-2 levels and fold change in absolute CD4Treg numbers during IL-2 therapy. (A) Pediatric cohort. (B) Adult cohort. Blue lines denote plasma IL-2 concentrations (pg/mL), red lines denote fold change (FC) in absolute CD4Treg count from baseline (W0). Median values (circles) and the IQR (whisker bars) are shown at each time point. The number of patients evaluated at each time point is indicated below.
Plasma IL-2 levels and fold change in absolute CD4Treg numbers during IL-2 therapy. (A) Pediatric cohort. (B) Adult cohort. Blue lines denote plasma IL-2 concentrations (pg/mL), red lines denote fold change (FC) in absolute CD4Treg count from baseline (W0). Median values (circles) and the IQR (whisker bars) are shown at each time point. The number of patients evaluated at each time point is indicated below.
Immunologic response
In the pediatric cohort, absolute CD4Treg numbers increased from a median of 6.6 cells per microliter at baseline to 35.8 cells per microliter at week 2 (P = .007, compared to baseline) and then increased again to 53.5 cells per microliter at week 4 (P = .001) after the first dose-level increase (supplemental Figure 3A). Following the second dose-level increase, the median CD4Treg count increased to 68.8 cells per microliter at week 6 (P = .002). In the adult cohort, absolute CD4Treg numbers rose from a median of 25.8 cells per microliter to 59.9 cells per microliter at week 2 (P = .13), peaked at 93.1 cells per microliter at week 4 (P = .027), and then plateaued above baseline at 44.6 cells per microliter at week 8 (P = .016). Absolute CD4Tcon numbers did not change significantly from baseline to week 8 in either cohort (supplemental Figure 3B).
Although both cohorts had a similar median CD4Treg/Tcon ratio at baseline (0.08 in adults vs 0.07 in children, P = .6), the CD4Treg/Tcon ratio was significantly higher in the pediatric cohort at week 8 (0.18 vs 0.4, P = .024) (Figure 5A). During extended therapy in the pediatric cohort, the CD4Treg count remained significantly elevated as the absolute CD4Tcon count normalized, maintaining the CD4Treg/Tcon ratio significantly above baseline (supplemental Figure 3B). As in previous IL-2 trials, CD8 T-cell numbers remained stable, but NK cells increased during low-dose IL-2 therapy (Figure 5B).
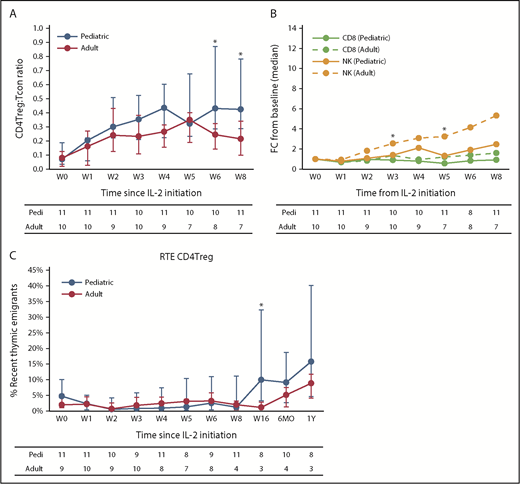
Immunologic impact of low-dose IL-2 on lymphocytes. (A) CD4Treg/Tcon ratio for the pediatric and adult cohorts. (B) Fold change in absolute CD8 T-cell and NK cell counts for the pediatric and adult cohorts. (C) Recent thymic emigrant (RTE) CD4Tregs shown as a percentage of the naive CD4Treg population for the pediatric and adult cohorts. Median values (circles) and the IQR (whisker bars) are shown at each time point. The number of patients evaluated at each time point is indicated at the bottom. *P < .05 pediatric vs adult, Wilcoxon rank-sum test.
Immunologic impact of low-dose IL-2 on lymphocytes. (A) CD4Treg/Tcon ratio for the pediatric and adult cohorts. (B) Fold change in absolute CD8 T-cell and NK cell counts for the pediatric and adult cohorts. (C) Recent thymic emigrant (RTE) CD4Tregs shown as a percentage of the naive CD4Treg population for the pediatric and adult cohorts. Median values (circles) and the IQR (whisker bars) are shown at each time point. The number of patients evaluated at each time point is indicated at the bottom. *P < .05 pediatric vs adult, Wilcoxon rank-sum test.
Adults had significantly greater NK cell expansion than did the pediatric cohort (median fold increase of 3.2 vs 1.2 from baseline to week 5, P = .007). Because activated NK cells can secrete proinflammatory cytokines and chemokines,24 we surveyed plasma levels to determine whether the inability to tolerate IL-2 dose escalations in adults could be explained. Compared with the pediatric cohort, IL-2 dose-escalated adults trended toward higher levels of the proinflammatory cytokines IL-12 and interferon-α (IFN-α) (supplemental Figure 4A), but not for other cytokines tested (data not shown). Their levels of IL-12 and IFN-α were also higher than those in adults receiving fixed-dose IL-2 in prior trials (supplemental Figure 4B).
To examine whether age-related thymic regression influenced the response to IL-2, we compared expansion of naive CD4Tregs in adults and children. During the initial 8-week treatment period, there was no increase in naive CD4Tregs in either cohort (supplemental Figure 5). However, the pediatric patients showed significant expansion of the naive CD4Treg fraction beginning at week 16 and persisting through 1 year of IL-2 therapy. The naive CD4Treg fraction did not increase in the adult cohort, but only 4 adult patients continued IL-2 therapy for 6 months, and only 3 adult patients remained on therapy at 1 year. Similarly, there were no differences in RTE CD4Tregs between the cohorts during the first 8 weeks, but the pediatric patients showed a significant expansion of RTE CD4Tregs starting at week 16 of extended therapy (Figure 5C).
CD4Treg homeostatic marker analysis
Previous studies showed that antiapoptotic BCL-2 levels preferentially increase within CD4Tregs during IL-2 therapy and lead to enhanced survival.15 Median BCL-2 mean fluorescence intensity in CM CD4Tregs was significantly lower in the pediatric cohort vs the adult cohort at baseline (722 vs 2447 respectively, P = .004). Daily IL-2 led to a significant increase in BCL-2 levels within pediatric CM CD4Tregs (P = .005, compared with baseline), whereas levels did not change in adults (Figure 6A). Although PD-1 is a marker of exhaustion within effector T cells, PD-1 expression within CD4Tregs appears to support proliferation and survival.25-28 We previously documented that low-dose IL-2 increased PD-1 expression, particularly within CM CD4Tregs, and that concomitant PD-1 blockade antagonized the effects of IL-2 by promoting apoptosis and in vivo CD4Treg depletion.28 The baseline frequency of PD-1–expressing cells within the CM CD4Treg fraction was significantly higher in the pediatric cohort (median 27% vs 11%, P = .001), and it remained consistently higher throughout IL-2 therapy (Figure 6B).
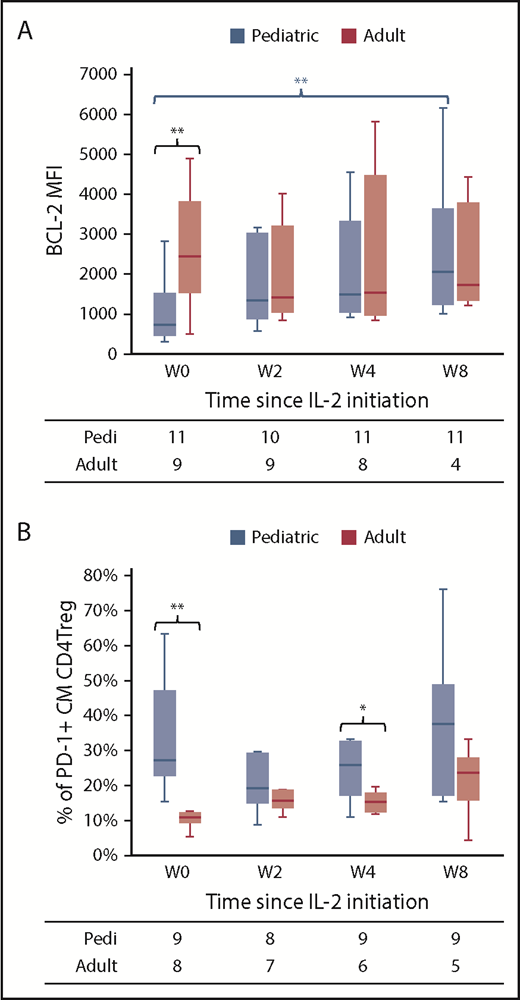
Expression of BCL-2 and PD-1 in CD4Tregs in pediatric and adult patients. (A) BCL-2 mean fluorescence intensity (MFI) in CM CD4Tregs at baseline (W0) and at weeks 2, 4, and 8 of IL-2 therapy. (B) Percentage of CM CD4Tregs with PD-1 expression. Box plots depict the 75th percentile, median, and 25th percentile values; whiskers represent maximum and minimum values, except for outliers. Blue, pediatric cohort. Red, adult cohort. The number of patients evaluated at each time point is indicated at the bottom. *P < .05, **P < .005 pediatric vs adult, Wilcoxon rank-sum test.
Expression of BCL-2 and PD-1 in CD4Tregs in pediatric and adult patients. (A) BCL-2 mean fluorescence intensity (MFI) in CM CD4Tregs at baseline (W0) and at weeks 2, 4, and 8 of IL-2 therapy. (B) Percentage of CM CD4Tregs with PD-1 expression. Box plots depict the 75th percentile, median, and 25th percentile values; whiskers represent maximum and minimum values, except for outliers. Blue, pediatric cohort. Red, adult cohort. The number of patients evaluated at each time point is indicated at the bottom. *P < .05, **P < .005 pediatric vs adult, Wilcoxon rank-sum test.
TCRβ diversity and clone tracking analysis in pediatric patients
We previously demonstrated that low-dose IL-2 increased diversity of the adult CD4Treg TCRβ repertoire, without affecting CD4Tcon or CD8 T cells.29 We now examined the impact of low-dose IL-2 on the CD4Treg TCRβ repertoire in 4 pediatric patients early after initiating treatment (8 to 16 weeks) and during extended therapy (6 months). All 4 pediatric patients had an increase in CD4Treg TCRβ diversity with IL-2 therapy, as measured using the Hill-based diversity profile (Figure 7A). TCRβ diversity within CD4Tcon or CD8 T cells did not change (data not shown). We also examined turnover of individual T-cell clones within each cell type. The correlation coefficient between the relative frequencies of the top 1000 most abundant productive clones at weeks 8 or 16 vs baseline was significantly lower in CD4Tregs compared with CD4Tcon (P = .03) and CD8 T cells (P = .03) (Figure 7B), indicating that IL-2 preferentially promotes clonal turnover in CD4Tregs. We also examined the number of clonotypes accounting for the top 20% of productive frequencies within CD4Tregs and found that the number of clonotypes increased after IL-2 therapy in all patients (Figure 7C).
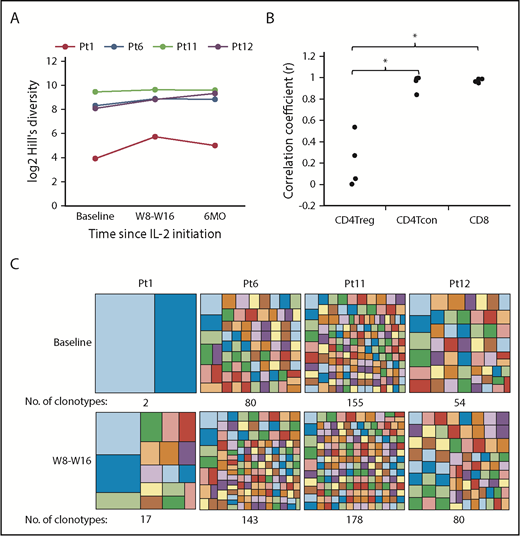
CD4Treg TCRβ repertoire analysis in pediatric patients. (A) Hill-based diversity values for CD4Tregs from patients 1, 6, 11, and 12 at baseline, W8 or W16, and 6 months of IL-2 therapy. Each line represents an individual patient over time. (B) Correlation coefficients between the productive frequencies of the top 1000 clones at weeks 8 or 16 and the productive frequencies of the same clones at baseline for each cell type are shown for the 4 pediatric patients. (C) Number of clonotypes making up the top 20% of productive frequencies at baseline and after 8 to 16 weeks of IL-2 therapy. Each box within the large squares represents a unique clonotype, and the box size represents the relative proportion of that clonotype. Colors at baseline and W8-W16 do not represent the same clonotype. *P < .05, 2-sided Wilcoxon signed-rank test.
CD4Treg TCRβ repertoire analysis in pediatric patients. (A) Hill-based diversity values for CD4Tregs from patients 1, 6, 11, and 12 at baseline, W8 or W16, and 6 months of IL-2 therapy. Each line represents an individual patient over time. (B) Correlation coefficients between the productive frequencies of the top 1000 clones at weeks 8 or 16 and the productive frequencies of the same clones at baseline for each cell type are shown for the 4 pediatric patients. (C) Number of clonotypes making up the top 20% of productive frequencies at baseline and after 8 to 16 weeks of IL-2 therapy. Each box within the large squares represents a unique clonotype, and the box size represents the relative proportion of that clonotype. Colors at baseline and W8-W16 do not represent the same clonotype. *P < .05, 2-sided Wilcoxon signed-rank test.
Discussion
Previously, with fixed-dose daily IL-2, plasma IL-2 levels peaked at week 2 and subsequently plateaued despite continued IL-2 administration.12,13 Concurrent with the rise in plasma IL-2 levels, circulating CD4Treg numbers peaked at week 4, before plateauing thereafter.15 Based on these observations, we hypothesized that incremental IL-2 dose escalations at the time of the anticipated fall in plasma IL-2 levels would better support CD4Treg expansion and clinical response. Thus, we conducted a phase 1 trial of a novel IL-2 dose-escalation regimen with individual patient dose increases at weeks 2 and 4 of an 8-week treatment course.
Contrary to expectations, dose escalation above the fixed-dose MTD of 1 × 10⁶ IU/m2 per day was not well tolerated in adults, with only half of the participants able to escalate to the highest dose level of 2 × 10⁶ IU/m2 per day. Consequently, plasma IL-2 levels rose quickly in the adult cohort, but then plateaued over the 8-week treatment period. Circulating CD4Treg numbers also peaked early and plateaued thereafter as in previous fixed-dose trials. The 29% clinical response rate in the adult cohort of this trial was lower than the 50% to 60% response rates reported in our previous fixed-dose IL-2 trials, although formal comparisons are limited by clinical heterogeneity inherent in an early-phase SR cGVHD trial and because only 7 adult participants were evaluable at the week-8 response assessment time point. We conclude that IL-2 dose escalation was infeasible in adults and did not accomplish our goals of sustaining higher plasma IL-2 levels, enhancing CD4Treg expansion, and improving clinical responses, due to intolerable constitutional symptoms with higher IL-2 doses.
Although ultra low-dose IL-2 has been used for acute GVHD prophylaxis in children undergoing allogeneic HSCT,30 this was the first low-dose IL-2 trial in pediatric patients with SR cGVHD. Children tolerated escalation up to the fixed-dose IL-2 adult MTD of 1 × 10⁶ IU/m2 per day without significant AEs. Plasma IL-2 levels and circulating CD4Treg numbers increased as predicted with the IL-2 dose escalations at weeks 2 and 4. Clinically, the pediatric patients had an 82% PR rate after 8 weeks of treatment, with improvement in numerous sites, including several lung responses. PROs in skin and lung also improved significantly. During extended-duration therapy, we observed complete resolution of severe sclerotic skin in 2 pediatric patients, and 5 patients were able to wean off all other immunosuppression. However, 1 pediatric patient experienced a cGVHD flare while weaning other immunosuppressive agents, and 1 pediatric patient had progression of lung disease following influenza infection. Two additional pediatric patients had cGVHD progression following episodes of bacterial sepsis, and both eventually died of complications related to refractory GVHD while off IL-2. The infections were not considered treatment related, because cGVHD and concurrent immune suppression medications are known risk factors for infection. There was 1 MDS relapse (12.5%) out of the 8 pediatric patients with underlying hematologic malignancies. This is within the 30% cumulative incidence of relapse at 2 years reported for pediatric patients following HSCT with unrelated donors for leukemia and MDS31 but slightly higher than the 3% to 8% cumulative incidence of relapse in patients with MDS who had cGVHD and were disease free at 1 year after HSCT.32 Although the infections were not unexpected, and the relapse rate was low in our small cohort, these will remain areas of scrutiny in children undergoing prolonged therapy with low-dose IL-2.
Despite lower doses of IL-2, pediatric patients achieved a higher CD4Treg/Tcon ratio compared with adults and had clinical improvement of their refractory cGVHD. Previously identified clinical response predictors in adults included earlier IL-2 initiation and a CD4Treg/Tcon ratio ≥0.2 at week 1.13 Accordingly, the median CD4Treg/Tcon ratio at week 1 was 0.21 in the pediatric patients compared with 0.16 in the adults. The pediatric cohort also had shorter median times from bone marrow transplantation and cGVHD diagnosis to enrollment compared with the adults, although the differences were not statistically significant, likely due to limited sample size.
As a result of increased thymic output in children, we wondered whether greater naive CD4Treg output in the pediatric cohort contributed to its superior clinical response. Although the pediatric cohort did have better naive and RTE CD4Treg expansion with IL-2 therapy, these differences were not apparent until week 16 of the extended treatment period and, thus, cannot explain the early responses at week 8. There were no differences in CD4Tcon or CD8 T-cell numbers between the cohorts, but adults had greater expansion of NK cells, which are also sensitive to low-dose IL-2.33,34 As a result of the robust NK cell expansion, we compared proinflammatory cytokine levels in the pediatric vs adult patients and found that the adult cohort had higher plasma IL-12 and IFN-α levels during IL-2 therapy. In addition, the adults in this study had higher plasma IL-12 and IFN-α levels than did the adults on the previous phase 2 low-dose IL-2 study at baseline, suggesting that the adult participants in this study may have had more refractory cGVHD.
Interestingly, CD4Tregs in the pediatric patients had a significantly higher proportion of PD-1–expressing cells at baseline and throughout treatment compared with the adults. In addition, BCL-2 levels in CD4Tregs increased over time with IL-2 in the pediatric cohort but remained static in the adults. This suggests that age-dependent intrinsic differences within CD4Tregs may promote survival and proliferation and lead to better clinical responses in younger patients. We were unable to perform functional CD4Treg suppression assays because of limited sample availability, but age-dependent differences in CD4Treg suppressive activity have been reported.35
In summary, low-dose IL-2 has potential as a well-tolerated and effective therapy for SR cGVHD in children, with objective clinical responses seen in a high proportion of children within 8 weeks of initiating treatment. Long-term IL-2 therapy (≥2 years) is also well tolerated and leads to continued clinical improvement and complete responses in some children. Remarkably, we documented improvement in lung cGVHD and complete discontinuation of corticosteroids in several IL-2–treated children. Although the optimal duration of therapy and lifetime immune effects of IL-2 are unknown, phase 2 low-dose IL-2 treatment trials in children with SR cGVHD are warranted to confirm efficacy.
The full-text version of this article contains a data supplement.
Acknowledgments
The authors thank the patients who participated in this trial and their families, as well as the Pasquarello Hematologic Malignancies Tissue Bank for prospective collection and processing of serial blood samples.
This work was supported by National Institutes of Health, National Cancer Institute grants R01CA183559, R01CA183560, and P01CA142106; Prometheus Laboratories Inc.; the Mooney Family Initiative for Translational and Clinical Studies in Rare Diseases; an American Society of Hematology Junior Faculty Scholar Award; and the Ted & Eileen Pasquarello Research Fund.
Authorship
Contribution: J.S.W., B.R.B., J.K., and J.R. conceived and designed the study; J.K., E.P.A., P.A., C.S.C., V.T.H., J.H.A., R.J.S., M.A.L., S.M., C.D., and L. Lehmann provided patients; J.S.W., N.M., L. Leonard., S.P., S.S., K.V., S.K., S.N., J.H., S.C.R., and C.G.R. collected and assembled data; H.T.K. analyzed and interpreted data and performed statistical analyses; and all authors wrote the manuscript.
Conflict-of-interest disclosure: J.K. has received research funding from Prometheus Laboratories, Millennium Pharmaceuticals, and Miltenyi Biotec; consulting fees from Amgen, Equillium, and Fortress Biotech; and advisory board fees from Takeda Pharmaceuticals, Cugene, and Kadmon. P.A. has received research funding from Bristol-Myers Squibb, Merck, Affimed, Adaptive, Roche, Tensha Therapeutics, Otsuka, and Sigma Ta and consulting fees from Bristol-Myers Squibb, Merck, Infinity Pharmaceuticals, Pfizer, and Affimed. J.R. reports research funding from Equillium and Kite Pharma; and consulting income from Aleta Biotherapeutics, AVROBIO, Celgene, Draper Laboratory, LifeVault Bio, Talaris Therapeutics, and TScan Therapeutics. B.R.B. has received consulting fees from Kamon Pharmaceuticals, Five Prime Therapeutics, Regeneron Pharmaceuticals, Magenta Therapeutics, and BlueRock Therapeutics; research support from Fate Therapeutics, RXi Pharmaceuticals, Alpine Immune Sciences, AbbVie, the Leukemia and Lymphoma Society, the Children’s Cancer Research Fund, and the Kids First Fund; and is a cofounder of Tmunity Therapeutics. R.J.S. serves on the Board of Directors for Kiadis Pharma, is on the data safety monitoring board for Juno Therapeutics, and has received consulting fees from Cugene, Jazz Pharmaceuticals, Neovii, Gilead Sciences, and Mana Therapeutics. The remaining authors declare no competing financial interests.
The current affiliation for M.A.L. is Division of Hematology, Oncology, and Marrow and Blood Cell Transplantation, Children’s Hospital at Montefiore, Bronx, NY.
Correspondence: John Koreth, D2029 Dana-Farber Cancer Institute, 450 Brookline Ave, Boston, MA 02215; e-mail: john_koreth@dfci.harvard.edu.

