

Key Points
Multiple functional variants in 2q12.1 region, containing IL1RL1, are strongly associated with sST2 levels, a well-characterized GVHD biomarker.
Donor variants in the 2q12.1 region associated with sST2 also associate with death from infection or aGVHD.

Abstract
Graft-versus-host disease (GVHD) and infections are the 2 main causes of death without relapse after allogeneic hematopoietic cell transplantation (HCT). Elevated soluble serum simulation-2 (sST2), the product of IL1RL1 in plasma/serum post-HCT, is a validated GVHD biomarker. Hundreds of SNPs at 2q12.1 have been shown to be strongly associated with sST2 concentrations in healthy populations. We therefore hypothesized that the donor genetic variants in IL1RL1 correlate with sST2 protein levels associated with patient survival outcomes after HCT. We used DISCOVeRY-BMT (Determining the Influence of Susceptibility Conveying Variants Related to 1-Year Mortality after Blood and Marrow Transplantation), a genomic study of >3000 donor–recipient pairs, to inform our hypothesis. We first measured pre-HCT plasma/serum sST2 levels in a subset of DISCOVeRY-BMT donors (n = 757) and tested the association of donor sST2 levels with donor single nucleotide polymorphisms (SNPs) in the 2q12.1 region. Donor SNPs associated with sST2 levels were then tested for association with recipient death caused by acute GVHD (aGVHD)–, infection-, and transplant-related mortality in cohorts 1 and 2. Meta-analyses of cohorts 1 and 2 were performed using fixed-effects inverse variance weighting, and P values were corrected for multiple comparisons. Donor risk alleles in rs22441131 (Pmeta = .00026) and rs2310241 (Pmeta = .00033) increased the cumulative incidence of aGVHD death up to fourfold and were associated with high sST2 levels. Donor risk alleles at rs4851601 (Pmeta = 9.7 × 10⁻⁷), rs13019803 (Pmeta = 8.9 × 10⁻⁶), and rs13015714 (Pmeta = 5.3 × 10⁻⁴) increased cumulative incidence of infection death to almost sevenfold and were associated with low sST2 levels. These functional variants are biomarkers of infection or aGVHD death and could facilitate donor selection, prophylaxis, and a conditioning regimen to reduce post-HCT mortality.
Introduction
Approximately 30 000 allogeneic hematopoietic cell transplantations (HCTs) were performed worldwide in 2018. Graft-versus-host disease (GVHD) and infections are the 2 main causes of nonrelapse morality after HCT. Elevated soluble serum stimulation-2 (sST2) levels in patients after transplantation is a validated biomarker of therapy-resistant GVHD and death.1-8 The ST2 protein is encoded by the IL1RL1 gene, which is located on chromosome 2 (chr 2; 2q12) and produces 2 isoforms: soluble or circulating (sST2) and membrane-bound or cellular (ST2).9 The membrane-bound isoform (ST2) induces immune response through its only ligand, interleukin-33 (IL-33), and promotes MyD88/NF-κB signaling, whereas the soluble isoform (sST2) lacks transmembrane and cytoplasmic domains, does not signal, and acts as a decoy receptor, sequestering free IL-33 in serum.9,10 ST2 is a member of the IL-1 receptor family, and the ST2/IL-33 pathway has been implicated in several immune and inflammatory diseases, as well as cardiovascular events.9,10
In 5 independent genome-wide association studies (GWASs) totaling tens of thousands of healthy individuals, multiple single nucleotide polymorphisms (SNPs) within a 1-megabase (Mb) region around IL1RL1 (chr 2; 102.5-103.5 Mb) associated with sST2 protein levels at the genome-wide significance level P < 5 × 10−8.11-16 There are additional genomic features that make this an appealing region to search for biomarkers of aGVHD and infection death. Specifically, variants in this 1-Mb span correlate significantly with gene expression levels of IL1RL1 and other IL1 family members in healthy blood, lung, skin, and esophageal tissues.13,17-19 Analyses of the human primary blood cell type Promoter Capture Hi-C (PCHi-C) data attempt to link gene regulatory elements to their target genes and show that this region contains over 1000 promoter-interaction regions (PIRs).20-22 PIRs in lymphoblastoid cell lines are significantly enriched for autoimmune GWAS SNPs 23,24 . In line with this finding, the 1-Mb region surrounding IL1RL1 contains >70 unique genome-wide significant SNPs associated with multiple infection or immune-related phenotypes, asthma, Crohn’s disease, ulcerative colitis (UC), celiac disease, ankylosing spondylitis,15,25-27 inflammatory bowel disease (IBD), percentages of neutrophils, and percentage and counts of eosinophils and lymphocytes.28 Together, these data provide a strong rationale for testing the association of SNPs in this region with recipient survival after HCT.
We sought to determine whether variants in the IL1RL1 region are associated with sST2 levels in DISCOVeRY-BMT (Determining the Influence of Susceptibility Conveying Variants Related to 1-Year Mortality after Blood and Marrow Transplantation) recipients and donors and in turn whether these sST2-associated variants increase the risk of death from aGVHD, from infection, and from transplantation-related events. Evidence of a genetic association suggests that these may be functional survival biomarkers and could be used to improve donor selection and to better understand the biological complexity of death due to aGVHD or infection.
Patients and methods
Study population
The study population consisted of the 2 cohorts comprising DISCOVeRY-BMT, an existing well-powered genome-wide association study (GWAS) totaling 3047 HCT recipients who were of European genomic ancestry and had acute lymphoblastic leukemia (ALL), acute myelogenous leukemia (AML), or myelodysplastic syndrome (MDS), and their HLA-matched unrelated donors, treated from 2000 through 2011 and reported to the Center for International Blood and Marrow Transplant Research (CIBMTR).29-32 All patients included in DISCOVeRY-BMT provided informed consent for inclusion in the CIBMTR registry and biorepository. Paired donor and recipient biospecimens and corresponding clinical data were obtained from the CIBMTR biorepository and database. The National Marrow Donor Program (NMDP), Roswell Park Comprehensive Cancer Institute, The Ohio State University, and Indiana University School of Medicine Institutional Review Boards approved the study protocol. In this study, we focused on patients with AML or MDS and their donors (n = 2253 pairs) in DISCOVeRY-BMT. We defined aGVHD death and infection death as primary nonoverlapping causes of death in the absence of disease relapse, with secondary causes defined as contributing, because these were either not as severe as the primary cause or were more distal from the time of death.29
Genotyping and imputation
Genotyping and quality control have been described in detail.29-32 In brief, samples were randomized to plates33 and genotyped by using the Illumina Human OmniExpress BeadChip (University of Southern California Genomics Facility). After sample quality control, 2111 (cohort 1) and 777 (cohort 2) donor–recipient pairs of European genomic ancestry were available for analyses. Following SNP QC, ∼635 000 SNPs were imputed to the hg19 build 37 Haplotype Reference Consortium (http://www.haplotype-reference-consortium.org/home). To make the population more homogenous, we included only myeloid samples (AML and MDS) from DISCOVeRY-BMT. Variants were analyzed if the minor allele frequency (MAF) was >0.05 and the info score was >0.8, yielding 2271 SNPs on chr 2 (102.5-103.5 Mb) in 1584 (cohort 1) and 669 (cohort 2) donor–recipient pairs.
Pre-HCT sST2 plasma and serum concentration measurements
A subset of DISCOVeRY-BMT AML and MDS samples with available plasma or serum were selected for pre-HCT sST2 measurement. In total, we measured sST2 levels in 1514 samples: 757 pretransplantation patients and their matched donors. Samples were collected before initiation of the preparative regimen for transplantation. This collection may have occurred before or on the day of admission. Enzyme-linked immunosorbent assays (ELISAs) for ST2 were performed in batches on cryopreserved plasma and serum.2,6-8 Approximately three-quarters of all samples measured were from plasma (treated with anticoagulant citrate dextrose) and the remaining one-fourth were from serum.
Statistical analyses
SNP associations with pre-HCT sST2 levels.
SNPs were tested for association with plasma/serum sST2 concentrations by using linear regression models adjusted for age, sex, and sample type (plasma or serum) in a subset of DISCOVeRY-BMT donor-recipient pairs (n = 757). sST2 values were log10 transformed for normalization. Donor and recipient SNPs were tested for association with donor and pretransplant recipient sST2 serum/plasma concentrations, respectively. Dosage SNP data (ranging from 0 to 2 alleles), accounting for the probability of each genotype, were used in all regression models run in R statistical software.34 Linkage disequilibrium (LD) between the SNPs and SNP annotation was visualized with the R package LDheatmap and SNIPA online tool, respectively.34,35
Competing risk analyses of aGVHD death and infection death.
Before genetic analyses, bidirectional stepwise competing risk models were constructed for both outcomes and run in the R package crrstep.34,36,37 Akaike information criteria (AIC) were used to select the best-fit clinical model in cohort 1. These variables were used for competing risk SNP analyses in both cohorts 1 and 2. The following variables were tested: recipient age <40, donor age, recipient sex, donor sex, anti-thymocyte globulin/alemtuzumab (Campath) prophylaxis, body mass index category, ABO blood group, conditioning intensity, graft source, total body irradiation AML (yes/no), disease stage, and CMV status. SNP meta-analyses were performed by fitting fixed-effects models with inverse variance weighting, using the R package Metafor. Random-effects models were used to provide meta-analyses estimates if heterogeneity was detected between cohorts, defined as Cochran’s Q value > 50 or P < .05.38 Bonferroni correction for the effective number of independent genetic tests, after adjusting for the correlation between tested SNPs, was used to determine significance.39 A SNP association was deemed statically significant if the direction of hazard was the same in both cohorts and had a meta P (Pmeta) < 5.3 × 10⁻⁴. These significant SNPs were then also tested for association with overall survival (OS), using the Cox proportional hazards model, and transplant-related mortality (TRM), using the competing risk model, while adjusting for other clinical variables. To measure the collective contribution of significant variants to risk of death due to infection, a multiallele variable was generated, defined as the sum of the number of risk alleles across significantly associated SNPs selected in the models described above. This variable was then used in the final competing risk model with clinical covariates.
Annotation of significantly associated variants
We annotated significant SNPs in the IL1RL1 region (chr 2; 102.5-103.5 Mb) using publicly available data to better understand the potential function of the variants identified. eQTLGen, a consortium analyses of the relationship of SNPs to gene expression in 30 912 whole blood samples, was used to determine if aGVHD or infection death–associated SNPs showed an allele-specific association with nearby gene expression (cis-expression quantitative trait loci [eQTL]). A catalog of human blood cell trait variation28 and the genomic atlas of the human plasma proteome13 were used to determine if significant SNPs showed an allele-specific association with plasma protein levels in >3000 healthy individuals. Significant variants were also examined for relationship to gene expression in >70 additional tissues using the Genotype-Tissue Expression Project (GTEx; https://gtexportal.org/home/). To determine if our significant SNPs were associated with other traits or diseases, we queried the PhenoScanner database, a comprehensive variant–phenotype database of large GWASs, which includes results from the UK Biobank, NHGRI-EBI GWAS catalog, NIH GRASP, and publicly available summary statistics from >100 published genome association studies.19 Results were filtered at P < 5 × 10⁻⁸, and the R statistical software package PhenoScanner (https://github.com/phenoscanner/phenoscanner) was used to download all data for our significant variants. Chromatin state data based on a 25-state Imputation Based Chromatin State Model across 24 blood, T-cell, hematopoietic stem cell (HSC), and B-cell lines were downloaded from the Roadmap Epigenomics project40 Web site (https://egg2.wustl.edu/roadmap/data/byFileType/chromhmmSegmentations/ChmmModels/imputed12marks/jointModel/final/). Figures including chromatin state information and results from previous GWASs were constructed using the R Bioconductor package gviz.41 Last, publicly available PCHi-C data on a lymphoblastoid cell line (LCL), GM12878, were used to identify PIRs within our 1-Mb region.22,42 In brief, PCHi-C, uses Hi-C libraries with biotinylated RNA baits complementary to the ends of all promoter-containing restriction fragments to enrich for promoter sequences. The promoters and the genome pieces with which promoter fragments interact are captured and sequenced. These paired pieces are then tested for statistical significance to identify PIRs.20,24 PIRs are important, as variation in these regions can be connected to potential gene targets and may thus affect gene function.23 To determine if significant variants were in PIRs, SNP positions for associated variants were superimposed on a map of significant bait–target pairs in the GM12878 cell line.22,42
Results
Patient and donor characteristics
Patient and donor characteristics are shown in Table 1. AML and MDS proportions and donor age and graft source differed between cohorts (P < .001). The study design is shown in Figure 1.
Characteristics of patients enrolled in the study
| Category/characteristics | Cohort 1 (N = 1584), n (%) | Cohort 2 (N = 669), n (%) | Cohort with sST2 level measurements (N = 756), n (%) |
|---|---|---|---|
| Recipient age, y | |||
| ≥40 | 1132 (71) | 481 (72) | 532 (70) |
| <40 | 452 (29) | 188 (28) | 224 (30) |
| Donor age, ya | |||
| ≥30 | 963 (61) | 347 (52) | 392 (52) |
| <30 | 621 (39) | 322 (48) | 364 (48) |
| Recipient sex | |||
| Female | 723 (46) | 303 (45) | 340 (45) |
| Male | 861 (54) | 366 (55) | 416 (55) |
| Donor sex | |||
| Female | 498 (31) | 181 (27) | 198 (26) |
| Male | 1086 (69) | 488 (73) | 558 (74) |
| Blood mismatch | |||
| No type mismatch | 674 (43) | 293 (44) | 332 (44) |
| Donor–recipient mismatch | 910 (57) | 376 (56) | 424 (56) |
| Anti-thymocyte globulin/alemtuzumab prophylaxis* | |||
| No | 1074 (68) | 396 (59) | 477 (63) |
| Yes | 407 (26) | 273 (41) | 277 (37) |
| Missing | 103 (7) | 0 (0) | 2 (0.3) |
| Obese BMI | |||
| No | 1084 (68) | 446 (67) | 500 (66) |
| Yes | 500 (32) | 223 (33) | 256 (34) |
| Overweight BMI | |||
| No | 1079 (68) | 444 (66) | 508 (67) |
| Yes | 505 (32) | 225 (34) | 248 (33) |
| Graft typea | |||
| Bone marrow | 505 (32) | 161 (24) | 260 (34) |
| Peripheral blood | 1079 (68) | 508 (76) | 496 (66) |
| Conditioning intensity | |||
| Myeloablative | 1079 (68) | 453 (68) | 549 (73) |
| Reduced intensity | 505 (32) | 216 (32) | 207 (27) |
| Total body irradiation | |||
| No | 1021 (64) | 472 (71) | 489 (65) |
| Yes | 563 (36) | 197 (29) | 267 (35) |
| Disease status at diagnosis | |||
| Early | 1107 (70) | 428 (64) | 486 (64) |
| Advanced | 477 (30) | 241 (36) | 270 (36) |
| Recipient CMV status | |||
| Negative | 716 (45) | 306 (46) | 361 (48) |
| Positive | 868 (55) | 363 (54) | 395 (52) |
| Donor CMV status | |||
| Negative | 1080 (68) | 472 (71) | 513 (68) |
| Positive | 504 (32) | 197 (29) | 243 (32) |
| Diagnosed with AMLa | |||
| No | 337 (21) | 192 (29) | 208 (28) |
| Yes | 1247 (79) | 477 (71) | 548 (72) |
| Diagnosed with MDS | |||
| No | 1247 (79) | 477 (71) | 548 (72) |
| Yes | 337 (21) | 192 (29) | 208 (28) |
| Primary cause of death | |||
| aGVHD | 95 (0.06) | 56 (0.08) | 49 (0.06) |
| Infection | 86 (0.05) | 25 (0.04) | 36 (0.05) |
Significant difference between cohorts 1 and 2 (P < .001).
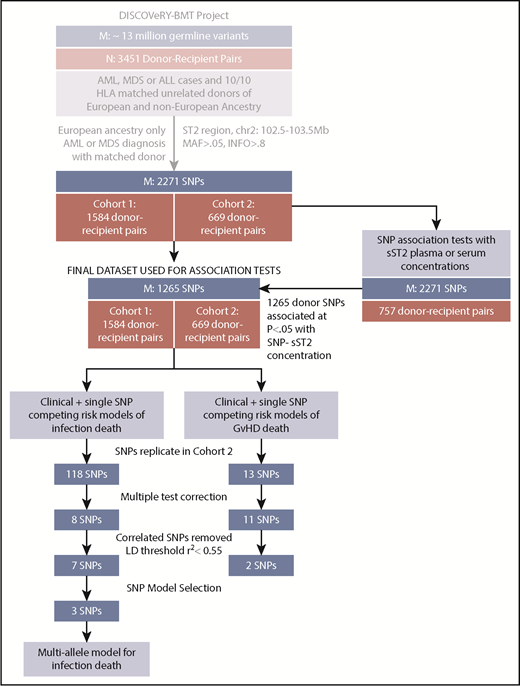
Study schema showing analytic workflow. The flow diagram shows the selection process for both the samples (N) and SNPs (M) for analyses of aGVHD and infection death in the DISCOVeRY-BMT study.
Study schema showing analytic workflow. The flow diagram shows the selection process for both the samples (N) and SNPs (M) for analyses of aGVHD and infection death in the DISCOVeRY-BMT study.
SNP–sST2 plasma and serum concentration associations
We tested the associations of donor SNPs selected from the 1-Mb region around IL1RL1 with donor sST2 concentrations. In total, 1265 donor SNPs were associated at P < .05 with donor sST2 serum/plasma concentrations, represented by 93 independent variants (r2 = 0.60 and MAF = 0.05; Figures 1 and 2). Recipient SNP association with sST2 serum/plasma concentrations showed 664 SNPs at P < .05, represented by 11 independent variants (supplemental Table 1). All donor and recipient SNPs that were associated with sST2 levels at P < .05 replicated in same direction of effect as seen in the genomic atlas of human plasma proteome.13 Effect sizes of recipient SNP associations with sST2 levels were smaller with larger standard errors than donor SNP–sST2 associations. These 1265 donor SNPs were then tested for association with recipient death due to aGVHD and infection by using competing risk models (Figure 1). Although the recipient SNP–sST2 associations were less compelling, for comprehensiveness, these 1265 SNPs were also tested for association in the recipient population.
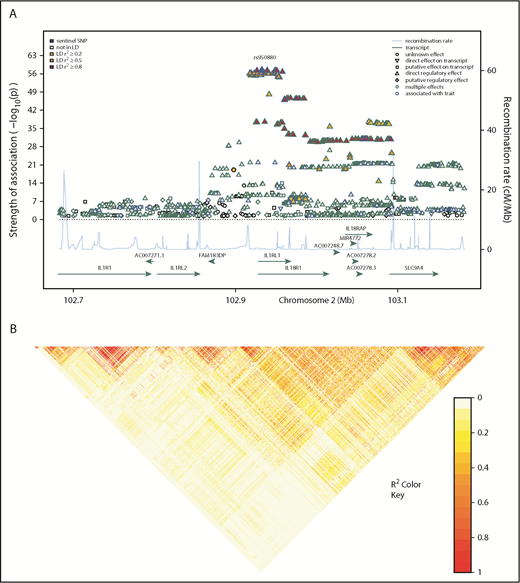
Regional association plot showing donor SNP associations with sST2 concentrations in plasma and serum and LD structure of the IL1RL1 region. (A) Genomic positions of SNPs are shown in mega-bases on the x-axis with mapped genes labeled by their HGNC symbols. –log10P values obtained from linear regression models of donor SNPs on log-transformed sST2 concentrations in serum and plasma are shown on the left y-axis. The shape of the data point indicates the regulatory effect of the SNP; line color of the shape denotes associations from previous studies, where blue and green show genome-wide association with a trait and multiple effects (GWAS hit or association with gene expression or methylation levels), respectively. These colors indicate that a majority of the associated SNPs showed a direct regulatory effect on a transcript, indicating the denoted region contained multiple eQTL. Fill color for each SNP indicates the r2 with the sentinel SNP, rs950880 (our most significant SNP-sST2 association), shown in a yellow-red gradient, with yellow indicating low LD (r2 < 0.2) and red, high LD (r2 > 0.8). Blue line coupled with the right y-axis shows the recombination rate in centi-Morgan (cM) per megabase. (B) Pairwise-LD heatmap of the region showing pairwise r2 between SNPs. Brighter red indicates stronger correlation between SNP pairs.
Regional association plot showing donor SNP associations with sST2 concentrations in plasma and serum and LD structure of the IL1RL1 region. (A) Genomic positions of SNPs are shown in mega-bases on the x-axis with mapped genes labeled by their HGNC symbols. –log10P values obtained from linear regression models of donor SNPs on log-transformed sST2 concentrations in serum and plasma are shown on the left y-axis. The shape of the data point indicates the regulatory effect of the SNP; line color of the shape denotes associations from previous studies, where blue and green show genome-wide association with a trait and multiple effects (GWAS hit or association with gene expression or methylation levels), respectively. These colors indicate that a majority of the associated SNPs showed a direct regulatory effect on a transcript, indicating the denoted region contained multiple eQTL. Fill color for each SNP indicates the r2 with the sentinel SNP, rs950880 (our most significant SNP-sST2 association), shown in a yellow-red gradient, with yellow indicating low LD (r2 < 0.2) and red, high LD (r2 > 0.8). Blue line coupled with the right y-axis shows the recombination rate in centi-Morgan (cM) per megabase. (B) Pairwise-LD heatmap of the region showing pairwise r2 between SNPs. Brighter red indicates stronger correlation between SNP pairs.
SNP associations with death due to aGVHD
There were 95 aGVHD primary-cause deaths in cohort 1 and 56 in cohort 2 (Table 1).29 Multivariate aGVHD competing risk models constructed using AIC included AML diagnosis, recipient obesity (>30 mg/kg2), peripheral blood cell source, and donor age. No other variables were selected for inclusion in the model (supplemental Table 2).
Meta-analysis of competing risk results from cohorts 1 and 2 for all 1265 donor sST2-associated SNPs with aGVHD death are shown in supplemental Table 3. Correction for 93 independent variants yielded a significant P < 5.4 × 10⁻⁴; all variants with P less than this value were considered significant. We identified 11 aGVHD death-associated SNPs (Figure 3A). Stepwise competing risk analyses identified rs2310241 and rs2241131 (Table 2). The risk alleles at rs2310241-A and rs2241131-C correlated with higher levels of sST2 (P = 1.3 ×10⁻⁴ and P = 5.0×10⁻⁵, respectively) and increased risk of aGVHD death (HR = 1.5; Pmeta = 3.3 × 10⁻⁴, and HR = 1.7; Pmeta = 2.6×10⁻⁴, respectively), for each additional donor risk allele (supplemental Table 3). There was no evidence of heterogeneity of effect between cohorts. To assess the robustness of the association, we excluded patients with infection as a secondary cause of death (∼38% of all aGVHD primary deaths); the results remained consistent after excluding these patients (Figure 3A). The SNPs correlated modestly (r2 = 0.52), and the AIC including both variants was approximately equivalent to those of the single SNP models; thus, no additional information was gained from including both SNPs in a multiallele model. Cumulative incidence curves for rs2310241 and rs2241131 are shown in Figure 4. None of the significant aGVHD SNPs were associated with the competing risk model of TRM or the Cox proportional hazards models of OS.
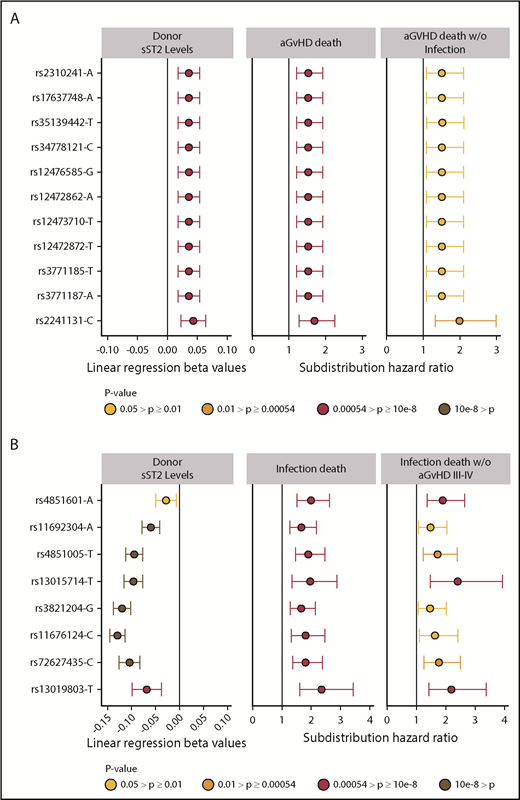
Significant sST2-donor SNP association β values and hazard ratios for aGVHD death and infection death. Plots show the relationship of donor SNPs with sST2 levels in donors and death from aGVHD death (A) and infection (B). SNPs are shown in the y-axis with rs identification (ID) and the effect allele, in order by chromosome position. The point colors indicate the P values of the SNP for each analysis. Only SNPs that pass multiple test correction are included in the panel. The left column shows the coefficient β values with confidence intervals (CIs) of donor SNP associations with sST2 plasma/serum levels. The middle column shows subdistribution hazard ratios and CIs from competing risk models with aGVHD death as primary cause. The right column shows results from competing risk models of aGVHD death as the primary cause without infection. (B) The left panel shows the coefficient β values with CIs of donor SNP associations with sST2 plasma/serum levels. The middle panel shows subdistribution hazard ratios from a cox proportional model and competing risk model (HRs) and CIs of competing risk models with death caused by infection. The right column shows results from competing risk models with death due to infection among patients who did not experience aGVHD III-IV.
Significant sST2-donor SNP association β values and hazard ratios for aGVHD death and infection death. Plots show the relationship of donor SNPs with sST2 levels in donors and death from aGVHD death (A) and infection (B). SNPs are shown in the y-axis with rs identification (ID) and the effect allele, in order by chromosome position. The point colors indicate the P values of the SNP for each analysis. Only SNPs that pass multiple test correction are included in the panel. The left column shows the coefficient β values with confidence intervals (CIs) of donor SNP associations with sST2 plasma/serum levels. The middle column shows subdistribution hazard ratios and CIs from competing risk models with aGVHD death as primary cause. The right column shows results from competing risk models of aGVHD death as the primary cause without infection. (B) The left panel shows the coefficient β values with CIs of donor SNP associations with sST2 plasma/serum levels. The middle panel shows subdistribution hazard ratios from a cox proportional model and competing risk model (HRs) and CIs of competing risk models with death caused by infection. The right column shows results from competing risk models with death due to infection among patients who did not experience aGVHD III-IV.
Independent significant SNP associations with GVHD death and infection deaths
| Cohort 1 | Cohort 2 | Meta analyses of cohorts 1 and 2 | |||||||
|---|---|---|---|---|---|---|---|---|---|
| Primary cause of death/SNP | SNP position on chr 2 (hg19) | Allele (ref/risk) | Risk allele frequency (C1/C2) | HR (95% CI) | P | HR (95% CI) | P | HR (95% CI) | P |
| GVHD | |||||||||
| rs2241131* | 102804041 | A/C | 0.69/0.72 | 1.46 (1.05-2.02) | .024 | 2.71 (1.53-4.82) | 6.7 × 10⁻⁴ | 1.69 (1.28-2.25) | 2.6 × 10⁻⁴ |
| rs2310241* | 102841949 | C/A | 0.51/0.54 | 1.37 (1.01-1.84) | .04 | 1.81 (1.25-2.62) | 1.6 × 10⁻³ | 1.53 (1.21-1.92) | 3.3 × 10⁻⁴ |
| Infection | |||||||||
| rs11676124* | 102941338 | T/C | 0.62/0.61 | 1.7 (1.2-2.4) | 3 × 10⁻³ | 2.39 (1.15-4.99) | .02 | 1.81 (1.32-2.47) | 2.2 × 10⁻⁴ |
| rs11692304 | 103095404 | G/A | 0.47/0.48 | 1.61 (1.19-2.16) | 2 × 10⁻³ | 1.95 (1.03-3.7) | .041 | 1.66 (1.27-2.18) | 2.2 × 10⁻⁴ |
| rs13015714 | 102971865 | G/T | 0.77/0.76 | 1.79 (1.17-2.73) | 8 × 10⁻³ | 2.92 (1.22-6.97) | .016 | 1.96 (1.34-2.88) | 5.3 × 10⁻⁴ |
| rs72627435* | 102897739 | T/C | 0.21/0.20 | 1.76 (1.29-2.4) | 3.8 × 10⁻⁴ | 2.01 (1.09-3.69) | .024 | 1.81 (1.37-2.38) | 2.8 × 10⁻⁵ |
| rs4851005 | 103011552 | C/T | 0.37/0.34 | 1.85 (1.38-2.47) | 3.3 × 10⁻⁵ | 2.17 (1.15-4.09) | .017 | 1.9 (1.46-2.47) | 1.9 × 10⁻⁶ |
| rs13019803 | 102776202 | C/T | 0.08/0.08 | 2.31 (1.51-3.53) | 1.1 × 10⁻⁴ | 2.53 (1.11-5.77) | .028 | 2.35 (1.61-3.43) | 8.9 × 10⁻⁶ |
| rs4851601* | 103116261 | G/A | 0.28/0.26 | 2.01 (1.48-2.73) | 8.3 × 10⁻⁶ | 1.92 (1.03-3.6) | .042 | 1.99 (1.51-2.62) | 9.7 × 10⁻⁷ |
| Multiallele | — | GCG/TTA | 1.94 (1.54-2.44) | 1.8 × 10⁻⁸ | 2.24 (1.36-3.69) | .002 | 1.99 (1.61-2.45) | 1.2 × 10⁻¹⁰ | |
SNP associations with GVHD death are adjusted for AML diagnosis, recipient obesity (>30 mg/kg2), donor age, and peripheral blood cell source. SNP associations with infection death are adjusted for recipient age, advanced disease at HCT, and recipient and donor CMV status. For infection, we computed a multiallele model that included the clinical covariates plus a variable collapsing the SNPs shown in bold, such that recipients have between 0 and 6 donor risk alleles. For GVHD, SNPs showed some LD (r2 = 0.52) and were thus better markers alone than collectively. Cohort 1 (C1), n = 1584; cohort 2 (C2), n = 669.
hg19, position according to human reference genome version hg19; Ref, reference allele; Risk, risk allele.
SNP is imputed.
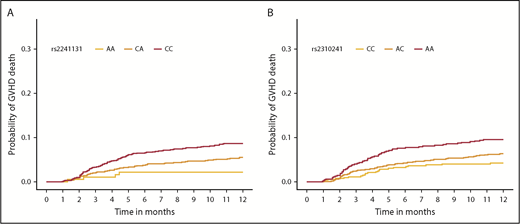
Cumulative incidence function of aGVHD death, according to donor SNP. The cumulative incidence of aGVHD death in the first year after HCT by rs2241131 (A) and rs2310241 (B) genotypes.
Cumulative incidence function of aGVHD death, according to donor SNP. The cumulative incidence of aGVHD death in the first year after HCT by rs2241131 (A) and rs2310241 (B) genotypes.
No recipient SNPs were associated with aGVHD death. rs3917290, the most significant recipient SNP associated with aGVHD death in cohorts 1 (P = .015) and 2 (P = .17), were not associated with sST2 at P < .05.
sST2–SNP associations with death caused by infection
There were 86 and 25 deaths in which infection was the primary cause in cohorts 1 and 2, respectively (Table 1).29 In 92% of cases, infection deaths were confirmed by a culture or biopsy of the organism, and almost one-third of the patients had autopsy records available for review, confirming infection as the cause of death.29 Causes of infection death and affected organs are shown in supplemental Figure 1A-B. Multivariate clinical models of infection death, constructed using AIC, included recipient age, advanced disease at HCT, donor+/recipient− CMV status, and peripheral blood cell source (supplemental Table 2). Results of competing risk models of infection death, including clinical variables, and each of the 1265 donor SNPs are shown in supplemental Table 4. Upon multiple-test correction, 7 independent SNPs were found to be associated with infection death (Table 2). There was no evidence of heterogeneity of effect between cohorts, and thus random-effects models were not used.
The final model included recipient age, advanced disease at HCT, donor+/recipient− CMV status, peripheral blood cell rs4851601 (Pmeta = 9.7 × 10⁻⁷), rs13019803 (Pmeta = 8.9 × 10⁻⁶), and rs13015714 (Pmeta = 5.3 × 10⁻⁴), with risk alleles at each SNP increasing risk of infection death approximately twofold. Figure 3B shows the associated donor alleles at each SNP associated with lower donor sST2 levels at rs4851601 (P = .01), rs13019803 (P = 1.6 × 10⁻⁵), and rs13015714 (1.2 × 10⁻²⁰). To assess the robustness of the association of the infection risk variants, we excluded patients with aGVHD III-IV (29% of all deaths from primary infection), and the results remained consistent after the patients were excluded (Figure 3B).
The multiallele model with rs4851601, rs13019803, and rs13015714 showed an increased risk of infection death of ∼2- and 2.25-fold in cohorts 1 (P = 1.8 × 10⁻⁸) and 2 (P = .002), respectively (Table 2; Figure 5). The risk allele T in rs13019803 translated to an increased risk of TRM (HRmeta = 1.51; 95% meta CI [CImeta] 1.21-1.88; Pmeta = 2.1 × 10⁻⁴), but not OS (HRmeta = 1.16; 95% CImeta [0.94-1.45]; Pmeta = .17). The other infection risk variants were not associated with TRM or OS.
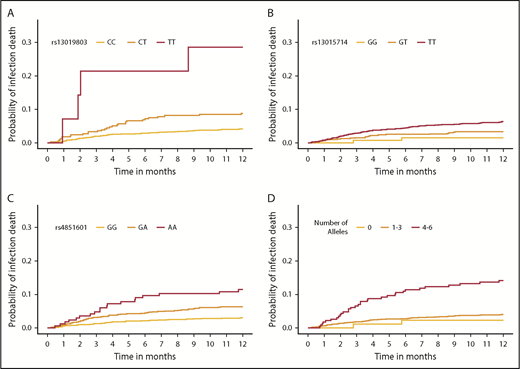
Cumulative incidence function of infection death, according to donor SNPs. The cumulative incidence of GVHD death in the first year after HCT by rs13019803 (A), rs13015714 (B), rs4851601 (C), and a multiallele model (D). (A-C) The multiallele model is the allele dosage sum of all 3 infection SNPs and was categorized for the number of total risk alleles: 0, 1 to 3, and 4 to 6, respectively.
Cumulative incidence function of infection death, according to donor SNPs. The cumulative incidence of GVHD death in the first year after HCT by rs13019803 (A), rs13015714 (B), rs4851601 (C), and a multiallele model (D). (A-C) The multiallele model is the allele dosage sum of all 3 infection SNPs and was categorized for the number of total risk alleles: 0, 1 to 3, and 4 to 6, respectively.
No recipient SNPs were associated with death due to infection after correction for multiple testing. rs1922296, the most significant recipient SNP associated with infection death in cohorts 1 (P = .05) and 2 (P = .48), was not associated with sST2 at P < .05 (data not shown).
Annotation of significantly associated variants
Annotation of donor SNPs associated with death due to aGVHD.
Data from the genomic atlas of human plasma proteome,13 corroborate the associations we identified between higher IL1RL1 protein plasma levels and aGVHD death-risk alleles at rs2310241 and rs2241131. Although we did not measure IL1R2 protein levels in DISCOVeRY-BMT, the genomic atlas of the human plasma proteome13 showed that these risk alleles also correlate with increased IL1R2 plasma protein levels (P < 5 × 10⁻⁶).13 Multiple databases showed that the risk allele at rs2310241 correlates with higher IL18R1 expression in whole blood (P = 1 × 10−54), and both risk alleles at rs2310241 and rs2241131 significantly associate (P < 5 × 10⁻⁸) with increased IL18RAP expression in whole blood.18,43-46 Data extracted from the PhenoScanner database showed that the associated SNPs were adjacent to multiple GWAS SNPs (Figure 6A-B). In HSCs, B- and T-cells from the Epigenome Road Map dataset (supplemental Table 7), rs2310241 is located in or directly adjacent to (<900 base pairs) active enhancer regions, and rs2241131 resides in an upstream promoter region (Figure 6C-D). Furthermore, publicly available PCHi-C data from the LCL show that rs2310141 also interacts with enhancers near IL18RAP and IL1R2. In the same LCL, both rs2310241 and rs2241131 reside in PCHi-C target regions that interact with the promotors upstream of the transcription start site in IL1RL2 and MAP4K4 (supplemental Figure 2A-B; supplemental Table 5).
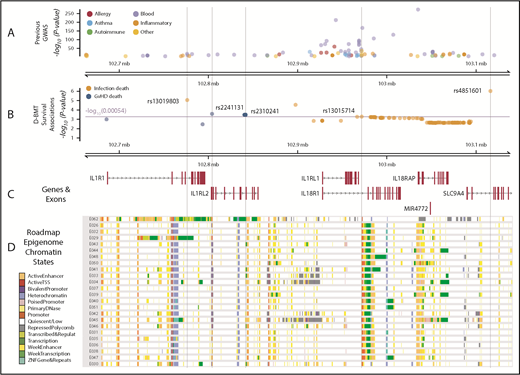
IL1RL1 region with associated SNP Pvalues annotated with previous GWAS and Roadmap Epigenome chromatin states. (A) GWAS SNPs in the IL1RL1 region SNPs are classified by broad phenotypes indicated by the colored circles; all variants are associated at P < 5 × 10⁻⁸. (B) SNP associations in the IL1RL1 region with infection death and aGVHD death at P < .05 in cohort 1 and replicated in cohort 2. All variants above the multiple test correction line (red) are considered significant. The x-axis is the chromosome position in megabase pairs and y-axis shows the −log10 (P values) for aGVHD and infection death. The higher the −log10 number, the lower the P. The SNPs selected using step-AIC for multi-allele models, for death from aGVHD (rs2241131 and rs2310241), and infection (rs4851601, rs13019803 and rs13015714) are highlighted with dashed lines drawn through the point to show the relationship of the variant to GWAS hits and epigenome road map data. (C) Genes in the region were mapped from UCSC build hg19, based on the known Gene Track (C) and annotated with chromatin states from Roadmap Epigenome project (D) for all blood, T cells, HSCs and B cells. The cell line numbers shown down the left side correspond to specific Roadmap Epigenome cell line identifiers (supplemental Table 7). The colors indicate ChromHmm status which is shown in the key.
IL1RL1 region with associated SNP Pvalues annotated with previous GWAS and Roadmap Epigenome chromatin states. (A) GWAS SNPs in the IL1RL1 region SNPs are classified by broad phenotypes indicated by the colored circles; all variants are associated at P < 5 × 10⁻⁸. (B) SNP associations in the IL1RL1 region with infection death and aGVHD death at P < .05 in cohort 1 and replicated in cohort 2. All variants above the multiple test correction line (red) are considered significant. The x-axis is the chromosome position in megabase pairs and y-axis shows the −log10 (P values) for aGVHD and infection death. The higher the −log10 number, the lower the P. The SNPs selected using step-AIC for multi-allele models, for death from aGVHD (rs2241131 and rs2310241), and infection (rs4851601, rs13019803 and rs13015714) are highlighted with dashed lines drawn through the point to show the relationship of the variant to GWAS hits and epigenome road map data. (C) Genes in the region were mapped from UCSC build hg19, based on the known Gene Track (C) and annotated with chromatin states from Roadmap Epigenome project (D) for all blood, T cells, HSCs and B cells. The cell line numbers shown down the left side correspond to specific Roadmap Epigenome cell line identifiers (supplemental Table 7). The colors indicate ChromHmm status which is shown in the key.
Annotation of donor SNPs associated with death due to infection.
Publicly available data in the genomic atlas of the human plasma proteome13 corroborate the associations the we identified between lower IL1RL1 protein plasma levels and infection death risk alleles at rs13015714 (P = 2.1 × 10−115), rs4851601 (P = 2.1 × 10⁻⁷), and rs13019803 (P = 1.4 × 10⁻²⁸). Although we did not measure other proteins, the genomic atlas provided strong evidence that the T allele at rs13015714 is associated with decreased levels of IL-18 receptor-1 protein, encoded by IL18R1 (β = −0.90 ± 0.026; P = 1.3 × 10−264). In addition, eQTLgen28 data showed that increased gene expression of IL-18 receptor–associated protein (IL18RAP; P = 3.3 × 10−310) correlates with the rs13015714 T allele,13 and GTex data indicated that the T variant correlates with decreased expression of IL1RL1 in lung (β = −0.38 ± 0.031; P = 4.0 × 10−118).17 Data extracted from the PhenoScanner database19 showed that the infection death risk variants reside in a region with dozens of GWAS hits (Figure 6A) for multiple blood traits and inflammatory and autoimmune diseases (supplemental Table 6). The Epigenome Road Map showed rs13015714 is in the 3′ end of IL1RL1 and located in an upstream promoter across blood, HSC, T-cell and B-cell lines (Figure 5C; supplemental Table 7).18 Phi-C data from the LCL showed that all 3 infection-associated donor SNPs (rs13015714, rs4851601, and rs13019803), reside in target regions for enhancers near IL18RAP (supplemental Figure 3A-C; supplemental Table 5).42
Discussion
Before HCT, identification of patients at risk of death associated with aGVHD or infection could alter approaches to GVHD and infection prophylaxis or donor selection. To date, individual SNP associations with aGVHD and infection death have not been successfully replicated or validated, which is attributable to small sample sizes and the fact that a large majority of variants tested for association have been shown to have no biochemical function.31 A recent study using SNPs in cytokine genes constructed high- and low-risk groups for acute GVHD incidence; however, predictive genetic models were not significant for nonrelapse mortality.47 By leveraging the large sample size and relatively homogenous independent cohorts of DISCOVeRY-BMT, we are uniquely placed to address this question and have adequate statistical power to test donor SNPs in this region for association with aGVHD or infection death.
We replicated the published sST2–SNP associations in DISCOVeRY-BMT HCT donors, and, in patients with AML or MDS, there was a correlation between sST2 levels and SNPs in the IL1RL1 region, although the signal was mutated. As expected, we demonstrated that alleles that correlated with high sST2 levels in donors correlated with death caused by aGVHD. In addition, both the aGVHD death risk loci, but not infection death loci, correlated with IL1R2 plasma protein levels.13,19 Higher IL1R2 protein levels have been shown to be robustly and significantly associated with GVHD mortality after transplantation into recipients, independent of sST2 associations, as shown in supplemental Table 8 in Vander Lugt et al.1 This biomarker remains underexplored in patients and donors.
IL1RL1 donor alleles associated with low sST2 levels were significantly associated with recipient risk of death from infection. For the donor T allele in rs1308491, linked with both low donor sST2 and significant hazard of recipient infection death, this association was strong enough to translate to an increased hazard of TRM. Our novel finding in DISCOVeRY-BMT that low sST2 levels correlate with a poor health outcome (death due to infection) is not without precedent; the T allele in rs13019803 has been shown in a large heart health study to correlate with higher mortality.11 Alleles of the SNPs that show an increased risk of infection death have consistently been shown to reduce the risk of inflammatory diseases, such as asthma, atopic dermatitis, celiac disease, Crohn’s disease, and IBD. For example, the T allele at rs13015714 is in perfect linkage disequilibrium (LD; r2 = 1) with the C allele of rs2001461, shown to be inversely associated with genome-wide significant risk of atopic dermatitis, celiac disease, Crohn’s disease, and IBD.25,48-53 In addition, variants in LD (r2 = 1) with rs13015714 are shown to be enriched in the transcription factor T-bet, which specifies Th1 lineage and represses alternative T-cell fates.54 Together, ChIP-seq and IL18RAP gene expression data indicate that the T allele at rs13015714 has increased T-bet binding and IL18RAP expression.54 Our risk variant thus alters the binding of a lineage-specific transcription factor and gene expression of one of the genes (IL18RAP) that forms the IL-18 receptor; IL-18 synergizes with IL-12 to induce interferon-γ.54
Immune response can act as a double-edged sword, where attenuated response can lead to infection and too strong a response can cause deleterious inflammation.55 Because many cellular mechanisms and pathways overlap between infection defense and inflammation, it may be plausible to think that variants that render healthy donors more susceptible to inflammation (ie, the T allele at rs13015714) would actually protect immunosuppressed patients from infection. In other words, donors with these genetic variants would have a higher probability of having a more “reactive” immune system, which would help patients to fight infections better, once the donor cells are grafted. This would also be consistent with the fact that, for example, the T allele of rs13015714 is significantly associated with increased lymphocyte count (P = 1.7 × 10⁻¹⁴), as shown in a 2016 paper in Cell that captured allelic associations with blood cell traits.28 Therefore, lower levels of an inflammatory marker like sST2 in donors could suggest that donor cells will be less likely to protect against infection in the patient. In addition, it is possible that the low sST2 and increased risk of an infection–death relationship may actually reflect what is occurring with membrane ST2 more than soluble ST2.
Indeed, in murine GVHD models, we have recently shown that sST2 is secreted by intestinal proinflammatory T cells during gut inflammation; conversely, protective ST2-expressing regulatory T cells are decreased.56 High membrane ST2, equivalent to low sST2, may be anti-inflammatory, thereby limiting responses against pathogens. Mice are housed in conditions that prevent infection, but a murine model of low-sST2 infection-associated death is needed. This 1-Mb region plays an important role in the tuning of the immune response,13 and these variants are likely to partially dictate the fine balance between infection and inflammation.
The strengths of our study include a large, relatively homogenous sample size; well-characterized survival outcomes; and the availability of both donor and recipient genotypes. In addition, the nonrisk alleles in 4 of the 5 aGVHD and infection death–associated variants are common (>5%) across multiple races and ethnicities, meaning that there is the potential for validating the DISCOVeRY-BMT findings in other populations. Despite the large sample size, the number of patients who died of infection was not large enough to allow us to investigate death due to specific infections, and patient death from aGVHD did not comprise a large portion of our patient population, thus reducing our power to detect smaller effect sizes. An additional limitation is the lack of longitudinal analyses; specifically, we did not measure the relationship of the donor genotype with recipient sST2 levels after transplantation.
Evidence from independent experiments showed that genetic variants in the IL1RL1 region predicted IL1RL1 and IL1R2 protein levels, correlated with expression of multiple genes, and affected binding of important transcription factors. Data from our HCT donors corroborated the SNP association with sST2 levels and showed that these SNPs in the IL1RL1 region correlated with increased risk of death from aGVHD or infection. Given further cell line experiments and replication in more diverse cohorts, these donor SNPs could be used in improved donor selection to help reduce the risk of such deaths in patients with AML or MDS who undergo HLA-matched unrelated HCT.
The full-text version of this article contains a data supplement.
Acknowledgments
This work was supported by grants from the National Institutes of Health (NIH). Funding was provided by NIH, National Heart, Lung, and Blood Institute (NHLBI; 1R01HL102278); NIH, National Cancer Institute (NCI; 1R03CA188733) (L.E.S.-C. and T.E.H.); and a Pelotonia Foundation Graduate Student Fellowship (E.K.). Any opinions, findings, and conclusions expressed in this material are those of the authors and do not necessarily reflect those of the Pelotonia Fellowship Program or The Ohio State University. S.P. was supported by grants from NIH, NCI (R01CA168814), the National Institute of Child Health and Human Development (R01HD074587 and U54HD090215), and the Leukemia & Lymphoma Society (1293-15). The CIBMTR is supported by Public Health Service Grant/Cooperative Agreement 5U24-CA076518 from the NCI, NHLBI, and the National Institute of Allergy and Infectious Diseases; Grant/Cooperative Agreement 5U10HL069294 from NHLBI and NCI; contract HHSH250201200016C with Health Resources and Services Administration (HRSA/DHHS); and grants N00014-15-1-0848 and N00014-16-1-2020 from the Office of Naval Research. Further funding was received from Alexion; Amgen, Inc.; an anonymous donation to the Medical College of Wisconsin; Astellas Pharma US; AstraZeneca; Be the Match Foundation; Bluebird Bio, Inc.; Bristol Myers Squibb Oncology; Celgene Corporation; Cellular Dynamics International, Inc.; Chimerix, Inc.; Fred Hutchinson Cancer Research Center; Gamida Cell, Ltd.; Genentech, Inc.; Genzyme Corporation; Gilead Sciences, Inc.; Health Research, Inc.; Roswell Park Cancer Institute; HistoGenetics, Inc.; Incyte Corporation; Janssen Scientific Affairs, LLC; Jazz Pharmaceuticals, Inc.; Jeff Gordon Children’s Foundation; The Leukemia & Lymphoma Society; Medac, GmbH; MedImmune; The Medical College of Wisconsin; Merck & Co, Inc.; Mesoblast; MesoScale Diagnostics, Inc.; Miltenyi Biotec, Inc.; National Marrow Donor Program; Neovii Biotech NA, Inc.; Novartis Pharmaceuticals Corporation; Onyx Pharmaceuticals; Optum Healthcare Solutions, Inc.; Otsuka America Pharmaceutical, Inc.; Otsuka Pharmaceutical Co, Ltd., Japan; Patient-Centered Outcomes Research Institute; Perkin Elmer, Inc.; Pfizer, Inc; Sanofi US; Seattle Genetics; Spectrum Pharmaceuticals, Inc.; St. Baldrick’s Foundation; Sunesis Pharmaceuticals, Inc.; Swedish Orphan Biovitrum, Inc.; Takeda Oncology; Telomere Diagnostics, Inc.; University of Minnesota; and Wellpoint, Inc.
The views expressed in this article do not reflect the official policy or position of the National Institutes of Health, the Department of the Navy, the Department of Defense, Health Resources and Services Administration or any other agency of the US Government.
Authorship
Contribution: E.K., S.P., and L.E.S.-C. designed and performed the research and analysis and wrote the manuscript; S.P. and A.J.D. measured the ST2 levels; E.K., J.W., A.A.R., L.E.S.-C., and L. Preus analyzed the data and generated the figures; C.A.H., D.S., L. Pooler, L. Preus, S.L., L.Y., Q.L., Q.Z., M.D.H., T.W., A.W., and G.B. performed genotyping, imputation and/or data quality control; T.H. helped design the research, interpreted the results, and edited the paper; P.L.M., M.C.P., S.J.L., and S.R.S. interpreted the results and edited the paper; and all authors reviewed and approved the manuscript.
Conflict-of-interest disclosure: S.P. holds the patent, “Methods of detection of graft-versus-host disease” (US 20130115232A1, WO2013066369A3), licensed to Viracor-IBT Laboratories. The remaining authors declare no competing financial interests.
Correspondence: Lara E. Sucheston-Campbell, The Ohio State University, 604 Riffe Building, 496 W 12th Ave, Columbus, OH 43210; e-mail: sucheston-campbell.1@osu.edu; and Sophie Paczesny, Indiana University School of Medicine, 1044 W Walnut St, Room 425, Indianapolis, IN 46202; e-mail: sophpacz@iu.edu.

