

Key Points
DNA methylation signatures can be used to divide IGHV-mutated CLL into clinically relevant subgroups.
The memory-like DNA methylation subgroup is an independent marker of prolonged survival for patients treated with chemoimmunotherapy.

Abstract
Chronic lymphocytic leukemia patients with mutated immunoglobulin heavy-chain genes (IGHV-M), particularly those lacking poor-risk genomic lesions, often respond well to chemoimmunotherapy (CIT). DNA methylation profiling can subdivide early-stage patients into naive B-cell–like CLL (n-CLL), memory B-cell–like CLL (m-CLL), and intermediate CLL (i-CLL), with differing times to first treatment and overall survival. However, whether DNA methylation can identify patients destined to respond favorably to CIT has not been ascertained. We classified treatment-naive patients (n = 605) from 3 UK chemo and CIT clinical trials into the 3 epigenetic subgroups, using pyrosequencing and microarray analysis, and performed expansive survival analysis. The n-CLL, i-CLL, and m-CLL signatures were found in 80% (n = 245/305), 17% (53/305), and 2% (7/305) of IGHV-unmutated (IGHV-U) cases, respectively, and in 9%, (19/216), 50% (108/216), and 41% (89/216) of IGHV-M cases, respectively. Multivariate Cox proportional analysis identified m-CLL as an independent prognostic factor for overall survival (hazard ratio [HR], 0.46; 95% confidence interval [CI], 0.24-0.87; P = .018) in CLL4, and for progression-free survival (HR, 0.25; 95% CI, 0.10-0.57; P = .002) in ARCTIC and ADMIRE patients. The analysis of epigenetic subgroups in patients entered into 3 first-line UK CLL trials identifies m-CLL as an independent marker of prolonged survival and may aid in the identification of patients destined to demonstrate prolonged survival after CIT.
Introduction
For many years, chemotherapy has been the mainstay of systemic therapy for patients with chronic lymphocytic leukemia (CLL) who have progressive and/or symptomatic disease. The German CLL Study Group CLL8 trial for previously untreated fit patients was the first to demonstrate that the addition of rituximab to fludarabine and cyclophosphamide (FCR) prolonged both progression-free survival (PFS) and overall survival (OS) compared with FC.1 Longer follow-up of patients receiving first line chemoimmunotherapy (CIT) with FCR both in CLL8 and in large observational studies shows a major survival benefit in the subgroup of patients with mutated immunoglobulin heavy chain variable genes (IGHV-M) lacking a TP53 deletion, who may achieve prolonged disease-free survival and OS.2-5 Targeted therapeutic agents have further improved patient outcomes, and recent reports suggest superiority of first-line ibrutinib with or without rituximab compared with CIT.6-8 However, long-term outcome data from studies comparing standard CIT with novel agents will be unavailable for many years, and in the interim, there remains clinical value in identifying novel biomarkers to refine the subgroup of patients who are most likely to achieve long-term survival with minimal toxicity after treatment with CIT.9
New insights have emerged from global DNA methylation profiling of normal B-cell subsets and large CLL cohorts, using both microarrays and whole-genome bisulphite sequencing.10,11 Using genome-wide analysis, patients with CLL can be grouped into 3 distinct epigenetic subclasses, namely, naive B-cell–like CLL (n-CLL), memory B-cell–like CLL (m-CLL), and intermediate CLL (i-CLL), that partially reflect the stage of B-cell maturation from which their tumors are derived. Queirós et al identified 5 epigenetic DNA methylation markers that are able to classify patients into these epigenetic subgroups with high accuracy.12 The authors demonstrated that the methylation of these markers is stable over time, and they and others have validated the utility of this classification system for predicting time to first treatment and OS in retrospective studies of predominantly early-stage patients.12
Although these data suggest that epigenetic classification represents a novel independent prognostic factor with potential clinical utility, its importance has not been validated in the context of clinical trials. To address this, we have studied 605 patients entered into UK chemotherapy and CIT trials. With this approach, we identify m-CLL as an independent marker of prolonged survival that may aid in the identification of patients destined to demonstrate protracted survival after CIT.
Methods
Patients, samples, and biomarker data
We studied treatment-naive patients entered into 3 randomized clinical trials, aiming to assess chemo and CIT; the UK Leukaemia Research Fund Chronic Lymphocytic Leukaemia 4 trial (UK LRF CLL4 [ClinicalTrials.gov identifier: NCT00004218]; n = 777), which compared chlorambucil and fludarabine with or without cyclophosphamide,13 and the UK National Cancer Research Network phase IIB trials, ADMIRE (ADM, UKCRN ID6897; n = 216),14 a randomized trial that compared the efficacy of FCR against FCR and mitoxantrone, and ARCTIC (ARC, UKCRN ID7136; n = 196),15 which compared FCR with FC, mitoxantrone, and low-dose rituximab (Table 1). All patients were diagnosed using standard morphologic and immunophenotypic criteria. Informed consent was obtained from all patients in accordance with the Declaration of Helsinki, and the Somerset Regional Ethics Committee approved the study.
Basic clinicobiological features of the ARC, ADM, and CLL4 trials
| Variable | ADM | ARC | CLL4 |
|---|---|---|---|
| Patients, n | 122 | 124 | 359 |
| Age at randomization, median (range), y | 62 (39-77) | 61 (36-80) | 64 (41-86) |
| Sex, n (%) | |||
| Male | 97 (80) | 90 (73) | 270 (75) |
| Female | 25 (20) | 34 (27) | 89 (25) |
| Binet stage, n (%) | |||
| A | 15 (12) | 23 (18.5) | 93 (26) |
| B | 61 (50) | 62 (50.5) | 155 (43) |
| C | 46 (38) | 39 (31) | 111 (31) |
| IGHV mutational status, n (%) | |||
| IGHV-U | 60 (52) | 65 (60) | 180 (61) |
| IGHV-M | 56 (48) | 43 (40) | 117 (39) |
| del(11q), n (%) | |||
| Absent | 98 (81) | 98 (82) | 256 (78) |
| Present | 23 (19) | 22 (18) | 72 (22) |
| del(17p), n (%) | |||
| Absent | 111 (92) | 111 (95) | 300 (93) |
| Present | 10 (8) | 6 (5) | 23 (7) |
| Epigenetic subgroup, n (%) | |||
| n-CLL | 52 (43) | 60 (49) | 186 (52) |
| i-CLL | 36 (29) | 34 (27) | 125 (35) |
| m-CLL | 34 (29) | 30 (24) | 48 (13) |
Material was available from 605 cases, with 124, 122, and 359 cases from ARC, ADM, and CLL4, respectively (supplemental Figure 1). No selection bias, except for age at randomization for ARC cases, was observed for samples selected to this current study compared with those of the entire trials (supplemental Table 1). All samples were taken at trial entry before initiation of treatment. The assessment of established biomarkers including FISH, CD38, ZAP70, and IGHV mutational status was performed as previously described.13 For CLL4, data on VH usage and IGHV stereotype were available. TP53, NOTCH1, and SF3B1 mutations were identified using a TruSeq Custom Amplicon panel (Illumina Inc., San Diego, CA) for ARC and ADM, and using a combination of molecular approaches for CLL4 (eg, high-resolution melt analyses combined with Sanger sequencing), as previously reported.16-19
Methylation analyses
Before DNA extraction (DNeasy Blood & Tissue Kit, Qiagen), CD5+/CD19+ B cells from ARC/ADM patients were purified using the EasySep Human B Cell enrichment kit (StemCell Technologies). Tumor purity of greater than 80% was confirmed with fluorescence-activated cell sorter analysis. For CLL4, historical DNA samples were used, extracted from samples with more than 80% tumor cells. For each case, 500 ng DNA underwent bisulfite modification, using the EZ-96 DNA Methylation-Gold Kit (ZymoResearch) before pyrosequencing (n = 605), or 450K methylation array analysis (n = 60). Pyrosequencing assays for 5 CpGs located in the promoter region of SCARF1 (cg00869668); in the gene body of B3GNTL1 (cg11472422), CTBP2 (cg17014214), and TNF (cg09637172); and in chromosome 14 intergenic region (cg03462096) were quantified (PyroMark Q24) in all available samples in triplicate (for primer sequences and additional methodological details, see supplemental Methods; supplemental Table 2). To confirm our pyrosequencing-based classification, 60 DNA samples were also processed with the 450k Human Methylation Array (Illumina), and data were normalized by the β Mixture Quantile method, using RnBeads.20 Epigenetic classification was performed using both pyrosequencing and 450k data with the support vector machine-learning (SVM) tool described by Queiros et al.12
Statistical analysis
As a result of similarities in inclusion criteria and outcome data, ARC and ADM patients were examined together. Furthermore, the 2 cohorts were not statistically significantly different for a panel of clinicobiological parameters14,15 (supplemental Table 3). As a consequence, for clinical associations and survival analysis, 2 cohorts were examined: 356 patients from CLL4, and 228 ARC/ADM cases. The effect of epigenetic subgroups on OS and PFS was assessed using Kaplan-Meier survival plots (log-rank test) and Cox proportional hazards analyses. Multivariable Cox regression models were used to evaluate the independent prognostic significance of the epigenetic classification. A step-wise backward elimination procedure was applied to an initial multivariable model that included all potential predictors with available data. The least significant variable was excluded from the initial model, one at a time, each time generating a new model. These steps were repeated until a final model was arrived at with only the significant predictors.
Overall response status in CLL4 was defined as complete or nodular partial response, partial response or nonresponse, or progressive disease. In ARC and ADM, minimal residual disease and treatment response were assessed at 3 months posttreatment, with the latter defined as complete remission and partial remission. In all trials, PFS was defined as the time from randomization to progression (ie, relapse needing further treatment) or death, or to the last clinical follow-up date for those who were alive with no progression. OS was defined as the time from randomization to death or to the last follow-up date for survivors, and was only assessed in the CLL4 study because of the limited follow-up in ARC and ADM. The clinicobiological associations were evaluated using the Pearson χ2 and Mann-Whitney U tests. All reported P values were 2-sided and were considered significant at the 5% level. Outcome data for PFS from CLL4 and ARC/ADM (January 2017 for ARC/ADM, October 2010 in CLL4), and OS from CLL4 (September 2016), were analyzed with STATA (v12.1) and SPSS (v23). Power calculations are shown in supplemental Methods.
Results
Microarray validation of pyrosequencing data
We employed pyrosequencing with subsequent SVM to classify 605 patients with CLL from the CLL4 and ARC/ADM cohorts into 3 epigenetic subgroups, as previously described. In doing so, we identified n-CLL, i-CLL, and m-CLL in 49.3% (n = 298), 32.2% (n = 195), and 18.5% (n = 112) of our patients, respectively (supplemental Table 4; supplemental Figure 2A). The accuracy of our pyrosequencing-based classification was validated in 60 cases, using the same SVM-based classification and β-values from the Infinium HumanMethylation450 BeadChip array. This comparison demonstrated a 95% concordance between techniques (57/60 cases; supplemental Figure 2B).
Epigenetic signature subgroups associate with key clinicobiological features
Immunoglobulin gene locus
Initially, we looked for any associations between the epigenetic subgroups and key structural features of the IGHV locus (supplemental Table 4). In our pooled cohort, we observed a significant association between epigenetic subgroup and IGHV status (P < .001; supplemental Table 4). The n-CLL, i-CLL, and m-CLL signatures were found in 80% (n = 245/305), 17% (53/305), and 2% (7/305), respectively, of IGHV-unmutated (IGHV-U) CLL cases and in 9%, (19/216), 50% (108/216), and 41%, (89/216), respectively, of IGHV mutated (IGHV-M) cases (supplemental Table 4; supplemental Figure 3A). In CLL4, analysis of IGHV sequences available from 288 cases showed a significant association between epigenetic subgroup and mutational load (supplemental Figure 3B) and IGHV family usage (supplemental Table 4 and Figure 3C). The median IGHV mutational load differed between epigenetic subgroups (P < .001), with n-CLL, i-CLL, and m-CLL cases exhibiting 100%, 96.65% (95% confidence interval [CI], 96.27%-97.5%), and 92.90% (95% CI, 91.61%-94.37%) median homology to germline, respectively (supplemental Figure 3B). We then focused our analysis on IGHV mutational load in IGHV-M and IGHV-U cases exhibiting a n-CLL or m-CLL epigenetic subgroup, respectively, and showed in both situations that these cases exhibited IGHV mutational loads close to the 98% cutoff, with IGHV-M/n-CLL and IGHV-U/m-CLL cases showing a mean IGHV germline homology of 96.35% and 98.6%, respectively. Seventy-four percent (14/19) of stereotyped subset #2 cases were i-CLL (P < .001), with remaining cases classified as n-CLL (supplemental Table 4). n-CLL accounted for 94% (47/50) of IGHV1-69 cases (P < .001), and i-CLL accounted for 60% (12/20, P = .016), 74% (17/23, P < .001), and 42% (8/19, P = .011) of IGHV3-21, IGHV3-23, and IGHV4-34 cases, respectively (supplemental Table 4; supplemental Figure 3C). In ARC/ADM, analysis of IGLV sequences from 192 patients21 showed a significant association between epigenetic subgroup and expression of the IGLV3-21 gene (P < .001), with expression in 16% (14/87), 58% (29/50), and 17% (8/47) of n-CLL, i-CLL, and m-CLL cases, respectively (supplemental Figure 3D). Elevated ZAP70 expression in patients with CLL4 was significantly associated with epigenetic subgroup (P < .001), with the majority of ZAP70-positive cases displaying n-CLL epigenetic signature (supplemental Table 4; supplemental Figure 4A), which was an expected observation, given its strong association with IGHV status.22
Genomic abnormalities
Next, we assessed the relationship between epigenetic classification and the presence and absence of CLL-specific genomic lesions (supplemental Table 4; supplemental Figure 4A). Sixty-eight percent (80/117; P < .001) of cases with deletion of 11q, 77% (41/53, P < .001) with trisomy 12, and 72% (33/46; P = .015) with mutations in the TP53 gene were n-CLL (supplemental Table 4). Deletion of 17p was not associated with the epigenetic classification. Cases with mutations in NOTCH1 (including the 3′ UTR; P = .011) and SF3B1 (P = .024) were also associated with epigenetic classification and enriched in the n-CLL and i-CLL subgroups, respectively.
Telomere length
In 245 CLL4 cases with data available,23 the median telomere length (TL) differed between epigenetic subgroups (P < .001), with n-CLL, i-CLL, and m-CLL cases exhibiting 2.83 kb (95% CI, 2.55-3.11 kb), 3.07 kb (95% CI, 2.66-3.98 kb), and 5.04 kb (95% CI, 3.72-6.74 kb) median TL, respectively (supplemental Figure 4B). Categorizing TL using our published cutoffs, the n-CLL epigenetic subgroup displayed 6% (8/135), 35% (47/135), and 59% (80/135) cases with long, intermediate, and short telomeres, respectively (P < .001). In the m-CLL group, long, intermediate, and short TL was present in 85% (23/27), 0% (0/27), and 15% (4/27), respectively (P < .001; supplemental Figure 4C).
i-CLL
Given the significant associations observed between i-CLL and a number of genomic and immunogenetic features, we studied 139 CLL4 cases with complete data available for IGHV mutational load, TL, IGHV3-21, subset #2, and SF3B1 mutations (supplemental Figure 4D). This analysis demonstrated that i-CLL shows evidence of further subdivision into cases with and without intermediate IGHV mutational load and a high prevalence of the concomitant immunogenomic features, IGHV3-21, subset #2, and SF3B1 mutations; the latter 3 have been previously shown to coexist .24
Prognostic effect of epigenetic signatures in patients treated with chemotherapy
Univariate Cox regression analysis
Because of the cohort size and the availability of long-term follow-up data, we initially investigated the clinical importance of epigenetic subgroup in the CLL4 cohort (n = 359). We did not find any statistically significant association between epigenetic subgroups and overall response status in CLL4, neither overall (supplemental Table 5) nor in individual trial treatment arms (supplemental Table 6). Of the 183 cases with data available on the cause of death, only 4 were a result of Richter transformation, and all 4 cases were in the n-CLL subgroup.
Clinicobiological features significantly associated with PFS and OS in univariate Cox proportional hazards analyses are shown in supplemental Tables 7 and 8. Patients with n-CLL, i-CLL, and m-CLL exhibited median PFS times of 23 (95% CI, 17.9-26.2), 35 (95% CI, 23.3-40.4), and 33.3 (95% CI, 23.8-48.1) months, respectively. Univariate Cox regression modeling showed that when compared with the n-CLL subgroup, the risk for progression for the patients in the m-CLL and i-CLL subgroups was reduced by 46% (hazard ratio [HR], 0.54; 95% CI, 0.38-0.78; P = .001) and 34% (HR, 0.66; 95% CI, 0.52-0.84; P = .001), respectively (supplemental Table 7; Figure 1A). For OS, the n-CLL, i-CLL, and m-CLL patients exhibited median survival times of 62.8 (95% CI, 52.2-71.8), 66.5 (95% CI, 54.4-90.7), and 105.9 (95% CI, 100.9-111.8) months, respectively (supplemental Table 8; Figure 1B). Both patients with m-CLL and patients with i-CLL experienced a reduction in the risk for death by 67% (HR, 0.33; 95% CI, 0.21-0.52; P < .001) and 27% (HR, 0.73; 95% CI, 0.56-0.94; P = .017), respectively, compared with patients in the n-CLL subgroup. We also observed a statistically significant difference in risk for death between i-CLL and m-CLL (HR for m-CLL, 0.46; 95% CI, 0.28-0.73; P = .001; supplemental Table 8). In further support of the significant association between the m-CLL subgroup and prolonged OS, 46% (22/48) of patients with m-CLL survived for more than 10 years compared with 27% (34/124) and 14% (26/185) of i-CLL and n-CLL cases, respectively (P = .001; supplemental Table 9). In a limited cohort of IGHV-M cases, significantly more patients with m-CLL survived more than 10 years (50%, 18/36) than those defined as i-CLL or n-CLL (31%, [25/81]; P = .039; supplemental Table 9).
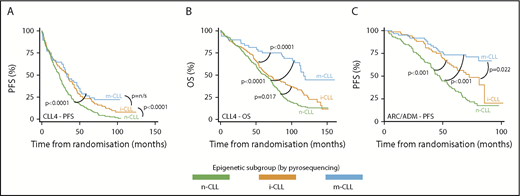
The prognostic importance of epigenetic subgroups in patients from the UK CLL4, ARC, and ADM clinical trials. n-CLL, i-CLL, and m-CLL, classified by pyrosequencing, are depicted in green, orange, and blue, respectively. Kaplan-Meier survival curves for the 3 epigenetic subgroups for PFS (A) and OS (B) in CLL4 and for PFS in ARC/ADM cases (C). (A) The median PFS was 23, 35, and 33 months for the n-CLL (n = 186), i-CLL (n = 125), and m-CLL (n = 48) subtypes, respectively. (B) Median OS was 62.8, 66.5, and 105.9 months for n-CLL (n = 186), i-CLL (n = 125), and m-CLL (n = 48), respectively. (C) Median PFS for n-CLL (n = 112), i-CLL (n = 70), and m-CLL (n = 64) was 30.4 months, 85.4 months, and not reached, respectively. The P values are derived from Kaplan-Meier analysis with log-rank test.
The prognostic importance of epigenetic subgroups in patients from the UK CLL4, ARC, and ADM clinical trials. n-CLL, i-CLL, and m-CLL, classified by pyrosequencing, are depicted in green, orange, and blue, respectively. Kaplan-Meier survival curves for the 3 epigenetic subgroups for PFS (A) and OS (B) in CLL4 and for PFS in ARC/ADM cases (C). (A) The median PFS was 23, 35, and 33 months for the n-CLL (n = 186), i-CLL (n = 125), and m-CLL (n = 48) subtypes, respectively. (B) Median OS was 62.8, 66.5, and 105.9 months for n-CLL (n = 186), i-CLL (n = 125), and m-CLL (n = 48), respectively. (C) Median PFS for n-CLL (n = 112), i-CLL (n = 70), and m-CLL (n = 64) was 30.4 months, 85.4 months, and not reached, respectively. The P values are derived from Kaplan-Meier analysis with log-rank test.
Next, we evaluated survival in the IGHV-U or IGHV-M subgroups of CLL4. We did not observe a significant association between epigenetic subgroup and PFS in either of the IGHV subgroups (supplemental Figure 5A; supplemental Table 10). However, among IGHV-M patients, the m-CLL subgroup remained significantly associated with favorable OS when compared with both patients with i-CLL (HR, 0.52; 95% CI, 0.29-0.92; P = .017) and patients with n-CLL (HR, 0.35; 95% CI, 0.16-0.78; P = .01; supplemental Figure 5B; supplemental Table 10). The IGHV-U subgroup lacked sufficient cases in the m-CLL subgroup, thus precluding a meaningful analysis in these patients (supplemental Table 10).
Multivariate Cox regression analysis
We then estimated the adjusted prognostic effect of epigenetic classification on OS and PFS after controlling for potential confounders employing multivariate Cox proportional hazards analysis with stepwise backward selection. Our initial analysis (Analysis I) focused on biomarkers that were available for the majority of patients across CLL4 and ARC/ADM cohorts. The final model for PFS (with only significant variables) Analysis I in the CLL4 cohort did not identify epigenetic subgroup as an independent prognostic marker (supplemental Table 11). When the same clinicobiological variables were entered into a model for OS, the m-CLL epigenetic signature (HR, 0.46; 95% CI, 0.24-0.83; P = .021) was identified as a favorable prognostic biomarker. Age (HR, 1.06; 95% CI, 1.04-1.08; P < .001) and stage of the disease (A versus B+C; HR, 1.44; 95% CI, 1.04-2.00; P = .026) were unfavorable prognostic factors (Table 2). Next, we developed a model that included additional molecular biomarkers (Analysis II); specifically, the presence of key gene mutations (Table 2). This model was based on a smaller sample size (PFS: 191 patients/177 events; OS: 278 patients/217 events) because of data availability. Inclusion of additional biomarkers did not diminish the prognostic significance of the m-CLL epigenetic subgroup in OS for patients in CLL4 (HR, 0.46; 95% CI, 0.24-0.87; P = .018; Table 2).
Multivariate Cox proportional hazard analyses of OS in the CLL4 trial
| Significant variables | HR (95% CI) | P |
|---|---|---|
| Analysis I | ||
| Epigenetic subgroup | ||
| n-CLL | — | — |
| i-CLL | 0.77 (0.52-1.13) | ns |
| m-CLL | 0.46 (0.24-0.83) | .021 |
| IGHV status (IGHV-M vs -U) | 0.62 (0.40-0.90) | .014 |
| del(17p) (present vs absent) | 5.19 (3.19-8.45) | <.001 |
| Age | 1.06 (1.04-1.08) | <.001 |
| Stage (A vs B+C) | 1.44 (1.04-2.00) | .026 |
| Analysis II | ||
| Epigenetic subgroup | ||
| n-CLL | — | |
| i-CLL | 0.82 (0.56-1.20) | ns |
| m-CLL | 0.46 (0.24-0.87) | .018 |
| IGHV status (IGHV-M vs -U) | 0.60 (0.40-0.90) | .014 |
| del(17p) (present vs absent) | 5.01 (3.08-8.14) | <.001 |
| Age | 1.06 (1.04-1.07) | <.001 |
Two multivariable models were built (Analysis I and II) for the OS of UK CLL4 patients using a step-wise backward elimination process. The 2 models shown here include all significant predictors remaining at the end of the backward elimination analyses. Analysis I: Variables included at the start of the backward elimination process were epigenetic subgroups, age at randomization, sex, treatment, stage, IGHV mutational status, del(11q), and del(17p). The final model was based on 278 patients and 217 deaths. Analysis II: The variables included in the model initially were epigenetic subgroups, age at randomization, sex, treatment, stage, IGHV mutational status, del(11q), del(17p), TP53 mutation, combined NOTCH1 coding, and 3′UTR mutations and SF3B1 mutations. The final model was based on 278 patients and 217 events.
ns, nonsignificant.
Prognostic effect of epigenetic signature in CIT trials
Univariate Cox regression analysis
Next, we evaluated the clinical significance of epigenetic subgroups in patients treated with CIT in the ARC/ADM cohort. Although treatment response was not associated with epigenetic classification (supplemental Table 12), we demonstrated a significant association between epigenetic subgroup and minimal residual disease status (P = .033; supplemental Table 13), where 61% (38/62) of patients with m-CLL achieved a minimal residual disease-negative response.
Patients with n-CLL and i-CLL epitypes exhibited median PFS times of 47.3 (95% CI, 42.0-52.6) and 72.5 (95% CI, 56.7-88.3) months, respectively, and 71% of patients with an m-CLL epitype had not progressed at their last follow-up (therefore, median PFS was not reached; Figure 1C). We demonstrated that the i-CLL subgroup exhibited a 51% reduction in the risk for progression (HR, 0.49; 95% CI, 0.33-0.73; P < .001) compared with n-CLL (supplemental Table 14). Patients in the m-CLL subgroup exhibited a 75% (HR, 0.25; 95% CI, 0.15-0.42; P < .001) and 49% (HR, 0.51; 95% CI, 0.29-0.91; P = .02) reduction in their risk for progression compared with the n-CLL and i-CLL groups, respectively (supplemental Table 14; Figure 1C). For the IGHV-M patients alone, we observed a trend toward longer PFS for patients with m-CLL (HR, 0.32; 95% CI, 0.1-1.10; P = .07) when compared with patients with n-CLL (supplemental Figure 6; supplemental Table 15). In a further refined analysis, focusing on 87 IGHV-M patients with wild-type TP53, n-CLL and i-CLL epitypes exhibited median PFS times of 30.4 (95% CI, 12.1-48.7) and 85.4 (95% CI, 48.0-122.75) months, respectively. Median PFS was not reached for patients with the m-CLL epitype because of insufficient progressions in this group. Importantly, the n-CLL patients exhibited a significant increased risk for PFS (HR, 4.09; 95% CI, 1.14-14.66; P = .031) compared with m-CLL (supplemental Figure S7).
Multivariate Cox regression analysis
Next, we analyzed 2 multivariate models for our ARC/ADM patients, in line with our previous analysis of CLL4 cases. In Analysis I (236 patients with 132 progressions; Table 3), we demonstrated that the i-CLL (HR, 0.59; 95% CI, 0.39-0.90; P = .014) and m-CLL epigenetic subgroup (HR, 0.23; 95% CI, 0.14-0.40; P < .001), del(11q) (HR, 1.70; 95% CI, 1.15-2.52; P = .008) and del(17p) (HR, 6.03; 95% CI, 3.31-10.97; P < .001), retained independent prognostic significance. In Analysis II (Table 3), accounting for additional gene mutations (TP53, SF3B1, and NOTCH1) in a cohort of 125 patients (80 progressions), we demonstrated that the m-CLL epigenetic subgroup (HR, 0.25; 95% CI, 0.10-0.57; P = .002), del(11q) (HR, 2.36; 95% CI, 1.36-4.11; P = .002) and del(17p) (HR, 3.87; 95% CI, 1.66-9.01; P = .002) and TP53 mutation (HR, 3.28; 95% CI, 1.54-7.00; P = .002), retained independent prognostic significance.
Multivariate Cox proportional hazard analysis of PFS in the ARCTIC-ADMIRE trials
| Significant variables | HR (95%CI) | P |
|---|---|---|
| Analysis I | ||
| Epigenetic subgroups | ||
| n-CLL | — | — |
| i-CLL | 0.59 (0.39-0.90) | .014 |
| m-CLL | 0.23 (0.14-0.40) | <.001 |
| del(11q) (present vs absent) | 1.70 (1.15-2.52) | .008 |
| del(17p) (present vs absent) | 6.03 (3.31-10.97) | <.001 |
| Analysis II | ||
| Epigenetic subgroups | ||
| n-CLL | — | — |
| i-CLL | 0.89 (0.50-1.59) | ns |
| m-CLL | 0.25 (0.10-0.57) | .002 |
| del(11q) (present vs absent) | 2.36 (1.36-4.11) | .002 |
| del(17p) (present vs absent) | 3.87 (1.66, 9.01) | .002 |
| TP53 mutation (present vs absent) | 3.28 (1.54-7.00) | .002 |
Two multivariable models were built (Analysis I and II) for the progression-free survival (PFS) of patients from ARCTIC/ADMIRE, using a step-wise backward elimination process. The 2 models shown here include all significant predictors remaining at the end of the backward elimination analyses. Analysis I: Variables included at the start of the backward elimination process were epigenetic subgroups, age, sex, treatment, stage, IGHV mutational status, del(11q), and del(17p). The final model was based on 236 patients and 132 progressions. Analysis II: The variables included in the model initially were epigenetic subgroups, age, sex, treatment, stage, IGHV mutational status, del(11q), del(17p), TP53 mutation, combined NOTCH1 coding and 3′UTR mutations and SF3B1 mutations. The final model was based on 125 patients and 80 events. Estimates (95% CI) and P values for IGHV-mutation status (IGHV-M v -U) were HR, 0.58 (95% CI, 0.31-1.07; P = .082; Analysis I) and HR, 0.56 (95% CI, 0.23-1.34; P = .195; Analysis II).
Discussion
Patients with CLL can be classified into 3 epigenetic subgroups (naive, intermediate, and memory) according to global DNA methylation patterns that partially reflect the changes in methylation that occur during the maturation of normal naive to memory B cells; namely, prominent hypomethylation, especially of enhancer and promotor regions, and gene bodies, together with hypermethylation in regions of transcriptional elongation.10,11 Using a pyrosequencing assay targeting 5 CpGs, which accurately identifies these subgroups, Queirós and coworkers12 and a subsequent Swedish analysis of predominantly Binet stage A patients25 confirmed the previous epigenomic analysis showing a strong correlation between n-CLL and m-CLL with IGHV-U and IGHV-M, respectively. Combining data from both studies, the intermediate subgroup (i-CLL) comprised 15% of cases, of which approximately 80% were IGHV-M CLL with a median identity to germline of 96%. Importantly, both studies established the clinical significance of this assay, showing that epigenetic subgroups were an independent marker of time to first treatment and OS in retrospective, early-stage cohorts.12,25
Novel targeted therapies are revolutionizing the management of CLL. However, long-term follow-up of patients treated with first-line FCR show that the subset of cases with IGHV-M CLL lacking TP53 abnormalities may achieve long-term disease-free survival.2-5 However, these studies also suggest that 20% to 30% of IGHV-M cases have a suboptimal outcome after FCR that is not obviously attributable to poor-risk genomic abnormalities. The ability of an epigenetic assay to subdivide cases of IGHV-M CLL with differing clinical outcomes therefore has potential relevance for the selection of previously untreated patients who might achieve long-term survival after CIT. To address this, we undertook an epigenetic analysis of 3 UK-based clinical trials, assessing the utility of DNA methylation in therapy-naive patients with CLL at first-line treatment with chemotherapy or CIT.
We assessed the methylation status of the 5 CpGs in 605 patients enrolled onto the CLL4, ARC, and ADM trials, and found n-CLL, i-CLL, and m-CLL in 49.5%, 32.0%, and 18.5% of patients, respectively. As in previous studies,12,25 the i-CLL signature was more prevalent in IGHV-M than in IGHV-U CLL, comprising 50% of the former and only 17% of the latter. The higher incidence of i-CLL in the current study likely reflects the more advanced clinical stage of the trial cohorts; for example, in our study, Binet stage A patients comprised 22% of cases compared with 83% in published studies, many of whom had long-term stable disease.
In multivariate analyses that included a comprehensive panel of clinical features and biomarkers, m-CLL was an independent marker of prolonged PFS in the ARC/ADM cohort, and of OS in CLL4. Furthermore, in IGHV-M patients of CLL4, the m-CLL subgroup remained significantly associated with favorable OS when compared with both i-CLL and n-CLL. Much larger studies would be required to ascertain the prognostic significance of the small subset of cases with m-CLL and unmutated IGHV genes and to confirm that cases of IGHV-M CLL with n-CLL respond poorly to CIT. However, these cases whose epigenetic subtype and IGHV mutational status appears discordant have IGHV homology close to the arbitrary 98% cutoff, and may not represent biologically distinct subsets.
The explanation for the prognostic significance of the i-CLL subgroup, especially those cases within the IGHV-M subgroup, with which they share a comparable chromatin landscape, remains unclear.26 We confirm the association of i-CLL with subset #2 (24% of i-CLL) and SF3B1 mutations (26%), and also show enrichment of cases expressing the IGLV3-21 gene (62%), with 64% (32/50) of i-CLL cases with data available, harboring 1 of these features. The associations among i-CLL, low IGHV mutational load, and intermediate TL are also likely to be clinically relevant, although the later requires further validation in additional cohorts. IGHV mutational load, assessed as a continuous variable, was recently shown to associate with outcome in patients treated with FCR,27 and we previously noted TL to have clinical utility in the CLL4 trial.23
The strengths of our study are the large prospective nature of the cohorts, the uniformity of treatment, the assessment of multiple clinical endpoints (PFS and OS), the long follow-up in the CLL4 cases, and the expansive clinicobiological information available for comparison, including the presence of key recurrent gene mutations. The main limitations are the restricted OS data available for the ARC/ADM cohorts and the dated treatment modality employed in the 359 CLL4 patients. However, the observation that TP53, SF3B1, and RPS15 mutations remain poor-risk factors in the German CLL8 trial comparing FCR vs FC,28 and the likelihood of a global need for chemotherapy in CLL for the foreseeable future, indicate that genomic data from the UK CLL4 trial will continue to have clinical relevance. The pyrosequencing assay employed here is simple to implement and interpret, and readily classified patients into the 3 epigenetic subgroups. However, genome-wide approaches have shown that the degree of B-cell maturity-based DNA methylation changes within each epigenetic subtype is associated with clinical outcome,10 variation that cannot be detected by this current pyrosequencing assay. It is therefore possible that more expansive methylation analysis may provide additional prognostic information.
In conclusion, we present the first study to validate the clinical importance of the cell-of-origin, epigenetic subtype signature in the context of multiple randomized, prospective clinical trials. In doing so, we validate and extend key associations between epigenetics and clinicobiological disease features. Importantly, we identify m-CLL as an independent marker of survival in both our LRF CLL4 and ARC/ADM cohorts. Future studies should focus on the further validation of this methodology in the context of other large FCR cohorts, such as the CLL8 study and the ongoing UK MRC FLAIR trial, and in trials of anti-CD20 antibodies in combination with less intensive chemotherapy regimens. Furthermore, testing clinical utility of these epigenetic subgroups in the context of targeted agents is critical, particularly for ibrutinib, in which evidence suggests limited prognostic significance of IGHV status 29 . Finally, standardization and harmonization of the approach will be paramount for the implementation of this approach into routine clinical use. Taken together, our data provide evidence that DNA methylation analysis may aid in the identification of patients destined to achieve prolonged survival when treated with FCR-based CIT.
For original data, please contact J.C.S. at jcs@soton.ac.uk.
The full-text version of this article contains a data supplement.
Acknowledgments
The authors gratefully acknowledge all patients who contributed to this study.
This work was funded by Bloodwise (11052, 12036), the Kay Kendall Leukaemia Fund (873), Cancer Research UK (C34999/A18087, ECMC C24563/A15581), and the Bournemouth Leukaemia Fund. The LRF CLL4 trial was funded by a core grant from Leukaemia and Lymphoma Research. M.J.J.R.-Z. was supported by a Leuka Charity John Goldman Fellowship for Future Science (2016/JGF/0003). D.C. and M.E. acknowledge support by the Arbib Charitable Fund. R.R. is supported by the Swedish Cancer Society, the Swedish Research Council, Science for Life Laboratory, Uppsala University, Uppsala University Hospital, and the Lion’s Cancer Research Foundation, Uppsala. A.S. is supported by the United Kingdom’s National Institute for Health Research. L.K. was supported by the Faculty of Natural and Environmental Sciences, University of Southampton. T.K.W. was supported by the Polish National Agency for Academic Exchange and Aarhus Institute of Advanced Studies.
The views expressed in this paper are those of the authors and not necessarily those of the funding agencies.
Authorship
Contribution: T.K.W., H.E.A., A.B., J.F., S.J.B., H.P., M.L., R.C., P.R., Z.A.D., B.S., C.P., and M.J.J.R.-Z. performed the experimental work; A.R.P. performed the molecular diagnostic assays; T.K.W., H.E.A., L.K., D.B., A.C., and M.J.J.R.-Z. conducted the statistical and bioinformatics analyses; M.E., D.R.H., A.R.P., P.H., A.S., D.C., and D.G.O. contributed patient samples and data; J.C.S. initiated and designed the study; T.K.W., H.E.A., L.K., D.G.O., and J.C.S. wrote the paper with contributions from A.J.S., R.R., C.C.O., and M.J.J.R.-Z.; and all authors critically reviewed the final paper.
Conflict-of-interest disclosure: The authors declare no competing financial interests.
Correspondence: Jonathan C. Strefford, Faculty of Medicine, University of Southampton, Cancer Genomics Group, MP824 Somers Building, Southampton General Hospital, Tremona Rd, Southampton SO16 6YD, United Kingdom; e-mail: jcs@soton.ac.uk; and Tomasz K. Wojdacz, Independent Clinical Epigenetics Laboratory, Pomeranian Medical University, Unii Lubelskiej 1, 70-001 Szczecin, Poland; e-mail: tomasz.wojdacz@pum.edu.pl.

