

Key points
Fludarabine exposure is a strong predictor for survival in HCT: both under- and overexposure lead to decreased survival.
Fludarabine exposure variability may be reduced by individualized dosing and/or therapeutic drug monitoring to improve survival after HCT.

Abstract
Fludarabine is the most frequently used agent in conditioning regimens for allogeneic hematopoietic cell transplantation (HCT). Body surface area–based dosing leads to highly variable fludarabine exposure. We studied the relation between fludarabine exposure and clinical outcomes. A retrospective, pharmacokinetic-pharmacodynamic analysis was conducted with data from patients undergoing HCT with fludarabine (160 mg/m2) as part of a myeloablative conditioning (busulfan targeted to an area under the plasma-concentration-time curve [AUC] of 90 mg*h/L) and rabbit antithymocyte globulin (6-10 mg/kg; from day −9/−12) between 2010 and 2016. Fludarabine exposure as AUC was calculated for each patient using a previously published population pharmacokinetic model and related to 2-year event-free survival (EFS) by means of (parametric) time-to-event models. Relapse, nonrelapse mortality (NRM), and graft failure were considered events. One hundred ninety-two patients were included (68 benign and 124 malignant disorders). The optimal fludarabine exposure was determined as an AUC of 20 mg*h/L. In the overexposed group, EFS was lower (hazard ratio [HR], 2.0; 95% confidence interval [CI], 1.1-3.5; P = .02), due to higher NRM (HR, 3.4; 95% CI, 1.6-6.9; P < .001) associated with impaired immune reconstitution (HR, 0.43; 95% CI, 0.26-0.70; P < .001). The risks of NRM and graft failure were increased in the underexposed group (HR, 3.3; 95% CI, 1.2-9.4; P = .02; HR, 4.8; 95% CI, 1.2-19; P = .02, respectively). No relationship with relapse was found. Fludarabine exposure is a strong predictor of survival after HCT, stressing the importance of optimum fludarabine dosing. Individualized dosing, based on weight and “renal function” or “therapeutic drug monitoring,” to achieve optimal fludarabine exposure might improve survival.
Introduction
Fludarabine (Flu) is the most frequently used agent in conditioning regimens for allogeneic hematopoietic cell transplantation (HCT). HCT is a potentially curative, but high-risk treatment of a variety of malignant and benign hematological disorders. Besides disease relapse (20% to 50%), transplant-related mortality (10% to 40%) is of major concern.1 Therefore, optimization of this procedure, which leads to improved safety of the therapy itself without affecting disease control, is urgently needed.
It has previously been shown that optimization of pharmacokinetic exposure of agents used in the conditioning regimen prior to HCT can be used to achieve this.2-5 For busulfan, this has led to the introduction of therapeutic drug monitoring aiming at an optimal target exposure, which has been proven superior over fixed dosing in a randomized clinical trial.6 Also, for rabbit antithymocyte globulin (rATG), widely used as serotherapy in HCT, an optimal exposure and resulting optimized dosing regimen have been developed by us.2,3,7-9 Flu is currently dosed based on body surface area (BSA) and administered IV as a monophosphate prodrug (F-ara-AMP). It is very rapidly fully converted to the circulating metabolite F-ara-A, which is mainly cleared by the kidney. Recently, we found more than a sixfold variability in F-ara-A plasma exposure, with current BSA-based dosing.10 We hypothesize that such variability in chemotherapy exposure will also lead to a variable and unpredictable treatment outcome, as previously shown for other agents used in conditioning (eg, busulfan and rATG). Therefore, we conducted a retrospective cohort analysis, where different Flu exposure measures were related to various clinical outcomes of HCT, such as graft failure, nonrelapse mortality (NRM), relapse, CD4+ T-cell reconstitution (IR), and survival.
Methods
Study design and patients
A retrospective, pharmacokinetic pharmacodynamic analysis was performed with data from patients who received myeloablative conditioning before HCT, between May 2010 and January 2017 at the University Medical Centre (UMC) Utrecht, The Netherlands. The conditioning regimen consisted of Flu-phosphate, busulfan (Busilvex, Pierre Fabre), ±rATG (Thymoglobulin; Sanofi Genzyme). No restrictions were applied for comorbidities, age, and indication for HCT. Combined haploidentical + cord grafts11 were excluded, and all other cell sources were accepted. Clinical data were collected prospectively, and patients were included after written informed consent was acquired. Ethical approval by the institutional medical ethics committee of the UMC Utrecht was obtained under protocol number 11/063.
Procedures
Patients received a conditioning regimen containing Flu-phosphate at a cumulative dose of 160 mg/m2 (4 days of 40 mg/m2 per day) and IV busulfan, targeted to a myeloablative cumulative exposure of 90 mg*h/L or 30 mg*h/L for Fanconi anemia patients (expressed as area under the plasma-concentration-time curve [AUC] from the first dose until infinity [AUCt0−∞]). Flu-phosphate was given daily from day −5 to −2 relative to transplantation as a 1-hour infusion before the daily busulfan infusion. rATG was added in the unrelated donor HCT setting: 4 consecutive days from day −9 (10 mg/kg < 30 kg, 7.5 mg/kg > 30 kg) for children and day −12 (6 mg/kg) for adults.
For patients receiving rATG, clemastine, paracetamol, and 2 mg/kg prednisolone (with a maximum of 100 mg) were given IV prior to rATG infusion. Graft-versus-host disease (GVHD) prophylaxis in adults consisted of mycophenolate mofetil monotherapy, or cyclosporine A (CsA) with mycophenolate mofetil, in patients with or without α−β T-cell–depleted peripheral blood grafts, respectively.
In pediatric patients, CsA and methotrexate 10 mg/m2 at day +1, +3, and +6 were given in bone marrow recipients and CsA + prednisone 1 mg/kg per day in cord blood recipients until day +28, which was tapered in 2 weeks.
Target trough levels for CsA were 200 to 350 mg/L. Patients were prophylactically treated with acyclovir. All patients received partial gut decontamination with ciprofloxacin and fluconazole and Pneumocystis jiroveci pneumonia prophylaxis using co-trimoxazol. All cord blood transplantation patients received 10 mg/kg granulocyte colony-stimulating factor (Neupogen) from day +7 after HCT until neutrophils were >2000 cells per microliter. Thorough immune monitoring was performed. After reaching a white blood cell count of ≥0.4 × 10⁹/L, an extended T, B, and NK lymphocyte subset analysis was performed. This was done at least every other week (2-4 times a month) up to 12 weeks post-HCT and monthly thereafter up to 6 months.
Outcomes
The main outcome of interest was 2-year event-free survival (EFS). Events considered were graft failure, relapse, and NRM. Relapse was defined as disease recurrence and NRM as death while in complete remission. Both graft rejection and nonengraftment were considered graft failure, where, in the case of nonengraftment, the time was set at day +50 or time of follow-up/death, whichever occurred first.
Other outcomes of interest were overall survival (OS), IR, and overall mortality subdivided by cause of death. IR was defined as the first of 2 consecutive measurements above a value of >50 per microliter CD4+ T cells within 100 days after HCT as described previously.3,12 Causes of death were defined to be infection (either viral or bacterial), GVHD, multiorgan failure, disease recurrence, and other disease-unrelated causes.
Flu pharmacokinetics and optimum
A previously developed Flu pharmacokinetic model10 was used to estimate measures of Flu exposure: the AUCt0−∞ and the AUC from time of transplantation until infinity (AUCtx−∞). These exposure measures were respectively chosen for having a previously found relationship with overall toxicity5,13 /efficacy14 and for having a hypothesized capability of in vivo depletion of T cells as previously shown for rATG.3,15-17 For the most predictive exposure measure, the value corresponding to the highest EFS probability was selected as the pharmacokinetic target.
Statistical analysis
Duration of follow-up was defined as the time from HCT to last contact or death. Patients were censored at the date of last contact. Median time to follow-up was calculated using the reverse Kaplan-Meier method.18
Factors, other than Flu exposure, considered to influence outcome included patient variables (age at transplantation, previous allogeneic HCT, cytomegalovirus serostatus), conditioning variables (cumulative busulfan exposure, rATG exposure after transplantation), donor variables (graft source: cord blood, bone marrow, peripheral blood; human leukocyte-antigen disparity; donor cytomegalovirus serostatus), and disease variables (plasma cell disorders, acute leukemia, lymphoma, benign hematological disorders).
To find the most predictive Flu exposure measure, AUCt0−∞ and AUCtx−∞ were quantitatively linked to the primary outcome measure (EFS) using a parametric time-to-event model. For this, an optimal hazard function was selected and the pharmacokinetic exposure measure with the strongest predictive power was identified based on the Akaike information criterion.19 Using the same procedure, the optimal Flu exposure measure was compared with estimated glomerular filtration rate (eGFR; as calculated previously),10 as these variables were highly correlated and could not be independently introduced in the model.
Models for separate events were constructed similarly to the EFS model. The previously found most predictive exposure measure was included, and models were expanded with other relevant covariates. Flu exposure was only kept in models, if this was proven to be a significant predictor (P < .05) by backward deletion.
To find the 2-year probability of any event (1-EFS) according to Flu exposure, the cumulative hazard for each event (2-years post-HCT) was estimated, and the sum of these cumulative hazards was exponentiated to compute EFS probability. A target exposure window was created by taking the exposure congruent with minimal 1-EFS probability and expanding it to ±25%, thus defining an optimal, below-optimal, and above-optimal exposure group. Baseline characteristics of patients in these exposure groups were compared using the Kruskall-Wallis test for categorical covariates and 1-way analysis of variance for continuous variables. Unadjusted probability of OS and EFS was computed with use of the Kaplan-Meier method, and P values were calculated using a 2-sided log-rank test. Unadjusted probability of relapse, NRM, graft failure, IR, and mortality subdivided by cause were calculated using cumulative-incidence estimates, and P values were calculated using Gray test.
Adjusted estimates for EFS and OS were computed using Cox regression models. The adjusted incidence of relapse, NRM, graft failure, and IR was calculated using Fine-Gray models. Although hazard ratio (HR) is not the proper term for measure of effect size in Fine-Gray models, the term was kept for readability purposes. Adjusted values correspond to the estimated probability given an equal distribution of model-included covariates in all groups. P values for categorical covariates in the regression models were calculated using Wald test and for continuous covariates using the likelihood-ratio test.
Statistical analyses were performed using R version 3.2.4 with packages, flexsurvreg, cmprsk, survival, and rms.
Results
Patients
A total of 192 patients (119 adults, 73 children) was available for the survival analysis after exclusion of 5 patients for receiving a combined haploidentical + cord graft. Patient characteristics are shown in Table 1.
Patient characteristics
| Variable | Value |
|---|---|
| Age at transplantation, y | 36.2 (14-58, 0.23-74) |
| Sex | |
| Male | 115 (60) |
| Female | 77 (40) |
| Indication | |
| Benign | 68 (35) |
| Leukemia/lymphoma | 71 (37) |
| MDS | 30 (16) |
| Plasma cell disorder | 23 (12) |
| Cell source | |
| PB: Full graft | 24 (12) |
| Cord blood | 65 (34) |
| Bone marrow | 16 (8.3) |
| PB: α-β depleted | 87 (45) |
| Human leukocyte antigen disparity* | |
| Matched | 150 (78) |
| Mismatched | 42 (22) |
| Conditioning | |
| Samples per patient | 10 (8-12, 3-19) |
| Flu AUCt0−∞, mg*h/L | 24 (20-29, 10-66) |
| Busulfan AUCt0−∞, mg*h/L | 96.1 (90-100, 59†-120) |
| Serotherapy | |
| Patients without ATG | 20 (10) |
| Patients with ATG | 172 (90) |
| AUCTx−∞ of patients with ATG | 14.5 (2.5-38, 0-270) |
| Creatinine clearance, mL/min/1.73 m2 | 114 (94-130, 25-140) |
| Median follow-up (95% CI), d | 639 (482-758) |
Categorical variables are displayed as n (%). Continuous variables are displayed as median (interquartile range, range).
ATG, antithymocyte globulin; MDS, myelodysplastic syndrome; PB, peripheral blood.
In peripheral blood HCT, 90 were 10/10, 09/10, 16 were 8/8, 3 were 6/6. In cord blood HCT, 4 were 10/10, 4 were 9/10, 3 were 8/10, 21 were 6/6, 24 were 5/6, 9 were 4/6. In bone marrow HCT, all were matched 10/10.
Minima exclude Fanconi anemia patients (n = 3): for these patients, indication-specific myeloablation was achieved with AUCt0−∞ of 31, 31, and 25 mg*h/L.
Flu exposure and outcome
For the main outcome of interest (EFS), cumulative exposure to Flu from start of conditioning (AUCt0−∞) was shown to be the best predictor, compared with both AUCtx−∞ and eGFR. On the high end of Flu exposure, the incidence of NRM increased (P < .001; Figure 1A), and at lower exposures, more graft failures were observed (P = .04; Figure 1B). Flu exposure had no significant influence on relapse (P = .57; Figure 1C). This resulted in a minimal event probability at a cumulative Flu exposure of 20 mg*h/L, with an estimated 1-year EFS advantage of 43% and 11% compared with supra- and suboptimal exposures, respectively (Figure 1D). This results in a target window of 15 mg*h/L to 25 mg*h/L. Outcome probabilities were adjusted for disease and other baseline characteristics (Figure 1 footnotes), but the exposure target itself was found the same among different ages and indications, indicated by absence of any statistical interaction between Flu exposure and age or diagnosis in the survival models.
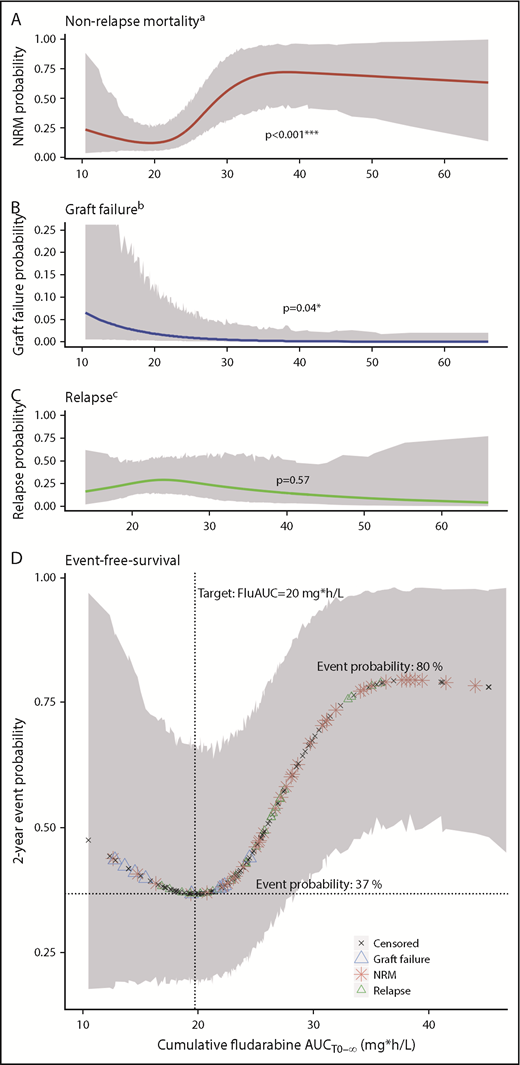
Flu exposure-response relationship. (A-C) Lines depict the estimated event probability (y-axis) at the given Flu AUC (x-axis), for NRM (A), graft failure (B), and relapse (C). (D) Symbols correspond to the estimated event probability (y-axis) of sequential patients at their cumulative Flu AUC (x-axis). Red stars indicate the occurrence of NRM; blue triangles indicate graft failure; green triangles indicate relapses, and the black stars correspond to patients without events. The shaded areas depict the 95% CIs. Displayed event probabilities correspond to a patient at the median age of 35 years, diagnosed with leukemia/lymphoma and no prior HCT. P values (A-C) are calculated by likelihood ratio test using backward deletion from the full regression model. aAdjusted for age (polynomial spline, 3 degrees of freedom) and prior allogeneic transplants (yes/no). bAdjusted for indication (malignant/benign). cAdjusted for age (polynomial spline, 3 degrees of freedom), indication (lymphoma/leukemia, benign, myelodysplastic syndrome, plasma cell disorder), and prior allogeneic transplants (yes/no). *Significant at level P < .05. ***Significant at level P < .001.
Flu exposure-response relationship. (A-C) Lines depict the estimated event probability (y-axis) at the given Flu AUC (x-axis), for NRM (A), graft failure (B), and relapse (C). (D) Symbols correspond to the estimated event probability (y-axis) of sequential patients at their cumulative Flu AUC (x-axis). Red stars indicate the occurrence of NRM; blue triangles indicate graft failure; green triangles indicate relapses, and the black stars correspond to patients without events. The shaded areas depict the 95% CIs. Displayed event probabilities correspond to a patient at the median age of 35 years, diagnosed with leukemia/lymphoma and no prior HCT. P values (A-C) are calculated by likelihood ratio test using backward deletion from the full regression model. aAdjusted for age (polynomial spline, 3 degrees of freedom) and prior allogeneic transplants (yes/no). bAdjusted for indication (malignant/benign). cAdjusted for age (polynomial spline, 3 degrees of freedom), indication (lymphoma/leukemia, benign, myelodysplastic syndrome, plasma cell disorder), and prior allogeneic transplants (yes/no). *Significant at level P < .05. ***Significant at level P < .001.
With the current conditioning of targeted busulfan and 160 mg/m2 Flu phosphate, an overall mortality of 43% was observed (Figure 2A). Death through disease recurrence occurred in 14% of patients, leaving most deaths attributable to the transplantation (28%). For malignancies, disease recurrence was higher at 23%, whereas the main causes of death were still disease unrelated (29%). Figure 2B-D depicts the overall mortality and causes of death, stratified for target attainment. Overall mortality was lowest in the optimally exposed group (31%), compared with the under- (43%) and overexposed group (64%). This increase in overall mortality was mainly attributable to infections (over- and underexposure), multiorgan failure (overexposure), and GVHD (overexposure). Interestingly, overall GVHD (grade 2-4 or 3-4) incidence was similar among different exposure groups: acute GVHD grade 2 to 4 was 21% in optimally exposed patients compared with 18% below optimum, and 27% above optimum (P = .68). The trend was similar for grade 3 to 4 with incidences of 6%, 8%, and 13%, respectively (P = .50). In the underexposed group, no relapse-related death occurred, although only 1 patient was transplanted for a malignancy in this group (Table 2).
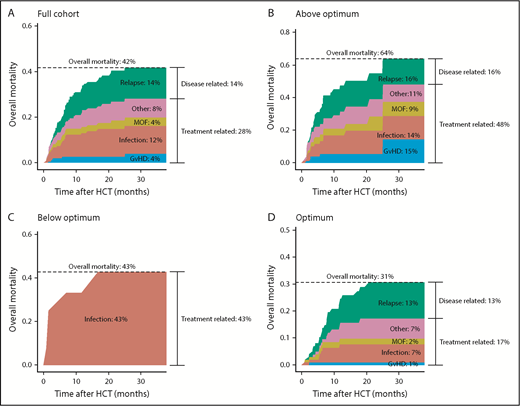
Causes of death according to Flu exposure. Stacked cumulative incidence plots of overall mortality subdivided by cause for the full cohort (A), patients exposed above optimum (B), patients exposed below optimum (C), and patients with an exposure within the optimal range (D). For each cause, the cumulative incidence was computed throughout the follow-up period. At every time point, the incidence of all causes was summed up to get the overall mortality incidence. MOF, multiorgan failure.
Causes of death according to Flu exposure. Stacked cumulative incidence plots of overall mortality subdivided by cause for the full cohort (A), patients exposed above optimum (B), patients exposed below optimum (C), and patients with an exposure within the optimal range (D). For each cause, the cumulative incidence was computed throughout the follow-up period. At every time point, the incidence of all causes was summed up to get the overall mortality incidence. MOF, multiorgan failure.
Patient characteristics stratified on Flu exposure groups
| Variables | Within optimal exposure range (N = 101) | Above optimal exposure range (N = 79) | Below optimal exposure range (N = 12) |
|---|---|---|---|
| Age at transplantation, y*** | 23.5 (7.1-47, 0.23-70) | 56.7 (39-63, 0.29-74) | 13.7 (5.1-16, 1.9-32) |
| Sex | |||
| Male | 58 (57) | 48 (61) | 9 (75) |
| Female | 43 (43) | 31 (39) | 3 (25) |
| Indication*** | |||
| Benign | 44 (44) | 13 (16) | 11 (92) |
| Leukemia/lymphoma | 41 (41) | 30 (38) | |
| MDS | 11 (11) | 18 (23) | 1 (8.3) |
| Plasma cell disorder | 5 (5) | 18 (23) | |
| Cell source** | |||
| PB: Full graft | 10 (9.9) | 14 (18) | |
| Cord blood | 39 (39) | 15 (19) | 11 (92) |
| Bone marrow | 12 (12) | 4 (5.1) | |
| PB: α-β depleted | 40 (40) | 46 (58) | 1 (8.3) |
| Human leukocyte antigen disparity*,*** | |||
| Matched | 79 (78) | 66 (84) | 5 (42) |
| Mismatched | 22 (22) | 13 (16) | 7 (58) |
| Conditioning | |||
| Samples per patient | 10 (8-12, 3-19) | 9 (8-12, 3-15) | 10.5 (8-12, 6-16) |
| Flu AUCt0−∞, mg*h/L*** | 21.3 (19-23, 16-25) | 30.8 (27-36, 26-66) | 13.8 (13-15, 10-15) |
| Busulfan AUCt0−∞, mg*h/L | 95.3 (89-100, 59†-120) | 97.8 (91-100, 65-120) | 95.9 (90-100, 82-120) |
| Serotherapy | |||
| Patients without ATG | 13 (13) | 7 (8.9) | |
| Patients with ATG | 88 (87) | 72 (91) | 12 (100) |
| AUCtx−∞ of patients with ATG | 12 (1.6-35, 0-130) | 18 (4.4-43, 0-270) | 3.82 (2.8-9.1, 1.5-86) |
| Creatinine clearance, mL/min/1.73 m2*** | 121 (110-140, 40-140) | 100 (79-110, 25-140) | 140 (140-140, 110-140) |
| Median follow-up (95% CI), d | 688 (591-913) | 369 (341-493) | 884 (779-NA) |
Categorical variables are displayed as n (%). Continuous variables are displayed as median (interquartile range, range).
NA, not available.
In peripheral blood HCT, 90 were 10/10, 09/10, 16 were 8/8, and 3 were 6/6. In cord blood HCT, 4 were 10/10, 4 were 9/10, 3 were 8/10, 21 were 6/6, 24 were 5/6, and 9 were 4/6. In bone marrow HCT, all were matched 10/10.
Minima exclude Fanconi anemia patients (n = 3): for these patients, indication-specific myeloablation was achieved with AUCt0 −∞ of 31, 31, and 25 mg*h/L.
Values between groups are significantly different at level P < .01.
Values between groups are significantly different at level P < .001.
In the adjusted regression models, it was found that the optimal exposure group had a significantly higher EFS compared with the above-optimal-exposure group (HR, 2.0; 95% confidence interval [CI], 1.1-3.5; P = .01; Figure 3A) and (nonsignificantly) higher than the below-optimal group (HR, 1.8; 95% CI, 0.72-4.5; P = .21). The lower EFS in the above-optimal-exposure group was primarily caused by a higher incidence of NRM (HR, 3.4; 95% CI, 1.6-6.9; P < .001; Figure 3C), and there was no difference in relapse (HR, 0.85; 95% CI, 0.35-2.0; P = .71; Figure 3E). In addition, the risk for graft failure and NRM was increased in the below-optimal-exposure group (HR, 4.8; 95% CI, 1.2-19; P = .02; Figure 3D; and HR, 3.3; 95% CI, 1.2-9.4; P = .02; Figure 3C, respectively). No graft failures were observed in the above-optimal-exposure group. IR was significantly lower in patients exposed above optimum (Figure 3F; HR, 0.43; 95% CI, 0.26-0.70; P < .001). Due to the high percentage of graft failures, IR could not adequately be assessed for underexposed patients. In those patients reaching IR (n = 101), early reconstitution (lower quartile) associated with increased EFS (84% vs 60%). Both EFS and IR were found similar in the adjusted regression models for the different cell sources, including α-β−depleted grafts. In addition, subgroup analyses were performed for EFS according to optimal Flu exposure in the upper quartile of age and stratified for indication (malignant/benign). For patients with an age within the upper quartile, we still found superior survival in patients with optimal exposures (n = 11; EFS = 91%) vs those who were overexposed (n = 37; EFS = 39%; P = .04). In malignancies, the optimal exposure also associated with superior EFS compared with overexposure (55% vs 19.5%; P = .0047). Also, for benign disorders, optimal exposure associated with the best outcome (EFS, 73%) compared with below optimal (41%; P = .047) and above optimal exposure (48%; P = .11).
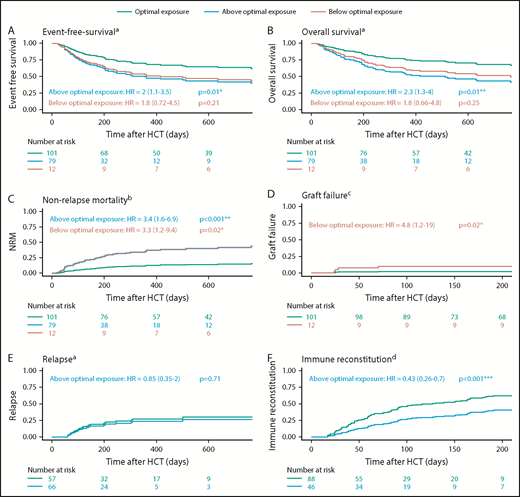
HCT outcome according to Flu exposure. Adjusted Kaplan-Meier plots and cumulative incidence plots of EFS (A), OS (B), NRM (C), graft failure (D), relapse (E), and immune reconstitution (F). Patients are stratified for within optimal exposure (optimum 25%), above optimal exposure, and below optimal exposure. P values are derived from the Wald test in the full regression models. aAdjusted for age (polynomial spline, 3 degrees of freedom), indication (lymphoma/leukemia, benign, myelodysplastic syndrome, plasma cell disorder), and prior allogeneic transplants (yes/no). bAdjusted for age (polynomial spline, 3 degrees of freedom) and prior allogeneic transplants (yes/no). cAdjusted for indication (malignant/benign). dAdjusted for age (polynomial spline, 4 degrees of freedom). *Significant at level P < .05. **Significant at level P < .01. ***Significant at level P < .001.
HCT outcome according to Flu exposure. Adjusted Kaplan-Meier plots and cumulative incidence plots of EFS (A), OS (B), NRM (C), graft failure (D), relapse (E), and immune reconstitution (F). Patients are stratified for within optimal exposure (optimum 25%), above optimal exposure, and below optimal exposure. P values are derived from the Wald test in the full regression models. aAdjusted for age (polynomial spline, 3 degrees of freedom), indication (lymphoma/leukemia, benign, myelodysplastic syndrome, plasma cell disorder), and prior allogeneic transplants (yes/no). bAdjusted for age (polynomial spline, 3 degrees of freedom) and prior allogeneic transplants (yes/no). cAdjusted for indication (malignant/benign). dAdjusted for age (polynomial spline, 4 degrees of freedom). *Significant at level P < .05. **Significant at level P < .01. ***Significant at level P < .001.
Discussion
To our knowledge, this is the first study describing the effect of Flu exposure on outcomes in a large HCT cohort with homogeneous pharmacological treatment. This analysis clearly shows that exposure to Flu in the conditioning prior to allogeneic HCT is a major predictor for EFS. Although differences in baseline characteristics and stem cell products were present, multivariate regression models and subset analyses showed consistency of the Flu exposure-outcome relationship. This suggests that optimizing Flu exposure may have a relevant impact on survival in HCT. Highest EFS was found in patients with a cumulative AUCt0−∞ of 20 mg*h/L (±5) of Flu. This optimal Flu exposure was found to be consistent for all ages and indications. The risk for NRM increased at higher exposures, and risk of graft failure increased at lower exposures. Interestingly, no influence on relapse incidence was noted. A limitation of this study is however that the establishment of the optimal exposure and the following survival analysis were conducted on the same dataset. Although the described cohort was a substantially large cohort (n ∼ 200), the low number of events did not allow for data splitting. The optimal exposure range has to be confirmed in an independent cohort.
Interestingly, we observed that impaired renal function in older patients and concurrent higher Flu exposures better predict worse outcomes than older age itself. Previously, others found direct relationships between older age and NRM.16,20,21 Part of NRM in these older patients might be caused by unfavorable high Flu exposures. This also suggests that the current dosing method (per square meters) is not optimal, as it results in highly variable exposures. As weight and renal function were the only predictors for exposure found in major pharmacokinetic analyses,10,14 dosing based on these variables would likely result in better predictable, optimal exposure and subsequently result in better outcomes, including survival chances.
With respect to the identified optimal exposure range, it should be noted that for the outcome graft failure, the event frequency was low. The lower limit of the defined Flu target should, therefore, be interpreted with caution. Nevertheless, as Flu is considered an effective and important part of the conditioning regimen prior to HCT, it is very likely that a minimal target exposure should be obtained. In addition, the identified lower limit of Flu exposure is in line with results described by Ivaturi et al.14 With regards to the upper limit, overexposure was found to be strongly related to impaired IR and NRM, which is in line with studies described by others.5,13
The strong effect of high Flu exposure before HCT on IR after HCT is however intriguing: “How can exposure before HCT influence IR after HCT?” We postulate 2 hypotheses for this finding. First, due to overexposure of Flu, an unfavorable host environment is created, impacting CD4+ T-cell homeostatic expansion through a negative influence on thymus size. That chemotherapy can do this was described previously,22,23 although the role of the thymus at older age is not completely understood. Alternatively, it could be that cytotoxic F-ara-A still resides in the bone marrow after transplantation, when plasma levels have already declined, given the excellent penetration of Flu in the bone marrow.24,25 Delayed IR has also been associated with increased relapse risk.3 In this study, however, no relationship between high Flu exposure and relapse was found, despite the observed impaired IR. An explanation for this may be that in in vitro studies, synergism between Flu and busulfan was observed,26 resulting in increased apoptosis of residual malignant cells. The higher exposure in the overexposed group may have counterbalanced the negative effect of delayed IR on the relapse probability.
In addition to being the most frequently used agent in the conditioning prior to HCT, Flu is also used in the treatment of chronic lymphocytic leukemia27 as well as in conditioning regimens before “chimeric antigen receptor T-cell” therapy and other cellular T-cell therapies.28-31 In chronic lymphocytic leukemia, profound Flu therapy–related lymphopenia, which might indicate high Flu exposure, has been associated with better survival.32 In conditioning regimens prior to cellular therapy (such as chimeric antigen receptor T cell), Flu has been found necessary for cell persistence,33 while also adverse events related to Flu conditioning have been observed.34 This suggests that a Flu exposure-response relationship in these settings exists as well.
In conclusion, optimal cumulative exposure to Flu during the conditioning phase predicts superior survival following HCT. With renal function and weight being the predictors for Flu exposure, dosing based on these parameters would make more sense, instead of dosing based on BSA. Such an algorithm could be readily derived from the predicted clearance using weight, eGFR, and the previously published model.10 Alternatively, implementing “therapeutic drug monitoring” would give the most precise exposures. As such, individualized dosing could aid in improving predictability of, and survival after, Flu-containing conditioning regimens.
Acknowledgment
This work was supported by Foundation Children Cancerfree (KiKa) project number 190.
Authorship
Contribution: J.B.L., A.D.R.H., C.v.K., and J.J.B. designed the study; J.B.L., J.J.B., S.N., C.v.K., A.D.R.H., J.K., and T.P.C.D. analyzed the data and wrote the manuscript; M.A.d.W., E.M.v.M., A.v.R., R.R., and J.K. included patients and wrote the manuscript; M.B. and C.A.L. included patients and critically appraised the manuscript; all authors reviewed and approved the final version of the manuscript; and J.B.L., A.D.R.H., and J.J.B. had full access to all data in the study and take full responsibility for the integrity of the data and the accuracy of analysis.
Conflict-of-interest disclosure: J.K. receives research funding from, and is CSO and shareholder of, Gadeta (www.gadeta.nl). The remaining authors declare no competing financial interests.
Correspondence: J. J. Boelens, Stem Cell Transplantation and Cellular Therapies Program, Department of Pediatrics, Memorial Sloan Kettering Cancer Center, 1275 York Ave, Scholar 417, New York, NY 10065; e-mail: boelensj@mskcc.org.

