

Key Points
The STAT3β/α mRNA expression ratio in AML patients is a favorable prognostic marker and positively correlates with overall survival.
Transgenic Stat3β expression delays disease progression and prolongs overall survival in AML mouse models.

Abstract
Signal transducer and activator of transcription 3 (STAT3) exists in 2 alternatively spliced isoforms, STAT3α and STAT3β. Although truncated STAT3β was originally postulated to act as a dominant-negative form of STAT3α, it has been shown to have various STAT3α-independent regulatory functions. Recently, STAT3β gained attention as a powerful antitumorigenic molecule in cancer. Deregulated STAT3 signaling is often found in acute myeloid leukemia (AML); however, the role of STAT3β in AML remains elusive. Therefore, we analyzed the STAT3β/α messenger RNA (mRNA) expression ratio in AML patients, where we observed that a higher STAT3β/α mRNA ratio correlated with a favorable prognosis and increased overall survival. To gain better understanding of the function of STAT3β in AML, we engineered a transgenic mouse allowing for balanced Stat3β expression. Transgenic Stat3β expression resulted in decelerated disease progression and extended survival in PTEN- and MLL-AF9–dependent AML mouse models. Our findings further suggest that the antitumorigenic function of STAT3β depends on the tumor-intrinsic regulation of a small set of significantly up- and downregulated genes, identified via RNA sequencing. In conclusion, we demonstrate that STAT3β plays an essential tumor-suppressive role in AML.
Introduction
Signal transducer and activator of transcription 3 (STAT3) is a key transcription factor in cell proliferation, maturation, and survival and hence involved in several oncogenic pathways. Although STAT3 is most commonly described as an oncogene in cancer, evidence also shows its role as a tumor suppressor.1-8 This opposing role of STAT3 in cancer depends considerably on its expression as different isoforms.1,9 Alternative splicing gives rise to full-length STAT3α and truncated STAT3β. STAT3β variants lack the canonical STAT3 C-terminus and instead contain 7 unique amino acids, resulting in enhanced DNA binding affinity.10 Both isoforms are ubiquitously expressed; however, although the loss of STAT3α leads to embryonic lethality in mice, STAT3β is not required for viability.11 Accordingly, STAT3β was originally described as a dominant-negative regulator of STAT3.10,12,13 Despite that, several studies have postulated an active regulatory role for STAT3β and identified a large number of STAT3β-specific target genes.11,13-16 Recently, STAT3β has gained attention as a powerful antitumorigenic molecule, as shown for melanoma, esophageal squamous cell carcinoma, and breast, lung, and colon cancers.17-24
STAT3 has been shown to be constitutively active in AML cell lines and patients, causing a proliferative advantage and apoptosis protection.25-28 In addition, STAT3 activity has been associated with short disease-free survival in a subset of AML patients.29-32 As a consequence, STAT3 became an attractive therapeutic target in AML, but results from early clinical studies with STAT3 inhibitors have shown moderate effectiveness.28,33-35 In contrast to these studies, Redell et al36 described a protective role of increased STAT3 phosphorylation upon cytokine stimulation in AML patients, correlating with high disease-free survival. These conflicting results in AML might indicate that the impact of STAT3 inhibition in different patient subsets can vary as a result of its heterogeneous biological context.37
An improved understanding of the biological functions of STAT3 isoforms in AML is therefore required. Here, we conducted an extensive study regarding the specific role of STAT3β in AML. We found that the balance of STAT3 isoform expression in AML patients can serve as a favorable prognostic tool. Furthermore, we demonstrate that the transgenic expression of STAT3β impairs leukemia progression. Taken together, our data identify STAT3β as a novel tumor suppressor in AML.
Patients and methods
AML patients
This study was approved by the ethics committees of the Medical Universities of Graz and Vienna (Austria) and conducted according to the Declaration of Helsinki. Written informed consent was obtained. Diagnostic peripheral blood (PB) and bone marrow (BM) samples from AML patients were enriched for mononuclear cells using Ficoll (GE Healthcare, Milan, Italy) density-gradient centrifugation before freezing in fetal bovine serum (Gibco; Thermo Fisher Scientific, Waltham, MA) with 10% dimethyl sulfoxide (Sigma Aldrich, St. Louis, MO), as previously described.38 All samples contained >80% blast cells after enrichment. Healthy CD34+ hematopoietic stem and progenitor cells (HSPCs) were collected from umbilical cord blood and enriched by magnetic-activated cell sorting (Miltenyi Biotech, Gladbach, Germany).
Cytogenetic risk stratification of patients into favorable, intermediate, and adverse subgroups was applied according to the Medical Research Council classification scheme.39 In a proportion of patients, information on the mutational status of the FLT3, NPM1, and CEBPA genes was available. Only patients receiving treatment with curative intention (chemotherapy with or without allogeneic hematopoietic stem cell transplantation) were included in the analysis of overall survival as defined by the European LeukemiaNet 2017 guidelines.40 In accordance with literature describing an association of oncogenic FLT3 mutations with JAK/STAT activity, primarily STAT5 and STAT3, we furthermore excluded patients with a confirmed FLT3 mutation in survival analysis.41-46
Generation of Stat3β transgenic mice
A Stat3β expression cassette containing the CAGGS promoter, a loxP-flanked (floxed) transcriptional/translational stop cassette, N-terminus FLAG-tagged Stat3β mouse complementary DNA (cDNA), internal ribosomal entry site (IRES)/yellow fluorescent protein (YFP), and a bovine growth hormone–derived polyadenylation signal flanked by attB sites was assembled by conventional cloning. The Stat3β expression cassette was integrated into a bacterial artificial chromosome (BAC) containing the Rosa26 locus (RP24-85L15) by PhiC31 integrase–mediated cassette exchange.47 Rosa26-modified BAC DNA was purified48 and microinjected into the pronucleus of C57BL/6 oocytes.
Animal studies
Animal experiments were approved by the Animal Ethics Committee of the Medical University of Vienna and the Austrian Federal Ministry of Education, Science and Research. Mice were bred and kept under pathogen-free conditions at the Institute of Pharmacology, Medical University of Vienna (Vienna, Austria). Stat3β transgenic (Stat3βTG) mice were crossbred with Mx1-Cre recombinase transgenic (MxCre) floxed Pten mice.49,50 To induce Cre, animals were intraperitoneally injected with 100 μL of polyinosine-polycytidine (pIpC; 2 mg/mL; Sigma Aldrich) at the age of 5 to 7 weeks on 3 consecutive days.
Transplantation of FLCs
Fetal liver cells (FLCs) were isolated from Stat3βTG and wild-type (wt) mice at embryonic day 13.5, genotyped, and frozen in fetal bovine serum with 10% dimethyl sulfoxide. Platinum E cells were transfected by calcium phosphate coprecipitation with the pMSCV-MLL-AF9-IRES-Venus vector. FLCs were thawed 1 day before infection. Cells were spinoculated (1000g for 90 minutes) with retroviral supernatant in the presence of 10 µg/mL of polybrene (Sigma Aldrich). After 24 hours, 2 × 10⁶ FLCs were injected into immunocompromised NOD.Cg-PrkdcscidIl2rgtm1Wjl/SzJ (The Jackson Laboratory, Bar Harbor, ME) mice via the tail vein. Infection rates for MLL-AF9/Venus+ (Venus+) cells ranged from 7% to 12%. Four weeks after transplantation, mice were injected with pIpC, as described in “Animal studies.”
Statistics
Patient data
STAT3β/α messenger RNA (mRNA) ratio values were compared between groups using the Kruskal-Wallis test followed by pairwise comparisons corrected for multiplicity by Dunn’s method. To test the association between the STAT3β/α mRNA ratio and survival of patients with AML, a multivariable Cox regression model was used. In addition to the logSTAT3β/α ratio as a continuous variable, the model included and thus corrected for established AML risk parameters: patient age at diagnosis, percentage of blasts of all white blood cells (WBCs), and cytogenetic risk group as categorical predictor. To show the effect of logSTAT3β/α ratio on the survival function, it was plotted once for the maximally observed ratio, once for the median, and once for the lowest observed ratio. To visualize the change in hazard ratio (HR) associated with a certain STAT3β/α ratio change, it was calculated relative to the estimated survival at the median STAT3β/α ratio using Exp(B) and its 95% confidence interval.
Animal and cellular data
Data were analyzed using log-rank Student t tests (Mantel Cox), Student t tests, and 1-way analyses of variance in combination with Tukey’s multiple comparison post hoc test. Error bars represent means ± standard deviations. P < .05 was regarded as statistically significant. P values are indicated as follows: *P < .05, **P < .01, and ***P < .001. The absence of a P value or asterisk indicates nonsignificance. Additional methods are provided in the supplemental material.
Results
Higher ratio of STAT3β/α mRNA expression correlates with favorable clinical prognosis and prolonged survival in AML patients
Differential expression of STAT3 isoforms has been observed in AML patients, but whether their role is of oncogenic or tumor-suppressive nature is incompletely understood.29-32 We obtained diagnostic samples from 94 AML patients (supplemental Table 1) and analyzed mRNA expression of STAT3 isoforms in comparison with HSPCs from 8 healthy donors. The mRNA expression of total STAT3, STAT3α, and especially STAT3β differed between leukemic blasts and healthy HSPCs. We found significantly decreased mRNA expression levels of STAT3β in AML samples compared with healthy HSPCs (supplemental Figure 1A). Next, patients of different cytogenetic risk groups were compared regarding STAT3 expression levels (supplemental Figure 1B). Strikingly, we found that the STAT3β/α mRNA expression ratio in AML samples was significantly lower than that in healthy HSPCs and that a high STAT3β/α mRNA ratio correlated with a favorable clinical prognosis (Figure 1A). Furthermore, we explored the correlation between the STAT3β/α mRNA ratio in AML patients (n = 48) and overall survival. A higher STAT3β/α mRNA ratio was associated with longer overall survival in AML patients (Figure 1B) after adjustment for patient age at diagnosis, percentage of blasts, and cytogenetic risk category (Figure 1C). A 10-fold increase of the STAT3β/α mRNA ratio was estimated to be associated with an HR of 0.34 (95% confidence interval, 0.12-0.95; Figure 1D). Taken together, the STAT3β/α mRNA ratio correlates with clinical prognosis and survival in AML patients, arguing for the importance of strict maintenance of balanced STAT3β/α mRNA expression.
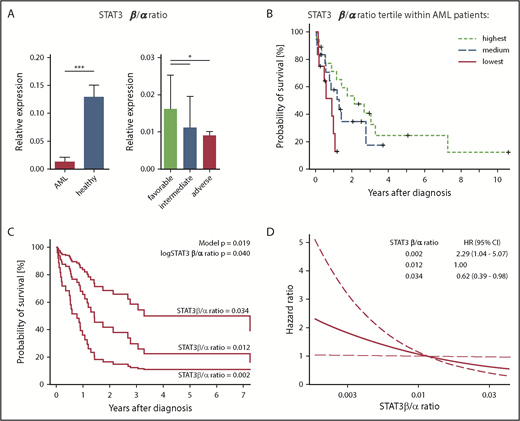
A higher STAT3β/α mRNA ratio correlates with clinical prognosis and survival in AML patients. (A) STAT3β/α mRNA ratio (normalized to β-ACTIN) in AML patients (n = 94) and HSPCs from healthy controls (n = 8), and STAT3β/α mRNA ratio in AML patients with a favorable (n = 23), intermediate (n = 22), or adverse (n = 49) prognosis. Data were compared using the Student t test and Kruskal-Wallis test. (B) Kaplan-Meier plot showing the survival of patients with a STAT3β/α mRNA ratio in the highest, medium, or lowest tertile (n = 48). (C) Estimated survival functions resulting from multivariable Cox regression. In addition to the logSTAT3β/α mRNA ratio in its continuous form, the model includes and thus adjusts for patient age, blast count, and cytogenetic risk category at diagnosis. For illustrative purposes, curves were plotted for the maximal, median, and minimal observed STAT3β/α mRNA ratios. The model P value refers to the hypothesis that all variables in the model collectively predict survival; the logSTAT3β/α mRNA P value tests whether the ratio predicts survival independent of other variables. Of note, the estimated survival changes continuously with the STAT3β/α mRNA ratio. Therefore, the survival can be plotted for any STAT3β/α mRNA ratio value. To visualize the magnitude of survival difference between the maximally observed (0.034) and the minimally observed (0.002), we plotted survival function for these values and for the median value as reference. Modeling the effect of STAT3β/α mRNA ratio in its continuous form allowed avoidance of arbitrary groups. (D) Change of estimated HR (thick line) with 95% confidence interval (CI; dashed lines) associated with different STAT3β/α mRNA ratio levels. The median STAT3β/α mRNA ratio was chosen as reference, not affecting the statistical analysis. The curve was plotted for a range of STAT3β/α mRNA ratios spanning from the minimum to maximum observed ratio. Estimated HRs are given for the upper and lower ends of the curve. *P < .05, ***P < .001.
A higher STAT3β/α mRNA ratio correlates with clinical prognosis and survival in AML patients. (A) STAT3β/α mRNA ratio (normalized to β-ACTIN) in AML patients (n = 94) and HSPCs from healthy controls (n = 8), and STAT3β/α mRNA ratio in AML patients with a favorable (n = 23), intermediate (n = 22), or adverse (n = 49) prognosis. Data were compared using the Student t test and Kruskal-Wallis test. (B) Kaplan-Meier plot showing the survival of patients with a STAT3β/α mRNA ratio in the highest, medium, or lowest tertile (n = 48). (C) Estimated survival functions resulting from multivariable Cox regression. In addition to the logSTAT3β/α mRNA ratio in its continuous form, the model includes and thus adjusts for patient age, blast count, and cytogenetic risk category at diagnosis. For illustrative purposes, curves were plotted for the maximal, median, and minimal observed STAT3β/α mRNA ratios. The model P value refers to the hypothesis that all variables in the model collectively predict survival; the logSTAT3β/α mRNA P value tests whether the ratio predicts survival independent of other variables. Of note, the estimated survival changes continuously with the STAT3β/α mRNA ratio. Therefore, the survival can be plotted for any STAT3β/α mRNA ratio value. To visualize the magnitude of survival difference between the maximally observed (0.034) and the minimally observed (0.002), we plotted survival function for these values and for the median value as reference. Modeling the effect of STAT3β/α mRNA ratio in its continuous form allowed avoidance of arbitrary groups. (D) Change of estimated HR (thick line) with 95% confidence interval (CI; dashed lines) associated with different STAT3β/α mRNA ratio levels. The median STAT3β/α mRNA ratio was chosen as reference, not affecting the statistical analysis. The curve was plotted for a range of STAT3β/α mRNA ratios spanning from the minimum to maximum observed ratio. Estimated HRs are given for the upper and lower ends of the curve. *P < .05, ***P < .001.
Generation and characterization of a novel Stat3β transgenic mouse model
To investigate the role of STAT3β, we established a novel mouse line conditionally expressing murine Stat3β. We chose a BAC containing the Rosa26 locus, because this has been shown to be open chromatin and support transgene expression. The construct for the generation of Stat3βTG mice consisted of a CAGGS promoter followed by a floxed Stop cassette, FLAG-tagged murine Stat3β cDNA, and IRES and YFP (Figure 2A). Purified BAC DNA was microinjected into the pronucleus of C57BL/6 oocytes, and Stat3βTG mice were identified via Southern blot and genotyping (supplemental Figure 2A). Conditional expression of the transgene was achieved by crossing Stat3βTG mice with a pIpC-inducible MxCre mouse line on a C57BL/6 background. The resulting mice, heterozygous for Cre and the Stat3β transgene (Stat3βTG), were injected with pIpC, causing the expression of CRE recombinase and the excision of the Stop cassette and allowing for the expression of exogenous STAT3β. Ectopic expression of STAT3β was confirmed in liver and spleen 20 days postinduction (Figure 2B). YFP was detected in >20% of BMCs as well as in hematopoietic cell subsets (Figure 2C).
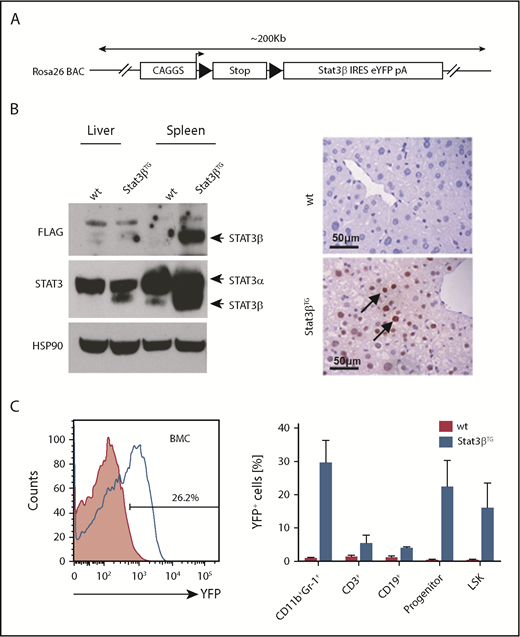
Generation and characterization of a Stat3β transgenic mouse model. (A) A schematic overview of the Stat3β transgene BAC construct. (B) Total cell lysates from spleen and liver were subjected to western blot analysis with the indicated antibodies (STAT3, FLAG, and HSP90). Liver sections stained with an antibody against FLAG show the expression of ectopic STAT3β. (C) A representative flow cytometry analysis of YFP+ BM cells (BMCs) and hematopoietic cell populations (progenitor: Lin−Sca-1+c-Kit−; LSK: Lin−Sca-1+c-Kit+) at day 20 postinduction. Data (wt vs Stat3βTG) were not statistically compared.
Generation and characterization of a Stat3β transgenic mouse model. (A) A schematic overview of the Stat3β transgene BAC construct. (B) Total cell lysates from spleen and liver were subjected to western blot analysis with the indicated antibodies (STAT3, FLAG, and HSP90). Liver sections stained with an antibody against FLAG show the expression of ectopic STAT3β. (C) A representative flow cytometry analysis of YFP+ BM cells (BMCs) and hematopoietic cell populations (progenitor: Lin−Sca-1+c-Kit−; LSK: Lin−Sca-1+c-Kit+) at day 20 postinduction. Data (wt vs Stat3βTG) were not statistically compared.
Stat3βTG mice were found to be phenotypically normal before and after induced Stat3βTG expression (followed up to 12 months of life; data not shown). WBC count and relative spleen weight (normalized to body weight) in Stat3βTG mice were comparable to those of pIpC-treated wt animals (supplemental Figure 2B). Furthermore, hematopoietic cell populations in BM and spleen were unaffected by Stat3βTG expression (supplemental Figure 2C). In accordance, hematoxylin and eosin (H&E) staining of spleen and liver sections did not reveal any overt abnormalities in organ architecture or extramedullary hematopoiesis (supplemental Figure 2D).
Elevated expression of STAT3β prolongs survival in an AML mouse model based on Pten deletion
The impact of STAT3β on AML progression in vivo was investigated via the homozygous knockout of Pten in the hematopoietic compartment. Conditional ablation of Pten rapidly induces myeloproliferative neoplasms, which develop into secondary AML.49,50 Crossbreeding and pIpC treatment gave rise to MxCre:PtenΔ/+, MxCre:PtenΔ/+:Stat3βTG, MxCre:PtenΔ/Δ, and MxCre:PtenΔ/Δ:Stat3βTG mice (MxCre is omitted in the annotation of mice hereafter). All mice with a homozygous ablation of Pten included in this study developed fatal myeloid leukemia within 110 days. Strikingly, we observed a significant increase in disease latency upon Stat3βTG expression in PtenΔ/Δ mice (Figure 3A). We detected elevated numbers of myeloid (CD11b+Gr-1+) cells in the BM and spleen of terminally ill PtenΔ/Δ and PtenΔ/ΔStat3βTG mice compared with PtenΔ/+ control animals, consistent with an AML phenotype (supplemental Figure 3A). Although WBC count was strongly increased upon homozygous deletion of Pten, PtenΔ/ΔStat3βTG mice exhibited a WBC count similar to that of healthy PtenΔ/+ controls (supplemental Figure 3B).
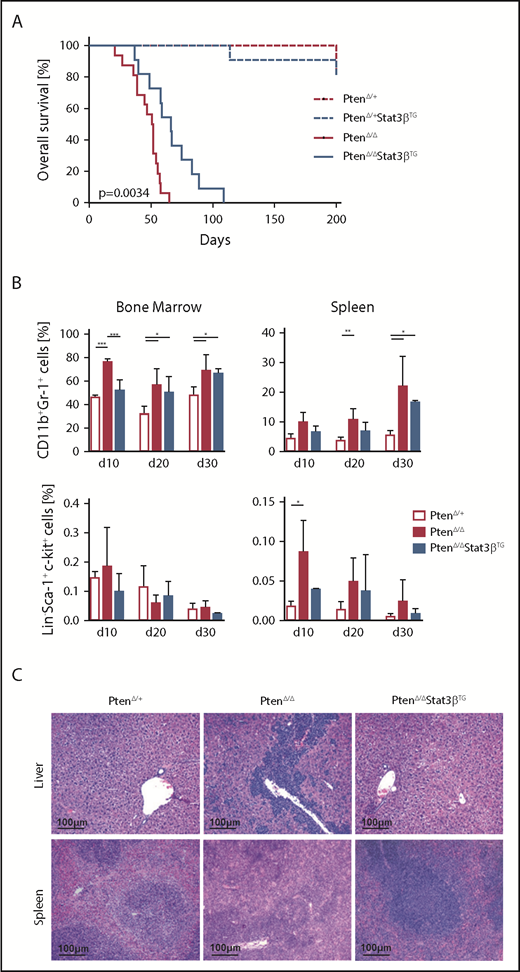
Elevated expression of STAT3β prolongs survival in an AML mouse model based on Pten deletion. (A) Kaplan-Meier plot showing the significantly different survival (P = .0034) of PtenΔ/Δ (n = 16) and PtenΔ/ΔStat3βTG (n = 11) mice, with PtenΔ/+ (n = 9) and PtenΔ/+ Stat3βTG (n = 11) as controls. (B) Percentages of myeloid (CD11b+Gr1+) and LSK cells in the BM and spleen of control, PtenΔ/Δ, and PtenΔ/ΔStat3βTG mice at 10, 20, and 30 days postinduction (n = 5 per group). Data (PtenΔ/+ vs PtenΔ/Δ vs PtenΔ/ΔStat3βTG for each time point) were compared using 1-way analysis of variance. (C) H&E-stained liver and spleen sections of PtenΔ/Δ, PtenΔ/ΔStat3βTG, and control mice at day 20 postinduction. *P < .05, **P < .01, ***P < .001.
Elevated expression of STAT3β prolongs survival in an AML mouse model based on Pten deletion. (A) Kaplan-Meier plot showing the significantly different survival (P = .0034) of PtenΔ/Δ (n = 16) and PtenΔ/ΔStat3βTG (n = 11) mice, with PtenΔ/+ (n = 9) and PtenΔ/+ Stat3βTG (n = 11) as controls. (B) Percentages of myeloid (CD11b+Gr1+) and LSK cells in the BM and spleen of control, PtenΔ/Δ, and PtenΔ/ΔStat3βTG mice at 10, 20, and 30 days postinduction (n = 5 per group). Data (PtenΔ/+ vs PtenΔ/Δ vs PtenΔ/ΔStat3βTG for each time point) were compared using 1-way analysis of variance. (C) H&E-stained liver and spleen sections of PtenΔ/Δ, PtenΔ/ΔStat3βTG, and control mice at day 20 postinduction. *P < .05, **P < .01, ***P < .001.
To address the effect of STAT3β on leukemia progression, we analyzed mice at 3 different time points after pIpC injection: days 10, 20, and 30. We focused on the myeloid lineage as well as on HSPCs (defined as Lin−Sca-1+c-Kit+ [LSK]). Compared with PtenΔ/+ control mice, PtenΔ/Δ mice already exhibited an increase of myeloid cells in BM and spleen at day 10, which was delayed upon Stat3βTG expression (Figure 3B top). Although the number of HSPCs in the BM remained relatively unchanged, Pten deletion caused a significant accumulation of HSPCs in the spleen, which was less pronounced in PtenΔ/ΔStat3βTG mice (Figure 3B bottom). Analysis of H&E-stained tissue sections from day 20 revealed reduced leukemic infiltration in liver and spleen of PtenΔ/ΔStat3βTG compared with PtenΔ/Δ mice (Figure 3C). Taken together, our data indicate that increased STAT3β levels impair leukemia progression and prolong disease latency in a Pten deletion–based AML mouse model.
Stat3βTG expression impairs colony formation capacity of MLL-AF9–transformed cells
The human fusion oncogene MLL-AF9 represents another widely used model for functional studies of AML.51,52 We harvested FLCs and BMCs from Stat3βTG and wt mice and transduced them with a retrovirus encoding for MLL-AF9, coupled to the fluorescent protein Venus (Figure 4A). Before BM isolation, mice were treated with pIpC to induce Stat3βTG expression, whereas FLCs were treated with interferon β (IFNβ) in vitro to activate the Mx1 promoter and express ectopic STAT3β (Figure 4B). As a control, all wt mice and FLCs were similarly treated with pIpC or IFNβ, respectively. Of note, expression of total and phosphorylated STAT3α seemed unaffected by the expression of Stat3βTG (Figure 4B). Homogeneous Venus+ cell populations were used for all further in vitro experiments (supplemental Figure 4A). Proliferation kinetics of MLL-AF9–transformed cells were not altered between Stat3βTG and wt cells (Figure 4C). Furthermore, mRNA levels of prominent STAT3α-regulated genes involved in cell proliferation remained unchanged in Venus+ Stat3βTG and wt FLCs (supplemental Figure 4B). However, in methylcellulose-based colony formation assays, the expression of Stat3βTG led to significantly reduced numbers of colonies for BMCs as well as FLCs (Figure 4D left) upon serial replating (supplemental Figure 4C). In addition, colony sizes were slightly reduced in Stat3βTG cells (Figure 4D right). Altogether, this indicates that Stat3βTG expression has no effect on STAT3α activity or proliferation but impairs the cellular capacity for self-renewal, colony formation, and tumorigenicity of MLL-AF9–transformed cells.
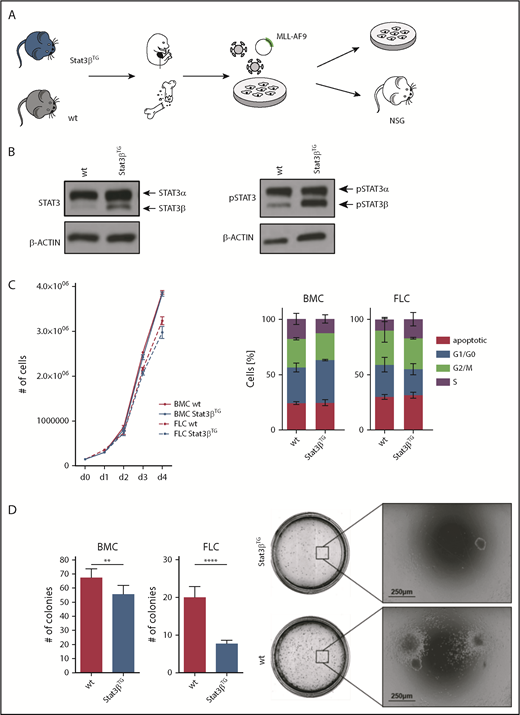
STAT3β impairs colony formation capacity of MLL-AF9–transformed cells. (A) Workflow of FLCs and BMCs harvested from Stat3βTG mice and wt littermates. MLL-AF9–transformed cells were subsequently used for in vitro analysis and transplantation. (B) Western blot analysis showing STAT3 and phosphorylated STAT3 (pSTAT3) expression in FLCs transformed with MLL-AF9. Stat3βTG expression was induced via stimulation with IFNβ. (C) in vitro proliferation was analyzed via growth curves and cell cycle analysis by flow cytometry. Data, indicating 3 independent experiments carried out in triplicates, were compared using the Student t test, and differences were found not to be statistically significant. (D) Methylcellulose-based colony formation assays were analyzed by number of colonies upon 4 replatings (1 replating shown; n = 12 per group). Representative pictures of BMC colonies are shown. Data, indicating 2 independent experiments, were compared using the Student t test. **P < .01, ****P < .0001. NSG, NOD.Cg-PrkdcscidIl2rgtm1Wjl/SzJ.
STAT3β impairs colony formation capacity of MLL-AF9–transformed cells. (A) Workflow of FLCs and BMCs harvested from Stat3βTG mice and wt littermates. MLL-AF9–transformed cells were subsequently used for in vitro analysis and transplantation. (B) Western blot analysis showing STAT3 and phosphorylated STAT3 (pSTAT3) expression in FLCs transformed with MLL-AF9. Stat3βTG expression was induced via stimulation with IFNβ. (C) in vitro proliferation was analyzed via growth curves and cell cycle analysis by flow cytometry. Data, indicating 3 independent experiments carried out in triplicates, were compared using the Student t test, and differences were found not to be statistically significant. (D) Methylcellulose-based colony formation assays were analyzed by number of colonies upon 4 replatings (1 replating shown; n = 12 per group). Representative pictures of BMC colonies are shown. Data, indicating 2 independent experiments, were compared using the Student t test. **P < .01, ****P < .0001. NSG, NOD.Cg-PrkdcscidIl2rgtm1Wjl/SzJ.
STAT3β has a tumor-suppressive effect in an MLL-AF9–dependent AML model
MLL-AF9–transformed Stat3βTG and wt FLCs were compared in an in vivo transplantation AML model. Transduced cells were injected into immunocompromised NOD.Cg-PrkdcscidIl2rgtm1Wjl/SzJ (NSG) mice, and 4 weeks later, mice were treated with pIpC to induce Stat3βTG expression. We confirmed Stat3βTG expression and phosphorylation with a FLAG-specific antibody and western blot (supplemental Figure 5A-B). Additionally, we investigated the mRNA expression of total Stat3 and both alternatively spliced isoforms (supplemental Figure 5C). Taken together, these data confirm the increased expression of STAT3β resulting from the transgene in vivo posttransplantation and furthermore demonstrate the unaffected expression and activation of STAT3α. As observed in the Pten model, transgenic Stat3β expression caused an increase in survival of mice in comparison with mice receiving wt cells in the MLL-AF9 model (Figure 5A). Immunophenotyping of Venus+ blasts in PB and BM revealed high expression levels of the myeloid marker CD11b together with low to intermediate expression levels of c-kit (supplemental Figure 5D). Clear signs of leukemic infiltration in liver, spleen, and PB were found in both experimental groups at the time of euthanasia (supplemental Figure 6A).
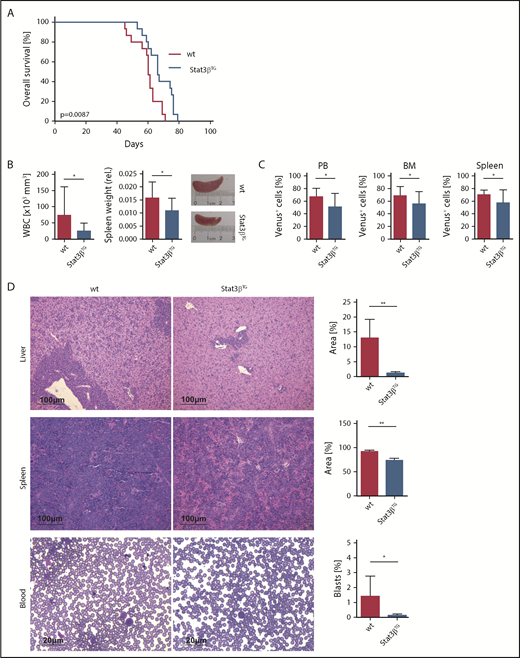
STAT3β prolongs survival and has a tumor-suppressive effect in MLL-AF9–dependent AML 6 weeks posttransplantation. (A) Kaplan-Meier plot of NOD.Cg-PrkdcscidIl2rgtm1Wjl/SzJ (NSG) mice receiving transplants of Stat3βTG and wt FLCs (n = 15 per group), showing significantly different survival (P = .0087). (B) WBC count and relative spleen weight and size. (C) Quantification by flow cytometry of myeloid Venus+ blasts in PB, BM, and spleen of Stat3βTG and wt mice. (D) H&E-stained liver and spleen sections and PB smears of wt and Stat3βTG animals. Quantifications shown as infiltrate area/total organ area (%) and number of blasts/total cell number (%). (B-D) Data were compared using the Student t test. *P < .05, **P < .01.
STAT3β prolongs survival and has a tumor-suppressive effect in MLL-AF9–dependent AML 6 weeks posttransplantation. (A) Kaplan-Meier plot of NOD.Cg-PrkdcscidIl2rgtm1Wjl/SzJ (NSG) mice receiving transplants of Stat3βTG and wt FLCs (n = 15 per group), showing significantly different survival (P = .0087). (B) WBC count and relative spleen weight and size. (C) Quantification by flow cytometry of myeloid Venus+ blasts in PB, BM, and spleen of Stat3βTG and wt mice. (D) H&E-stained liver and spleen sections and PB smears of wt and Stat3βTG animals. Quantifications shown as infiltrate area/total organ area (%) and number of blasts/total cell number (%). (B-D) Data were compared using the Student t test. *P < .05, **P < .01.
To investigate the effect of STAT3β on MLL-AF9–driven leukemia progression, we analyzed mice 6 weeks posttransplantation. Here, the delayed disease phenotype in Stat3βTG mice was evident in direct comparison; WBC count and relative spleen weight and size were reduced in the Stat3βTG group (Figure 5B). Numbers of myeloid Venus+ blasts were notably lower in PB, BM, and spleen of Stat3βTG mice (Figure 5C). H&E-stained tissue sections demonstrated significantly decreased infiltration in liver and spleen and diminished numbers of blasts in PB smears (Figure 5D). In accordance with our previous observations, these results show that the elevated expression of STAT3β delays disease progression and the leukemic infiltration of peripheral hematopoietic organs, explaining the demonstrated survival advantage in Stat3βTG mice.
Next, we addressed proliferation and apoptosis in the MLL-AF9–dependent AML model. Neither in quantification of Ki67+ cells (supplemental Figure 6B) nor in cell cycle analysis of Venus+ spleen-derived blasts did we observe a significant difference in proliferation (supplemental Figure 6C). Spleen and liver sections stained for cleaved caspase 3 demonstrated similarly low levels of apoptosis in both groups (supplemental Figure 6D), which was confirmed by annexin V staining of blasts derived from PB, BM, liver, and spleen (supplemental Figure 6E). Thus, the antitumorigenic function of STAT3β seems to be independent of the direct regulation of apoptosis or proliferation.
Gene expression patterns of migratory target genes change upon increased STAT3β expression
To identify Stat3βTG-induced global changes in gene expression in MLL-AF9–driven leukemia, we performed RNA sequencing of sorted Venus+ BMCs harvested from mice 6 weeks posttransplantation. We analyzed 3 animals per group and found 70 genes that were significantly up- (32 genes) or downregulated (38 genes) upon Stat3βTG expression (Figure 6A). Gene set enrichment analysis revealed enriched expression of genes in the interleukin 6 (IL6)/JAK/STAT3 signaling pathway in Stat3βTG blasts (supplemental Figure 7A). Furthermore, genes allocated to Reactome pathways of cell surface interactions at the vascular wall were significantly upregulated, including Sell, Itgax, and Cd177 (supplemental Figure 7B). The surface molecule SELL (L-SELECTIN, CD62L) represents an interesting target due to its role in lymphocyte migration through vasculature, because a downregulation of SELL on lymphocytes or leukemic blasts can initiate cell migration from the BM into the PB, where it is shed.53-56 Expression of Sell was significantly upregulated in Stat3βTG blasts at the mRNA level (Figure 6B top). We confirmed the Stat3βTG-specific upregulation of SELL in vivo on BM-derived Venus+ blasts via flow cytometry (Figure 6B middle). Additionally, we measured soluble, shed SELL in the plasma and detected decreased levels in mice receiving Stat3βTG cell transplants (Figure 6B bottom), indicating that Stat3βTG blasts migrate in lower numbers in comparison with wt. This is in accordance with our in vivo findings, which demonstrated a significantly reduced organ infiltration and blast count in the PB of the Stat3βTG group. Lastly, we repeated the methylcellulose-based colony formation assays with BMCs and FLCs that were previously treated with a blocking antibody for cell surface–bound SELL/CD62L. Indeed, the antibody-mediated blocking of SELL reversed the effect of Stat3βTG expression (Figure 6C) upon serial replating (supplemental Figure 7C). As a control, we analyzed the blocking efficiency via flow cytometry (supplemental Figure 7D). In addition, we used publicly available data to identify STAT3-specific binding motifs in the Sell promoter (supplemental Figure 8A). Analysis of published chromatin immunoprecipitation sequencing data sets from human and mouse samples confirmed multiple STAT3 binding events in regions across the gene (supplemental Figure 8B). In summary, these data show that STAT3β can promote target gene induction and actively influence the expression of cell surface markers in MLL-AF9–expressing blasts involved in vascular interaction and migration. Among those markers, SELL might play a distinct role in the antitumorigenic effect of Stat3βTG in AML cells.
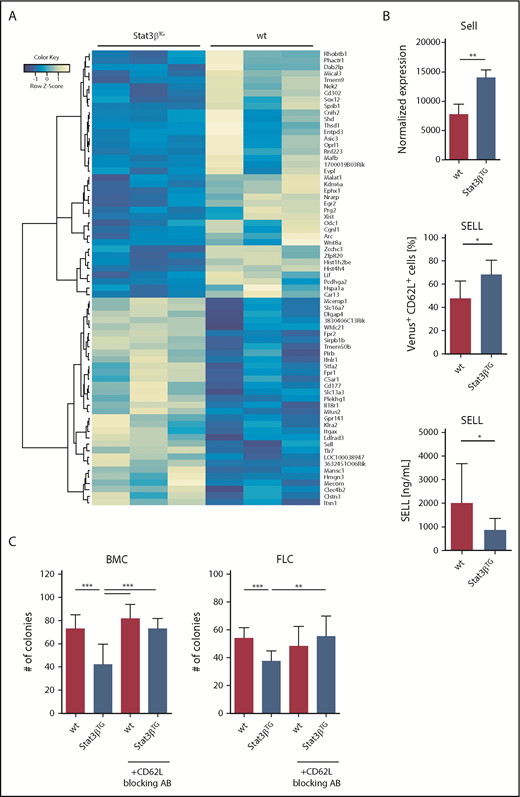
Gene expression patterns upon increased STAT3β expression reveal SELL to be a potential STAT3β target. (A) Heatmap showing significantly up- (32 genes) or downregulated (38 genes) genes between murine wt and Stat3βTG BM-derived Venus+ blasts (n = 3). (B) Normalized mRNA expression, displaying the upregulation of Sell in Venus+ Stat3βTG blasts, is shown (top; n = 3 per group). Quantification of cell surface–bound SELL/CD62L in BM-derived Venus+ blasts, measured by flow cytometry (middle; n = 6 per group), and levels of soluble, shed SELL in plasma, assessed via enzyme-linked immunosorbent assay (bottom; n = 9 per group), demonstrate the upregulation of SELL on the cell surface of Stat3βTG blasts and the difference in shed SELL present in PB. Data were compared using the Student t test. (C) Methylcellulose-based colony formation assays of wt and Stat3βTG FLCs and BMCs, pretreated with or without a blocking antibody for SELL/CD62L (MEL-14), were analyzed by number of colonies upon 3 replatings (1 replating shown; n = 12 per group). Data were compared using 1-way analysis of variance. *P < .05, **P < .01, ***P < .001.
Gene expression patterns upon increased STAT3β expression reveal SELL to be a potential STAT3β target. (A) Heatmap showing significantly up- (32 genes) or downregulated (38 genes) genes between murine wt and Stat3βTG BM-derived Venus+ blasts (n = 3). (B) Normalized mRNA expression, displaying the upregulation of Sell in Venus+ Stat3βTG blasts, is shown (top; n = 3 per group). Quantification of cell surface–bound SELL/CD62L in BM-derived Venus+ blasts, measured by flow cytometry (middle; n = 6 per group), and levels of soluble, shed SELL in plasma, assessed via enzyme-linked immunosorbent assay (bottom; n = 9 per group), demonstrate the upregulation of SELL on the cell surface of Stat3βTG blasts and the difference in shed SELL present in PB. Data were compared using the Student t test. (C) Methylcellulose-based colony formation assays of wt and Stat3βTG FLCs and BMCs, pretreated with or without a blocking antibody for SELL/CD62L (MEL-14), were analyzed by number of colonies upon 3 replatings (1 replating shown; n = 12 per group). Data were compared using 1-way analysis of variance. *P < .05, **P < .01, ***P < .001.
Increased levels of SELL correlate with favorable clinical prognosis and increased event-free survival in AML patients
Finally, we investigated SELL expression in our AML cohort of favorable, intermediate, and adverse prognostic groups and found elevated mRNA levels of SELL in patients with a favorable prognosis, which was associated with a higher STAT3β/α mRNA ratio (Figure 7A). Accordingly, we also found elevated levels of SELL/CD62L in samples derived from patients with a favorable prognosis measured via flow cytometry (Figure 7B). Using 3 of the identified STAT3β-regulated gene targets involved in cell migration (SELL, ITGAX, CD177) as a STAT3β gene signature and a publicly available AML patient data set (n = 740), we were able to show an association between high expression of the STAT3β signature and prolonged event-free survival (HR, 0.78; P = .033; Figure 7C). In conclusion, these data suggest that STAT3β-dependent elevated SELL expression correlates with a favorable outcome in AML patients.
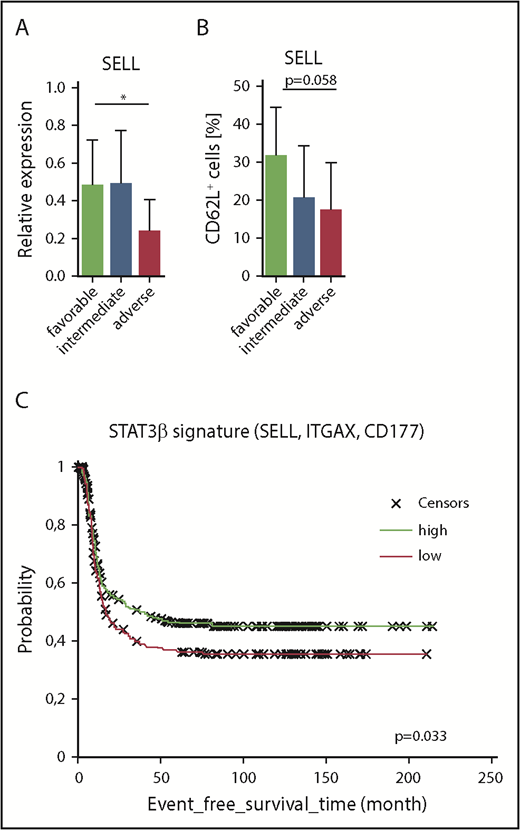
Increased levels of SELL correlate with favorable clinical prognosis in our AML cohort and increased event-free survival in publicly available AML patient data sets. (A) SELL mRNA expression levels (normalized to β-ACTIN) in AML patients with favorable (n = 9), intermediate (n = 38), or adverse (n = 8) prognosis. Data (favorable vs adverse) were compared using the Student t test. (B) SELL/CD62L expression levels analyzed by flow cytometry in AML blasts from patients with favorable (n = 7), intermediate (n = 38), or adverse (n = 7) prognosis. Data (favorable vs adverse) were compared using the Student t test, and significance is indicated by P = .058. (C) Gene signatures from publicly available AML patient data sets (n = 740) were compared, showing that patients with high expression of the STAT3β signature (SELL, ITGAX, CD177) had better survival compared with patients with low expression in 740 AML patients (HR, 0.78; P = .33). *P < .05.
Increased levels of SELL correlate with favorable clinical prognosis in our AML cohort and increased event-free survival in publicly available AML patient data sets. (A) SELL mRNA expression levels (normalized to β-ACTIN) in AML patients with favorable (n = 9), intermediate (n = 38), or adverse (n = 8) prognosis. Data (favorable vs adverse) were compared using the Student t test. (B) SELL/CD62L expression levels analyzed by flow cytometry in AML blasts from patients with favorable (n = 7), intermediate (n = 38), or adverse (n = 7) prognosis. Data (favorable vs adverse) were compared using the Student t test, and significance is indicated by P = .058. (C) Gene signatures from publicly available AML patient data sets (n = 740) were compared, showing that patients with high expression of the STAT3β signature (SELL, ITGAX, CD177) had better survival compared with patients with low expression in 740 AML patients (HR, 0.78; P = .33). *P < .05.
Discussion
STAT3 is frequently found to be constitutively active in AML.25-27 We were able to demonstrate a low STAT3β/α mRNA ratio in AML cells in comparison with healthy HSPCs as well as a high STAT3β/α mRNA ratio in patients with a favorable cytogenetic prognosis. Moreover, a lower STAT3β/α mRNA ratio was associated with higher overall mortality. Notably, this relationship persists despite correction for established prognostic factors, such as cytogenetic risk category, age, and percentage of blasts at diagnosis. Although these results need to be verified in larger confirmatory studies, they are especially plausible in light of the mechanistic insight gained from our animal experiments, pointing to a central role of STAT3β in AML. Intriguingly, findings are similar to the described STAT3β function in esophageal squamous cell carcinoma patients, where it was established as a protective prognostic marker.17
Here, we describe a novel tumor-suppressive role for STAT3β in AML. Evidence was provided from an inducible Stat3β transgenic mouse model in combination with 2 independent drivers for AML, either MLL-AF9 expression or PTEN deficiency. We demonstrated that Stat3βTG expression in AML blasts significantly extended survival by delaying infiltration of PB and hematopoietic organs, which is characteristic for AML. Our data further suggest that the antitumorigenic effect of STAT3β depends on the tumor-intrinsic regulation of a small set of significantly regulated genes. Several genes of the IL6/JAK/STAT3 signaling pathway and the Reactome pathway for cell surface interactions at the vascular wall were upregulated in Stat3βTG blasts, demonstrating that STAT3β can actively regulate gene expression.11,13-16 SELL was identified as a target gene of interest, because it was shown to be specifically upregulated in Stat3βTG blasts and is known to be expressed in newly diagnosed AML patients.57-61 In particular, SELL is important for the homing of AML cells, because its downregulation could initiate the mobilization of AML blasts from the BM into the PB, where it is shed and remains in the PB in its soluble form.53-56 In our MLL-AF9–based AML in vivo model, SELL was specifically upregulated in Stat3βTG BM–resident AML blasts at the mRNA and protein levels in comparison with wt. This explains the delayed peripheral infiltration of Stat3βTG blasts and the consequent suspension of disease progression. In line with this, levels of shed SELL in the PB were significantly reduced in mice receiving Stat3βTG cells, indicating a clear reduction in AML cell mobilization.
SELL expression on hematopoietic progenitors in vitro has been described to correlate with their clonogenic potential.62 Likewise, we found the capacity of transformed BMCs and FLCs for in vitro colony formation to be impaired upon Stat3βTG expression, which was preventable with antibody-mediated blocking of SELL. Together, these findings indicate that the antitumorigenic effect of Stat3βTG expression in AML cells might be at least partially dependent on the upregulation of SELL. However, because the colony formation capacity of HSPCs and AML cells considerably depends on STAT3 activity,28,63 STAT3β might also counteract STAT3 and therefore reduce colony formation. Because of its unique C-terminus, STAT3β homodimers have been demonstrated to exhibit prolonged phosphorylation and nuclear retention64 as well as enhanced DNA-binding affinity16,65 and dimer stability.65 Thus, STAT3β can directly compete with STAT3α and furthermore regulate STAT3α via the formation of heterodimers.15,17 Nevertheless, we failed to obtain any evidence suggesting a negative regulation of STAT3α by STAT3β in AML. In fact, we found the activity of STAT3α and STAT3α-regulated genes in AML blasts to be unaffected by the expression of Stat3βTG, which is similar to previous findings.11
In AML patients, increased SELL expression was reported to correlate with good-risk karyotypes.66 Accordingly, we found SELL levels to be significantly elevated in patients with a favorable prognosis, in contrast to patients with an adverse prognosis. Furthermore, analysis of publicly available AML data sets revealed a correlation between high expressions of newly identified STAT3β-regulated migratory genes (SELL, ITGAX, CD177) and superior event-free survival. In addition to Sell, Itgax, and CD177, we identified other novel STAT3β-regulated genes, such as Lif, Sox12, Mafb, and Ifnlr1, that might also contribute to the tumor-suppressive effect of STAT3β but whose specific role in AML remains elusive. Taken together, the exact mechanism underlying the tumor-suppressive function of STAT3β is most likely a combination of various regulated genes, such as Sell, and deserves further investigation.
In summary, our study unequivocally demonstrates that STAT3β acts as a tumor suppressor in AML and specifically regulates gene expression in AML blasts, impairing leukemia progression and extending survival.
The full-text version of this article contains a data supplement.
Acknowledgments
The authors thank J. Zuber (Research Institute of Molecular Pathology, Vienna, Austria) for the pMSCV-MLL-AF9-IRES-Venus construct as well as S. Höger, M. Schlederer, S. Zahma, and J. Mohrherr for their help and expertise in immunohistochemistry. The authors also thank C. Bock (Research Center for Molecular Medicine, Vienna, Austria) and the Biomedical Sequencing Facility. The authors are grateful to V. Sexl, B. Strobl, and M. Müller for helpful discussions. O. Sharif, V. Greß, A. Elkasaby, and S. Edtmayer provided further support.
The position of P.A. is funded by the Children’s Cancer Research Institute, Vienna, Austria. Financial support was further provided by Marie Curie International Incoming Fellowship CMLMULTIHIT (#254408) (T.M.), Austrian Science Fund (FWF) grants #SFB-F4707-B20 and #SFB-F6105 (R.M.), FWF grant #P25599 (E.C.), and European Research Council Starting Grant ONCOMECHAML (#636855/StG) (F.G. and T.E.).
P.A. is a PhD candidate at the Medical University of Vienna, and this work is submitted in partial fulfillment of the requirement for a PhD.
Authorship
Contribution: P.A., T.M., E.C., and D.S. designed research; P.A. and T.M. performed experiments and analyzed data; E.C., J.H., V.J., S.H., T.E., H.P.M., A.Y., L.K., and B.G. performed and analyzed additional experiments; H.S., K.L., M.J.M.F., F.G., R.M., and E.C. provided essential material and discussion; P.A. and D.S. wrote the manuscript; and all authors approved the manuscript.
Conflict-of-interest disclosure: The authors declare no competing financial interests.
Correspondence: Dagmar Stoiber, Division of Pharmacology, Department Pharmacology, Physiology and Microbiology, Karl Landsteiner University of Health Sciences, Dr.-Karl-Dorrek-Str 30, 3500 Krems, Austria; e-mail: dagmar.stoiber@kl.ac.at.

