

Key Points
Risk for second infection-related solid cancers after NHL varies by NHL subtype.
Associations between NHL and solid cancers suggest that shared infectious etiology has implications for surveillance of adult NHL survivors.

Abstract
Infectious agents have been identified in the etiology of certain non-Hodgkin lymphoma (NHL) subtypes and solid tumors. The impact of this shared etiology on risk for second cancers in NHL survivors has not been comprehensively studied. We used US population–based cancer registry data to quantify risk of solid malignancies associated with infectious etiology among 127 044 adult 1-year survivors of the 4 most common NHL subtypes diagnosed during 2000 to 2014 (mean follow-up, 4.5-5.2 years). Compared with the general population, elevated risks for liver, stomach, and anal cancers were observed among diffuse large B-cell lymphoma (DLBCL) survivors (standardized incidence ratio [SIR], 1.85; 95% confidence interval [CI], 1.46-2.31; SIR, 1.51; 95% CI, 1.16-1.94; SIR, 3.71; 95% CI, 2.52-5.27, respectively) and marginal zone lymphoma (MZL; SIR, 1.98; 95% CI, 1.34-2.83; SIR, 2.78; 95% CI, 2.02-3.74; SIR, 2.36; 95% CI, 1.02-4.64, respectively) but not follicular lymphoma or chronic lymphocytic leukemia/small lymphocytic lymphoma. Anal cancer risk was particularly elevated among DLBCL survivors with HIV (SIR, 68.34; 95% CI, 37.36-114.66) vs those without (SIR, 2.09; 95% CI, 1.22-3.34). The observed patterns are consistent with shared associations between these cancers and hepatitis C virus, Helicobacter pylori, and HIV, respectively. In contrast, risks for cervical and oropharyngeal/tonsil cancers were not elevated among survivors of any NHL subtype, possibly because of the lack of NHL association with human papillomavirus or population-wide screening practices (for cervical cancer). In summary, patterns of elevated second cancer risk differed by NHL subtype. Our results suggest shared infectious etiology has implications for subsequent cancer risks among DLBCL and MZL survivors, which may help inform surveillance for these survivors.
Introduction
Non-Hodgkin lymphoma (NHL), the most common hematologic malignancy, is etiologically and clinically heterogeneous. An infectious etiology has been shown to contribute to certain NHLs, most commonly diffuse large B-cell lymphoma (DLBCL), marginal zone lymphoma (MZL), and Burkitt lymphoma based on associations with hepatitis C virus (HCV),1,2 Helicobacter pylori,2 and HIV/AIDS.1,3 In contrast, these infectious agents do not seem to be strongly associated with other common NHLs, such as chronic lymphocytic leukemia (CLL)/small lymphocytic lymphoma (SLL) or follicular lymphoma (FL).
For most NHL subtypes, substantial advances in treatment approaches in the last several decades have led to improvements in prognosis and a corresponding increased focus on the long-term health of NHL survivors. Development of a subsequent malignancy is an important cause of morbidity and mortality among NHL survivors, but risks for specific types of subsequent malignancies seem to vary by subtype of NHL.4 Many of the infectious agents associated with NHL, along with others such as human papillomavirus (HPV), are also established causes of a number of solid tumors, including cancers of the oropharynx/tonsil, stomach, liver, lung, anus, and cervix as well as Kaposi sarcoma.1-3,5-7 As with NHL, the associations vary markedly by type of solid tumor.
Given the heterogeneity between specific infectious agents and NHL subtypes as well as solid cancers, we hypothesized that risk of solid cancers that have been linked with infectious etiology would vary among survivors of different NHL subtypes. We tested this hypothesis by investigating the risk of developing infection-related solid cancers after the 4 most common subtypes of NHL (DLBCL, FL, CLL/SLL, and MZL) using large-scale population-based cancer registry data in the United States.
Methods
Study population
Eligible patients included adults age 20 to 84 years who were diagnosed with first primary NHL during 2000 to 2014 and survived at least 1 year after diagnosis, as reported to 17 Surveillance, Epidemiology, and End Results Program (SEER) registries (Atlanta, Connecticut, Detroit, Hawaii, Iowa, New Mexico, San Francisco–Oakland, Seattle–Puget Sound, Utah, Los Angeles, San Jose–Monterey, Rural Georgia, Greater California, Kentucky, Louisiana, New Jersey, and Greater Georgia). We included the following specific NHL subtypes, defined by International Classification of Diseases for Oncology, third edition (ICD-O-3), morphology codes and grouped according to World Health Organization classification: DLBCL (ICD-O-3 codes M9678-9680, 9684 [B-cell immunophenotype only], 9688, 9712, 9737-9738), FL (M9690-9691, 9695, 9698), CLL/SLL (M9670, 9823), and MZL (M9689, 9699, 9760, 9764).8 Other subtypes of NHL were not included because of small sample size (n < 10 000).
Second primary infection-related solid tumors were identified using ICD-O-3 topography codes, specified as cancers of the oropharynx/tonsil (topography codes C000-148), stomach (C160-169), liver (C220), anus (C210-212, 218), and cervix (C530-539), including all morphologies except M9050 to 9055, 9140, and 9590 to 9992, which represent codes for mesothelioma, Kaposi sarcoma, and lymphoid/myeloid neoplasms. The oropharynx/tonsil are the cancer sites in the oral cavity/pharynx most likely to be associated with HPV, and we included only tumors with squamous morphology (C019, 024, 090-109, 142; M8050-8076, 8078, 8083-8084, 8094). Although Kaposi sarcoma is caused by Kaposi sarcoma–associated herpesvirus,9 it was not considered in this analysis because of small sample sizes among NHL survivors (n ≤ 3 for each of the first primary NHL subtypes investigated). Additionally, for the same reason, we did not investigate cancers of the penis, vagina, or vulva, which are also associated with HPV.10
Statistical analysis
Patients were followed from 1 year after their first primary NHL diagnosis to the earliest of the following: second primary malignancy diagnosis, last follow-up, age 85 years, death, or end of study (31 December 2014). The first year after NHL diagnosis was excluded to avoid bias from increased medical surveillance after a primary cancer diagnosis, and follow-up time after age 85 years was censored because of concerns of underascertainment of new malignancies at older ages.11 We also conducted a sensitivity analysis excluding the first 3 years of follow-up after NHL diagnosis to further reduce the potential for surveillance bias.
We estimated standardized incidence ratios (SIRs) and 95% confidence intervals (CIs) using exact Poisson methods to compare the observed number of second primary infection-related solid tumor diagnoses after a first primary NHL with that expected in the general population (SEER*Stat [version 8.3.4]). The expected number of malignancies was generated by multiplying general population incidence rates stratified by age (5-year groups), race, sex, and calendar year of diagnosis (2000-2004, 2005-2009, 2010-2014) by the person-time at risk of the patient cohort and summing over these strata.4
For those combinations of first primary NHL subtype and second solid tumor with at least 20 observed events, we estimated SIRs among patient subgroups to identify those at higher risk and provide insights into etiology. Subgroups were defined by calendar year of first primary diagnosis, time since first primary diagnosis, age at first primary diagnosis, stage of first primary NHL, and initial treatment of first primary NHL (chemotherapy and radiotherapy, chemotherapy without known radiotherapy, radiotherapy without known chemotherapy, and no known initial chemotherapy or radiotherapy). We used the Ann Arbor staging classification to categorize DLBCL, FL, and MZL as early (stage I or II), advanced (stage III or IV), or unknown stage,12 whereas CLL/SLL stage was approximated using information collected by SEER on initial treatment as early (no/unknown initial therapy) vs advanced stage (any initial therapy), because stage for CLL is not captured in SEER.
We constructed multivariable Poisson models including all patients to test for overall SIR heterogeneity among the 4 NHL subtypes for each second solid cancer investigated (Epicure [version 2.0]).13 We then constructed separate multivariable Poisson models within each NHL subtype to test for differences in the SIRs among patient subgroups. Final models were mutually adjusted through stratification for age at first primary cancer diagnosis, time since NHL diagnosis, and sex. Inclusion of the log of the expected number of cases as an offset further indirectly adjusted for attained age and calendar year.14 Analyses were not adjusted for stage at first primary NHL, initial treatment of first primary NHL, or calendar year of first primary NHL, because they did not substantially change the risk estimates of other variables. Two-sided P values for heterogeneity were derived from likelihood ratio tests comparing models with and without the factor of interest.
We also conducted 2 secondary analyses. First, we computed SIRs for stomach cancer after DLBCL and MZL according to primary site of involvement (nodal, gastric [extranodal], or nongastric [extranodal], based on the substantial evidence associating H pylori with risk for gastric MZL1 and, to a lesser extent, gastric DLBCL.15 Second, using the only data on a specific infection available in SEER, we stratified the DLBCL cohort based on HIV/AIDS status at the time of diagnosis; comparable analyses for survivors of other NHL subtypes were not possible because of insufficient sample size. Iowa does not collect data on HIV/AIDS status because of the low rate of infection in that population and thus potential risk of identification of affected individuals; therefore, all individuals from that registry were included in the “no known HIV/AIDS” group.
Results
Among 127 044 1-year survivors of first primary NHL (Table 1), a majority of patients were white, with a mean follow-up time ranging from 4.5 to 5.2 years from diagnosis. Patients with CLL/SLL were slightly older and included a larger proportion of men than other NHL subtypes. Initial treatment differed among NHL subtypes; for example, most CLL/SLL patients received no known initial chemotherapy or radiotherapy (77.6%), whereas most DLBCL patients received initial chemotherapy (86.2%).
Characteristics of 1-y survivors by type of first primary NHL diagnosed from age 20 to 84 y, 17 SEER registry areas, 2000 to 2014
| Characteristic | CLL/SLL, % (n = 42 119) | DLBCL, % (n = 41 416) | FL, % (n = 29 508) | MZL, % (n = 14 001) |
|---|---|---|---|---|
| Age at first primary NHL, y | ||||
| <60 | 29.5 | 46.4 | 47.8 | 40.1 |
| ≥60 | 70.5 | 53.6 | 52.2 | 59.9 |
| Mean | 65.9 | 59.7 | 60.4 | 62.5 |
| Mean follow-up time, y | 4.5 | 4.6 | 5.2 | 4.8 |
| Sex | ||||
| Male | 60.5 | 54.9 | 49.9 | 45.4 |
| Female | 39.5 | 45.1 | 50.1 | 54.6 |
| Race | ||||
| White/unknown | 90.1 | 84.0 | 90.4 | 83.9 |
| African American | 7.4 | 7.7 | 4.7 | 8.1 |
| Other | 2.5 | 8.3 | 4.9 | 8.0 |
| Year of first primary NHL diagnosis | ||||
| 2000-2004 | 34.0 | 33.2 | 34.6 | 30.5 |
| 2005-2009 | 36.8 | 36.2 | 37.7 | 37.8 |
| 2010-2014 | 29.3 | 30.6 | 27.7 | 31.7 |
| First course of NHL treatment | ||||
| CT and RT | 0.6 | 24.4 | 7.5 | 4.6 |
| CT, no known RT | 21.1 | 61.8 | 49.2 | 27.9 |
| RT, no known CT | 0.7 | 2.0 | 9.3 | 20.1 |
| No known CT or RT | 77.6 | 11.8 | 34.0 | 47.4 |
| Stage at first primary NHL* | ||||
| Early | 71.5 | 51.6 | 42.5 | 51.3 |
| Advanced | 28.5 | 43.1 | 50.2 | 32.8 |
| Unknown | — | 5.3 | 7.3 | 15.9 |
| Primary site (NHL) | ||||
| Nodal | — | 64.3 | — | 40.0 |
| Extranodal, gastric | — | 4.6 | — | 20.3 |
| Extranodal, nongastric | — | 31.0 | — | 39.7 |
| HIV/AIDS status at NHL diagnosis | ||||
| Reported HIV/AIDS | 0.1 | 3.6 | 0.5 | 0.7 |
| No known HIV/AIDS | 99.9 | 96.4 | 99.5 | 99.3 |
CT, chemotherapy; RT, radiotherapy.
Early stage: Ann Arbor stages I and II for DLBCL, FL, and MZL and no known initial treatment of CLL; advanced stage: Ann Arbor stages III and IV for DLBCL, FL, and MZL and any initial treatment of CLL.
Risks for developing second primary cancers of the stomach, liver, and anus differed significantly by first primary NHL subtype (Table 2). Compared with the general population, risks were statistically significantly increased after DLBCL (stomach: SIR, 1.51; 95% CI, 1.16-1.94; liver: SIR, 1.85; 95% CI, 1.46-2.31; anus: SIR, 3.71; 95% CI, 2.52-5.27) and MZL (stomach: SIR, 2.78; 95% CI, 2.02-3.74; liver: SIR, 1.98, 95% CI, 1.34-2.83; anus: SIR, 2.36; 95% CI, 1.02-4.64) but not after CLL/SLL (stomach: SIR, 0.70; 95% CI, 0.50-0.96; liver: SIR, 1.04; 95% CI, 0.78-1.36; anus: SIR, 1.57; 95% CI, 0.90-2.55) or FL (stomach: SIR, 0.81; 95% CI, 0.53-1.19; liver: SIR, 0.98; 95% CI, 0.67-1.39; anus: SIR, 0.67; 95% CI, 0.22-1.56). These patterns of association were similar when we restricted our study population to 3-year survivors (supplemental Table 1). In contrast to these results, risks for cancers of the oropharynx/tonsil and cervix were not significantly elevated after any of the 4 NHL subtypes evaluated (SIR range, 0.68-1.08; Table 2).
Risk for developing second primary infection-related solid tumors among adult 1-y NHL survivors, 17 SEER registry areas, 2000 to 2014
| Second primary malignancy site | First primary NHL subtype | Pheterogeneity* | |||||||||||
|---|---|---|---|---|---|---|---|---|---|---|---|---|---|
| CLL/SLL | DLBCL | FL | MZL | ||||||||||
| Obs | SIR† | 95% CI† | Obs | SIR† | 95% CI† | Obs | SIR† | 95% CI† | Obs | SIR† | 95% CI† | ||
| Oropharynx/tonsil | 30 | 1.08 | 0.73-1.54 | 22 | 1.04 | 0.65-1.58 | 18 | 1.00 | 0.59-1.58 | 7 | 0.96 | 0.39-1.98 | .99 |
| Stomach | 39 | 0.70‡ | 0.50-0.96 | 62 | 1.51‡ | 1.16-1.94 | 26 | 0.81 | 0.53-1.19 | 44 | 2.78‡ | 2.02-3.74 | <.01 |
| Anus | 16 | 1.57 | 0.90-2.55 | 31 | 3.71‡ | 2.52-5.27 | 5 | 0.67 | 0.22-1.56 | 8 | 2.36‡ | 1.02-4.64 | <.01 |
| Liver | 54 | 1.04 | 0.78-1.36 | 76 | 1.85‡ | 1.46-2.31 | 32 | 0.98 | 0.67-1.39 | 30 | 1.98‡ | 1.34-2.83 | <.01 |
| Cervix uteri | 7 | 0.78 | 0.31-1.61 | 9 | 0.89 | 0.41-1.69 | 8 | 0.87 | 0.38-1.72 | <5 | 0.68 | 0.14-1.98 | .98 |
Obs, observed.
P values to test differences in SIRs across NHL subtypes were computed using likelihood ratio test derived from Poisson regression models adjusted for age at first primary NHL, sex, and latency, with log of expected numbers of cases included as offset. Exact numbers of cases are not reported for categories with <5 observed cases to maintain patient confidentiality. All statistical tests were 2 sided.
SIRs and exact Poisson-based 95% CIs compared number of observed cases with that expected in general population (additional details provided in “Methods”).
Indicates 95% CI excludes 1.00, corresponding to 2-sided P < .05.
In secondary analyses of second primary stomach cancer risk after DLBCL and MZL stratified by extranodal site (gastric, nongastric), we observed significantly elevated SIRs among gastric MZL survivors (SIR, 6.70; 95% CI, 4.34-9.90) but not among nongastric extranodal MZL survivors (SIR, 1.67; 95% CI, 0.80-3.06; Pheterogeneity < .01; Figure 1) or nodal MZL survivors (data not shown; SIR, 1.48; 95% CI, 0.68-2.81). This risk after gastric MZL was similar across treatments (data not shown; SIR range, 5.98-9.15). Likewise, the SIR for stomach cancer was significantly increased after gastric DLBCL (SIR, 2.67; 95% CI, 1.07-5.50) but not after nongastric extranodal DLBCL (SIR, 1.32; 95% CI, 0.77-2.11), although the SIRs did not differ significantly (Pheterogeneity = .12). Additionally, the SIR for stomach cancer was elevated among survivors of nodal DLBCL (SIR, 1.50; 95% CI, 1.06-2.05). In secondary analyses stratifying DLBCL survivors by HIV/AIDS status at the time of diagnosis, the risk of anal cancer was much more strongly elevated among those with known HIV/AIDS (SIR, 68.34; 95% CI, 37.36-114.66) than those without known HIV/AIDS (SIR, 2.09; 95% CI, 1.22-3.34; Table 3).
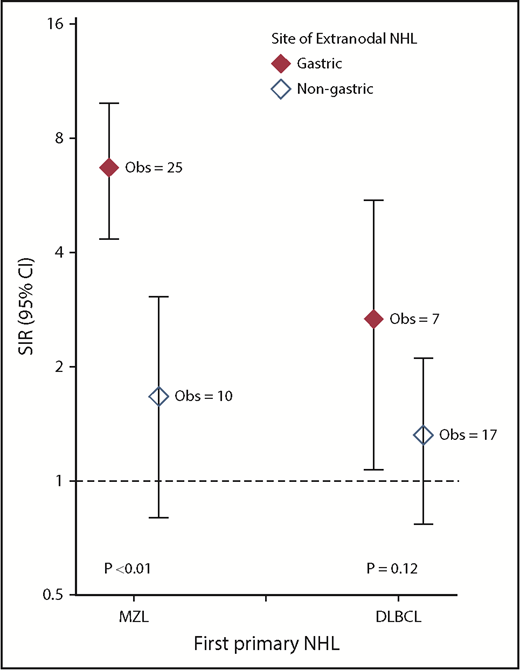
Risk for developing second primary stomach cancer among adult 1-year DLBCL and MZL survivors by site of DLBCL or MZL, 2000 to 2014. SIRs and exact Poisson-based 95% CIs compared the number of observed cases with that expected in the general population (additional details provided in “Methods”). P values to test differences in the SIRs were computed using a likelihood ratio test derived from Poisson regression models stratified by age at first primary NHL, sex, and latency, with the log of the expected numbers of cases included as an offset. All statistical tests were 2 sided. Created using GraphPad Prism (version 7; La Jolla, CA).
Risk for developing second primary stomach cancer among adult 1-year DLBCL and MZL survivors by site of DLBCL or MZL, 2000 to 2014. SIRs and exact Poisson-based 95% CIs compared the number of observed cases with that expected in the general population (additional details provided in “Methods”). P values to test differences in the SIRs were computed using a likelihood ratio test derived from Poisson regression models stratified by age at first primary NHL, sex, and latency, with the log of the expected numbers of cases included as an offset. All statistical tests were 2 sided. Created using GraphPad Prism (version 7; La Jolla, CA).
Risk for developing second primary infection-related solid tumors among reported HIV/AIDS+adult DLBCL survivors, SEER, 2000 to 2014
| Second primary malignancy site | HIV/AIDS | No known HIV/AIDS* | ||||
|---|---|---|---|---|---|---|
| Obs | SIR | 95% CI | Obs | SIR | 95% CI | |
| Oropharynx/tonsil | <5 | 1.25 | 0.03-6.94 | 21 | 1.03 | 0.64-1.58 |
| Stomach | 0 | 0 | NA | 62 | 1.54† | 1.18-1.98 |
| Anus | 14 | 68.34† | 37.36-115 | 17 | 2.09† | 1.22-3.34 |
| Liver | <5 | 2.45 | 0.51-7.16 | 73 | 1.83† | 1.43-2.30 |
| Cervix uteri | <5 | 7.84 | 0.20-43.69 | 8 | 0.80 | 0.35-1.58 |
NA, not applicable.
Includes HIV/AIDS status NA, reflecting individual SEER registry practices.
Indicates 95% CI excludes 1.00, corresponding to 2-sided P < .05.
Additional analyses of the most commonly occurring second cancers (liver and stomach cancers) evaluated SIR patterns by patient subgroup (Tables 4 and 5). In general, SIRs were largely consistent across age at first primary NHL diagnosis, sex, time since first primary NHL diagnosis, stage of first primary NHL, and initial treatment of first primary NHL, but there were a few exceptions. For stomach cancer (Table 4), the only indication of borderline heterogeneity was by stage for MZL survivors (early stage: SIR, 3.79; advanced stage: SIR, 2.00; Pheterogeneity = .07); notably, a majority of early-stage MZL cases (n = 21 of 31) were gastric MZL. For liver cancer (Table 5), the SIR among DLBCL survivors diagnosed before age 60 years was higher than that among patients diagnosed with DLBCL at older ages (SIR, 2.89 vs 1.21; Pheterogeneity < .01) and during the first 5 years after DLBCL compared with later periods (SIR, 2.23 vs 1.32; Pheterogeneity < .01). Liver cancer SIRs after DLBCL and MZL were significantly elevated only among males, but differences by sex were not statistically significant (DLBCL: SIR, 1.96 vs 1.48; Pheterogeneity > .50; MZL: SIR, 2.32 vs 1.14; Pheterogeneity = .16). Additionally, although there was no overall increase in liver cancer after FL, the SIR was significantly elevated highest among FL survivors who received initial chemotherapy and radiotherapy (SIR, 2.53; Pheterogeneity = .02), based on 7 observed cases. Across NHL subtypes, there was no evidence of heterogeneity in the SIRs for stomach or liver cancers by calendar year period of NHL diagnosis (data not shown).
Risk for developing second primary stomach cancer by age, sex, latency, and stage among adult 1-y NHL survivors, 17 SEER registry areas, 2000 to 2014
| Characteristic | CLL/SLL | DLBCL | FL | MZL | ||||||||
|---|---|---|---|---|---|---|---|---|---|---|---|---|
| Obs | SIR* | 95% CI* | Obs | SIR* | 95% CI* | Obs | SIR* | 95% CI* | Obs | SIR* | 95% CI* | |
| Age at first primary NHL, y | ||||||||||||
| <60 | <5 | 0.43 | 0.12-1.11 | 17 | 1.75† | 1.02-2.80 | <5 | 0.23† | 0.03-0.83 | 13 | 3.83† | 2.04-6.56 |
| ≥60 | 35 | 0.76 | 0.53-1.06 | 45 | 1.44† | 1.05-1.93 | 24 | 1.03 | 0.66-1.54 | 31 | 2.50† | 1.70-3.54 |
| Pheterogeneity‡ | .26 | .51 | .01 | .22 | ||||||||
| Sex | ||||||||||||
| Male | 30 | 0.74 | 0.50-1.05 | 38 | 1.37 | 0.97-1.88 | 16 | 0.77 | 0.44-1.25 | 27 | 2.80† | 1.84-4.07 |
| Female | 9 | 0.62 | 0.28-1.17 | 24 | 1.82† | 1.16-2.70 | 10 | 0.90 | 0.43-1.65 | 17 | 2.76† | 1.61-4.42 |
| Pheterogeneity‡ | .60 | .27 | .78 | .98 | ||||||||
| Latency, y | ||||||||||||
| <5 | 26 | 0.75 | 0.49-1.10 | 35 | 1.42 | 0.99-1.98 | 16 | 0.88 | 0.50-1.43 | 25 | 2.62† | 1.70-3.87 |
| ≥5 | 13 | 0.63 | 0.34-1.08 | 27 | 1.65† | 1.09-2.41 | 10 | 0.73 | 0.35-1.34 | 19 | 3.03† | 1.82-4.73 |
| Pheterogeneity‡ | .73 | .64 | .90 | .78 | ||||||||
| Stage of first primary NHL§ | ||||||||||||
| Early | 30 | 0.74 | 0.50-1.06 | 30 | 1.34 | 0.91-1.92 | 13 | 0.88 | 0.47-1.51 | 31 | 3.79† | 2.58-5.39 |
| Advanced | 9 | 0.60 | 0.27-1.14 | 28 | 1.74† | 1.16-2.52 | 11 | 0.75 | 0.38-1.35 | 10 | 2.00 | 0.96-3.68 |
| Unknown | 0 | 0 | NA | <5 | 1.58 | 0.43-4.05 | <5 | 0.78 | 0.09-2.80 | <5 | 1.13 | 0.23-3.31 |
| Pheterogeneity‡ | .60 | .32 | .78 | .07 | ||||||||
| Initial NHL treatment | ||||||||||||
| CT and RT | 0 | 0 | NA | 14 | 1.38 | 0.76-2.32 | <5 | 1.51 | 0.41-3.88 | 5 | 6.64† | 2.15-15.48 |
| CT, no known RT | 6 | 0.57 | 0.21-1.23 | 37 | 1.53† | 1.07-2.10 | 11 | 0.75 | 0.37-1.34 | 13 | 3.14† | 1.67-5.37 |
| RT, no known CT | 0 | 0 | NA | <5 | 3.22 | 0.66-9.41 | <5 | 0.90 | 0.19-2.63 | 7 | 2.26 | 0.91-4.65 |
| No known CT or RT | 33 | 0.75 | 0.52-1.05 | 8 | 1.42 | 0.61-2.81 | 8 | 0.71 | 0.31-1.40 | 19 | 2.43† | 1.46-3.79 |
| Pheterogeneity‡ | .73 | .68 | .64 | .30 | ||||||||
SIRs and exact Poisson-based 95% CIs compared number of observed cases with that expected in general population (additional details provided in “Methods”).
Indicates 95% CI excludes 1.00, corresponding to 2-sided P < .05.
P values to test differences in SIRs were computed using likelihood ratio test derived from Poisson regression models stratified by age at first primary NHL, sex, and latency, with log of expected numbers of cases included as offset. Exact numbers of cases are not reported for categories with <5 observed cases to maintain patient confidentiality. All statistical tests were 2 sided.
Early stage: stages I and II for DLBCL, FL, and MZL and no known initial treatment of CLL; advanced stage: stages III and IV for DLBCL, FL, and MZL and any initial treatment of CLL.
Risk for developing second primary liver cancer by age, sex, latency, and stage among adult 1-y NHL survivors, 17 SEER registry areas, 2000 to 2014
| Characteristic | CLL/SLL | DLBCL | FL | MZL | ||||||||
|---|---|---|---|---|---|---|---|---|---|---|---|---|
| Obs | SIR* | 95% CI* | Obs | SIR* | 95% CI* | Obs | SIR* | 95% CI* | Obs | SIR* | 95% CI* | |
| Age at first primary NHL, y | ||||||||||||
| <60 | 12 | 0.78 | 0.40-1.36 | 45 | 2.89† | 2.11-3.87 | 13 | 0.96 | 0.51-1.64 | 14 | 2.68† | 1.47-4.50 |
| ≥60 | 42 | 1.15 | 0.83-1.55 | 31 | 1.21 | 0.82-1.72 | 19 | 1.00 | 0.60-1.56 | 16 | 1.61 | 0.92-2.61 |
| Pheterogeneity‡ | .25 | <.01 | >.50 | .24 | ||||||||
| Sex | ||||||||||||
| Male | 41 | 0.97 | 0.70-1.32 | 62 | 1.96† | 1.50-2.51 | 22 | 0.90 | 0.56-1.36 | 25 | 2.32† | 1.50-3.43 |
| Female | 13 | 1.32 | 0.70-2.25 | 14 | 1.48 | 0.81-2.49 | 10 | 1.24 | 0.59-2.28 | 5 | 1.14 | 0.37-2.65 |
| Pheterogeneity‡ | .46 | >.50 | .39 | .16 | ||||||||
| Latency, y | ||||||||||||
| <5 | 32 | 1.01 | 0.69-1.42 | 53 | 2.23† | 1.67-2.92 | 24 | 1.35 | 0.86-2.00 | 17 | 1.92† | 1.12-3.07 |
| ≥5 | 22 | 1.09 | 0.68-1.65 | 23 | 1.32 | 0.84-1.99 | 8 | 0.54 | 0.24-1.07 | 13 | 2.06† | 1.10-3.53 |
| Pheterogeneity‡ | >.50 | <.01 | .02 | >.50 | ||||||||
| Stage of first primary NHL§ | ||||||||||||
| Early | 41 | 1.09 | 0.78-1.48 | 37 | 1.66† | 1.17-2.29 | 12 | 0.82 | 0.42-1.43 | 12 | 1.55 | 0.80-2.71 |
| Advanced | 13 | 0.90 | 0.48-1.54 | 33 | 2.01† | 1.38-2.82 | 18 | 1.17 | 0.69-1.85 | 11 | 2.27† | 1.13-4.06 |
| Unknown | 0 | 0 | NA | 6 | 2.46 | 0.90-5.35 | <5 | 0.79 | 0.10-2.86 | 7 | 2.73† | 1.10-5.61 |
| Pheterogeneity‡ | >.50 | >.50 | .36 | .40 | ||||||||
| Initial NHL treatment | ||||||||||||
| CT and RT | 0 | 0 | NA | 13 | 1.26 | 0.67-2.16 | 7 | 2.53† | 1.02-5.21 | <5 | 2.60 | 0.32-9.40 |
| CT, no known RT | 11 | 1.06 | 0.53-1.90 | 52 | 2.12† | 1.58-2.78 | 18 | 1.17 | 0.69-1.85 | 8 | 1.99 | 0.86-3.93 |
| RT, no known CT | 0 | 0 | NA | <5 | 2.33 | 0.28-8.43 | <5 | 0.30 | 0.01-1.65 | <5 | 0.67 | 0.08-2.40 |
| No known CT or RT | 43 | 1.05 | 0.76-1.41 | 9 | 1.67 | 0.76-3.17 | 6 | 0.55 | 0.20-1.19 | 18 | 2.44† | 1.45-3.86 |
| Pheterogeneity‡ | .72 | .36 | .02 | .22 | ||||||||
SIRs and exact Poisson-based 95% CIs compared number of observed cases with that expected in general population (additional details provided in “Methods”).
Indicates 95% CI excludes 1.00, corresponding to 2-sided P < .05.
P values to test differences in SIRs were computed using likelihood ratio test derived from Poisson regression models stratified by age at first primary NHL, sex, and latency, with log of expected numbers of cases included as offset. Exact numbers of cases are not reported for categories with <5 observed cases to maintain patient confidentiality. All statistical tests were 2 sided.
Early stage: stages I and II for DLBCL, FL, and MZL and no known initial treatment of CLL; advanced stage: stages III and IV for DLBCL, FL, and MZL and any initial treatment of CLL.
Discussion
In this large, population-based study, we show for the first time that among NHL survivors, the risk of developing subsequent infection-related malignancies differs by both NHL subtype and second primary cancer type. The increased risks for stomach, liver, and anal cancers observed among survivors of DLBCL and MZL but not CLL/SLL or FL suggest that shared infectious risk factors for these cancers have implications for subsequent cancer risks. In contrast, cervical and oropharyngeal/tonsil cancer risks were not elevated after any NHL subtype.
Our observation that stomach cancer risk was uniquely elevated after gastric DLBCL and MZL is consistent with the shared etiology of H pylori in gastric cancer and gastric DLBCL and MZL,1,15-23 potentially because of chronic inflammation caused by H pylori infection.24 Similarly, the chronic inflammation and immune activation associated with HCV and possibly HBV may contribute to the shared risk of liver cancer, DLBCL, and MZL.2,25,26 Finally, the strong association of DLBCL and anal cancer, particularly among DLBCL survivors with known HIV/AIDS, is likely a result of immunosuppression and the high prevalence of anal HPV infection (a strong risk factor for anal cancer) among HIV-infected people.27,28
The lack of elevated risks for liver, stomach, and anal cancers among survivors of CLL/SLL and FL is consistent with null or weak associations of these subtypes with the relevant infections.29-32 Previous studies have reported conflicting findings regarding excess risks of liver, stomach, and anal cancers after NHL, which may be due to lack of investigation of risks by specific NHL subtype, smaller study populations, or differences in prevalence of infection in the populations.4,33-36
Because we lacked data on specific infectious agents (HCV, H pylori) other than HIV, our results require replication in studies with detailed clinical information. Nevertheless, our findings may be informative for evaluation and management of NHL survivors. Treatment of HCV in MZL or H pylori in gastric MZL can lead to remission of MZL,20,37-39 and testing and treating these patients could reduce risks of subsequent liver and gastric cancers. Additionally, DLBCL is an AIDS-associated lymphoma,1,40 which supports testing for HIV in all patients with HIV risk factors and/or features of DLBCL that suggest an association with HIV.41 Whereas current guidelines from the National Comprehensive Cancer Network include recommendations for treating particular infections before starting immunosuppressive therapy/chemotherapy after NHL diagnosis, no clear recommendations exist for long-term second cancer surveillance among NHL survivors with these infections.42 Additionally, our findings emphasize the importance of screening for infections, because recent data suggest that an unexpected number of patients with newly diagnosed cancer are unaware that they are infected with HBV or HCV.43
HPV is associated with anal, cervical, and oropharyngeal/tonsil cancers7 but has not been linked to risk of any NHL subtypes.2,10,44 Consistent with these results, we found no increased risk of oropharyngeal/tonsil or cervical cancers. The elevated risk for anal cancer after DLBCL and MZL may be explained by the striking association of HIV with anal cancer, likely resulting from immunosuppression and anal HPV infection,30 as described for DLBCL, although we did not have the sample size to assess second cancer risks among reported MZL survivors by reported HIV/AIDS status. The lack of increased risk of cervical cancer after any NHL subtype is consistent with previous research demonstrating no excess risk of cervical cancer after NHL.33-35 Specific literature on squamous cell cancers of the oropharynx/tonsil after NHL is lacking.
The use of large-scale population-based registry data enabled us to investigate the risk of infection-related cancers developing among survivors of specific types of NHL. By restricting analyses to survivors diagnosed after 2000, we leveraged the current World Health Organization classification for hematologic malignancies, allowing for reliable classification of NHL subtypes. Despite these strengths, several limitations of this study should be considered in the interpretation of the results. Most importantly, individual infection status data are lacking, and therefore, we could not determine specifically the extent to which these infections contributed to the elevated SIRs. Additionally, the immunosuppressive effects of chemotherapy45 and immunotherapy, particularly rituximab,46 may affect viral reactivation, and we did not have data on specific treatment regimens. Furthermore, SEER does not collect information on treatment of progression/recurrence of initial cancers, which could affect subsequent cancer development. Therefore, caution is warranted in the interpretation of our findings, and the results should be replicated in studies with treatment and infection status data. Because of small sample sizes in some patient subgroups and multiple comparisons, some observed associations may have arisen as a result of chance, and we were unable to investigate risk of second cancers after less common NHL subtypes that might be associated with infections, such as T-cell lymphomas or Burkitt lymphoma, or of less common second primary cancers, such as Kaposi sarcoma. Additionally, diagnostic bias in NHL survivors may exist, because these patients likely undergo more testing and imaging than the general population. We also lacked sufficient follow-up to evaluate subsequent cancer risks beyond 10 years, which could account for some differences in our findings compared with previous studies.
In conclusion, we observed substantial heterogeneity in the risk of developing infection-related solid cancers both within and across survivors of specific NHL subtypes. The patterns of association suggest that history of certain infections may not only contribute to the development of specific NHLs but also affect the long-term health of NHL survivors. Additional studies with detailed patient medical and treatment history and laboratory data are needed to replicate these results. These findings may support evaluation of NHL survivors for selected infections and subsequent clinical management guided by those results.
The full-text version of this article contains a data supplement.
Acknowledgments
This research was supported by the Intramural Program of the National Cancer Institute, National Institutes of Health.
The opinions and information in this article are those of the authors and do not represent the views and/or policies of the US Food and Drug Administration.
Authorship
Contribution: M.M.H., S.J.S., R.E.C., and L.M.M. designed the study; M.M.H., S.J.S., and L.M.M. analyzed the data and wrote the paper; and all authors critically reviewed and approved the manuscript and shared final responsibility for the decision to submit.
Conflict-of-interest disclosure: The authors declare no competing financial interests.
Correspondence: Lindsay M. Morton, Radiation Epidemiology Branch, Division of Cancer Epidemiology and Genetics, National Cancer Institute, 9609 Medical Center Dr, Room 7E-454/MSC 9778, Bethesda, MD 20892-9778; e-mail: mortonli@mail.nih.gov.

