

Key Points
Acquisition of del(17p) by fluorescence in situ hybridization is associated with reduced OS in patients with MM.
High plasma cell proliferative rate predicted reduced OS from detection of del(17p).

Abstract
The high-risk abnormality del(17p) can be detected by fluorescence in situ hybridization on malignant plasma cells (PCs) and has an adverse prognostic impact in patients with multiple myeloma (MM). Patients with del(17p) have reduced overall survival (OS). Patients who acquire del(17p) later during the disease course are not well described. The disease characteristics at diagnosis predicting for acquired del(17p) and its overall impact on patient survival is not known. We compared 76 patients with MM who were negative for del(17p) at diagnosis and acquired it later with 152 control MM patients who did not acquire del(17p) at a comparable time point. Patients acquired del(17p) at a median of 35.6 months (range, 4.6-116.1 months) from diagnosis of MM after a median of 2 lines of therapy (range, 1-10 lines of therapy). When compared with controls, patients with acquired del(17p) had shorter median progression-free survival (PFS) (30.1 vs 23.0 months; P = .032) and OS (106.1 vs 68.2 months; P < .001) from diagnosis. After the detection of del(17p), the median PFS was 5.4 months and the median OS was 18.1 months. High lactate dehydrogenase level (odds ratio [OR], 3.69; 95% confidence interval [CI], 1.11-12.24) and presence of t(4;14) (OR, 2.66; 95% CI, 1.09-6.48) or any high-risk translocation (OR, 2.23; 95% CI, 1.00-4.95) at diagnosis predicted acquisition of del(17p). High PC proliferative rate predicted shorter OS from detection of del(17p) (hazard ratio, 2.28; 95% CI, 1.31-3.96; P = .004). Our study shows that acquisition of del(17p) is an important molecular event associated with reduction in OS in MM. Certain baseline factors may predict acquisition of del(17p). This needs validation in prospective data sets.
Introduction
Multiple myeloma (MM) is the second most common hematologic malignancy and is expected to cause ∼13 000 new cases and 30 000 deaths in 2018.1 The patients with MM constitute a heterogeneous mixture, and different subpopulations have outcomes driven by well-characterized genetic abnormalities.2 del(17p) detected by interphase fluorescence in situ hybridization (FISH) of bone marrow plasma cells (PCs) is a secondary cytogenetic abnormality (acquired later in the course of clonal evolution). Its adverse prognostic impact in patients with MM3 is mainly a result of the loss of TP53 function.4,5
del(17p) is detected in ∼10% patients with newly diagnosed MM (NDMM). The impact of del(17p) in patients with NDMM is clearly defined.6,7 Despite improvements in overall survival (OS) in patients with MM as a result of advances in understanding the disease biology and resultant development of novel therapeutic approaches, MM remains incurable.8,9 The median OS in patients who are refractory to first-line therapies, including proteasome inhibitors (PIs) and immunomodulatory drugs (IMiDs), and who are exposed to an alkylating agent is only 13 months.10 Emergence of new clones with acquisition of new genetic abnormalities and Darwinian selection under pressure of therapy result in high-risk relapsed and/or refractory MM (RRMM).11 By using FISH, del(17p) is detected in about 10% of patients with RRMM.12-14 Acquisition of del(17p) on follow-up is probably a rare event, as was recently shown in 2 (∼3.8%) of 52 patients who underwent sequential testing at diagnosis and at first relapse.15 Serial testing has shown that del(17p) is associated with acquisition of TP53 mutations.16 The outcomes of patients who acquire del(17p) during follow-up are not known. We aimed to assess the impact of acquired del(17p) on survival and define their outcomes by comparing them with controls who did not acquire del(17p).
Patients and methods
We reviewed the dysproteinemia database at Mayo Clinic (Rochester, MN) to identify 80 patients with MM and acquired del(17p), defined as being negative for del(17p) on the first FISH test and having del(17p) detected on a follow-up FISH test. Of these, 76 patients had RRMM, whereas in 2 patients, del(17p) was detected before stem cell transplant (SCT) after they had attained a response to a previous line of therapy. In 2 other patients, del(17p) was detected during assessment for stem cell harvest after a partial response was attained following induction therapy. After excluding these 4 patients, 76 patients were included in the analysis. All patients had FISH testing between 2004 and August 2016. Fifty-seven patients (75%) had their first FISH test within 6 months of MM diagnosis; 19 patients (25%) had their first FISH test more than 6 months after MM diagnosis. The study was performed with approval of the Mayo Clinic Institutional Review Board and was conducted according to the principles of the Declarations of Helsinki.
del(17p) included interstitial deletion involving the short arm of chromosome 17 (del(17p13.1)) and/or monosomy 17. We identified 2 control patients for each case who were diagnosed during the same time period but did not demonstrate del(17p) at any time during follow-up. The cases and controls were not matched for potential predictors of acquisition of del(17p) including age, cytogenetic abnormalities, or initial treatment. Control patients (n = 152) had at least 2 FISH tests negative for del(17p), the second test being at a comparable time point or later relative to timing of detection of del(17p) in the respective case. The second FISH test was performed at relapse. We also compared survival outcomes in the group with acquired del(17p) with a cohort of 310 patients with del(17p) detected at diagnosis [de novo del(17p)].
We defined responses to treatment using the 2016 Revised International Myeloma Working Group Criteria.17 Progression-free survival (PFS) was defined as the duration between initiation of therapy and progression or death, and OS was defined as the duration from MM diagnosis or detection of del(17p) to death as a result of any cause.18 Number of lines of therapy were defined according to accepted guidelines.19 Early SCT was defined as SCT within 1 year of starting treatment for MM.
FISH testing and estimation of PC proliferative rate
Bone marrow aspirate samples enriched for mononuclear cells by the Ficoll method were used for preparing cytospin slides. Cytoplasmic immunoglobulin staining was used to identify PCs, and the FISH analysis was performed at our institution as described previously using the following probes: 3cen (D3Z1), 7cen (D7Z1), 9cen (D9Z1), 15cen (D15Z4), 11q13 (CCND1-XT), 13q14 (RB1), 13q34 (LAMP1), 17p13.1 (p53), 17cen (D17Z1), 14q32 (IGH-XT), 14q32 (3′IGH,5′IGH), 4p16.3 (FGFR3), 16q23 (c-MAF), 6p21 (CCND3), 20q12 (MAFB), 1p32 (TP73), and 1q22 (1Q22).20 The cut points for a positive test were 7% for del(17p13.1) and 9% for monosomy 17. Relative loss of del(17p) was defined as del(17p) with trisomy/tetrasomy involving chromosome 17. High-risk translocations (HRTs) included t(4;14), t(14;16), and t(14;20). Hyperdiploidy was defined as the presence of trisomy and/or tetrasomy of 2 or more odd-numbered chromosomes.
PC proliferative rate was defined as the proportion of clonal PCs actively proliferating in the S-phase of the cell cycle. Slide technique using the deoxyuridine method (called PC labeling index [PCLI]) was used for this until May 2012.21 After that, PCLI was supplanted by flow cytometric technique. Briefly, this involves identifying immunophenotypically atypical PCs and estimating their DNA content. By appropriate gating, the proportion of atypical PCs in the S-phase was estimated. The details of the technique are summarized in a recent publication.22 High PC proliferative rate was defined by a PCLI of ≥1.5% or a PC S-phase fraction of ≥3% in the flow cytometric technique.23,24
Statistical analysis
Categorical variables were summarized as proportions and compared between groups using Fisher’s exact test. Continuous variables were summarized as medians and compared between groups using the nonparametric Mann-Whitney U test. We estimated PFS and OS using the Kaplan-Meier method, and we used the log-rank test to compare them between groups. We used Cox proportional hazards model to identify factors at detection of del(17p) affecting PFS and OS. Odds ratios (ORs) were calculated to identify factors at MM diagnosis associated with later detection of del(17p) by FISH. A 2-tailed P < .05 was considered significant for all statistical tests. We used JMP Pro 14.0 software (SAS Institute Inc., Cary, NC) for statistical analysis.
Results
The characteristics of 76 patients with acquired del(17p) at initial diagnosis of MM, 152 control patients at diagnosis, and the cohort with acquired del(17p) at detection of del(17p) are shown in Table 1. Patients with acquired del(17p) and controls were similar with respect to baseline characteristics and initial treatment, except for relatively low hemoglobin at diagnosis in cases (median, 10.8 g/dL vs 11.3 g/dL; P = .035), higher occurrence of t(4;14) among cases (15.8% vs 6.6%; P = .033) and higher proportion of patients with elevated lactate dehydrogenase (LDH) among evaluable cases (13.7% [7 of 51] vs 4.1% [5 of 121]; P = .043) relative to controls. Details of treatment and response are available in supplemental Tables 1 and 2. The characteristics of the de novo del(17p) group have been published elsewhere.25 Briefly, 47.4% of patients were of age 65 years or older, 36.7% of patients had International Staging System (ISS) stage III disease, 23.8% of patients had elevated LDH, and 24.4% of patients had concurrent HRTs. More than 95% patients in this cohort were treated initially with novel agents (PI + IMiD, 38.6%; PI, 32.5%; and IMiD, 25.6%). Fifty-six percent of patients received an SCT at any time during their disease course.
Characteristicsof patients with acquired del(17p) at MM diagnosisand at detection of del(17p), and control patients at MM diagnosis
| Characteristic | No. of patients with available data in the 3 groups | Acquired del(17p) at MM diagnosis (n = 76) | Control group at MM diagnosis (n = 152) | Acquired del(17p) at detection of del(17p) (n = 76) | P* for acquired del(17p) vs controls at MM diagnosis |
|---|---|---|---|---|---|
| Age, y | |||||
| Median (range) | 61.9 (42.4-80.9) | 61.4 (28.8-84.7) | 65.6 (44.6-82.2) | .972 | |
| ≥65, n (%) | 28 (36.8) | 51 (33.5) | 39 (51.3) | .659 | |
| Female sex, n (%) | 30 (39.5) | 63 (41.4) | 30 (39.5) | .886 | |
| Median hemoglobin (range), g/dL | 69/150/75 | 10.8 (5.4-14.5) | 11.3 (7.1-16.7) | 10.4 (7.2-14.7) | .035 |
| Median calcium (range), mg/dL | 60/146/73 | 9.6 (7.2-15.4) | 9.6 (7.9-15) | 9.5 (7.1-11.5) | .598 |
| Creatinine >2 mg/dL, n (%) | 64/145/74 | 8 (12.5) | 10 (6.9) | 4 (5.4) | .191 |
| Median bone marrow plasma cell percentage (range) | 70/150/75 | 40 (4-93) | 50 (3-98) | 40 (2-100) | .384 |
| High plasma cell proliferative rate, n (%) | 45/106/65 | 14 (31.1) | 22 (20.7) | 32 (49.2) | .211 |
| Median percentage of plasma cells with del(17p) (range) | —/—/71 | — | — | 89 (9-100) | |
| Median M-protein level (range), g/dL | 65/146/74 | 2.8 (0-12.3) | 2.7 (0-6.8) | 1.8 (0-6.4) | .999 |
| M-protein isotype, n (%) | 76/152/76 | ||||
| IgG | 46 (60.5) | 88 (57.9) | 46 (60.5) | .097 | |
| IgA | 21 (27.6) | 36 (23.7) | 21 (27.6) | ||
| Light chain | 5 (6.6) | 25 (16.4) | 5 (6.6) | ||
| Others | 4 (5.3) | 3 (2.0) | 4 (5.3) | ||
| ISS I/II vs III, n (%) | 56/136/56 | 42 (75.0)/ 14 (25.0) | 110 (80.9)/ 26 (19.1) | 43 (76.8)/ 13 (23.2) | .434 |
| Increased LDH, n (%) | 51/121/61 | 7 (13.7) | 5 (4.1) | 21 (33.4) | .043 |
| Cytogenetic abnormalities at MM diagnosis for cases and controls and at acquisition of del (17p), n (%) | |||||
| High-risk chromosomal translocation | 14 (18.4) | 14 (9.2) | 14 (18.4) | .055 | |
| t(4;14) | 12 (15.8) | 10 (6.6) | 12 (15.8) | .033 | |
| t(6;14)† | 0 (0) | 0 (0) | 0 (0) | — | |
| t(11;14) | 15 (19.7) | 37 (24.3) | 15 (19.7) | .505 | |
| t(14;16) | 2 (2.6) | 3 (2.0) | 2 (2.6) | 1.000 | |
| t(14;20)† | 0 (0) | 1 (1.4) | 0 (0) | 1.000 | |
| Hyperdiploidy (trisomy or tetrasomy involving ≥2 odd-numbered chromosomes) | 32 (42.1) | 69 (45.4) | 41 (53.9) | .673 | |
| del(13q) and/or monosomy 13 | 30 (39.5) | 67 (44.1) | 45 (59.2) | .570 | |
| del(13q) | 3 (3.9) | 8 (5.3) | 5 (6.6) | .756 | |
| Monosomy 13 | 27 (35.5) | 59 (38.8) | 41 (53.9) | .666 | |
| (1q22) gain‡ | 0 (0) | 1 (12.5) | 4 (28.6) | 1.000 | |
| del(1p32)‡ | 0 (0) | 0 (0) | 0 (0) | — |
IgA, immunoglobulin A; IgG, immunoglobulin G.
P for Mann-Whitney U test for continuous variables and Fisher’s exact test for categorical variables.
Calculation is limited to cases and controls who had FISH testing after May 2009 (n = 37 for cases at diagnosis, n = 69 for controls at diagnosis, and n = 68 for cases at del(17p) detection) when probes for these abnormalities were introduced.
Calculation limited to cases and controls who had FISH testing after August 2014 (n = 4 for cases at diagnosis, n = 8 for controls at diagnosis, and n = 14 for cases at del(17p) detection) when probes for 1q gain and del(1p) were introduced.
Comparison of survival outcomes
Comparing survival outcomes from initial diagnosis, PFS was 23.0 months (95% CI, 20.2-27.8 months) in the acquired del(17p) group and 30.1 months (95% CI, 26.0-33.9 months) in the control group (P = .032). The OS was 68.2 months (95% CI, 50.8-74.8 months) in the acquired del(17p) group and 106.1 months (95% CI, 101.6-119.4 months) in the control group (P < .001). The results were also valid in subgroups on the basis of prognostic factors except HRTs (Table 2). PFS in patients with de novo del(17p) was similar (21.2 months; 95% CI, 17.8-23.9 months; P = .887), and OS trended toward being shorter (47.3 months; 95% CI, 42.7-55.9 months; P = .063) when compared with the acquired del(17p) group. The comparison of PFS and OS for the 3 groups is shown in Figure 1. OS was 18.1 months (95% CI, 11.9-25 months) landmarked from detection of del(17p) for cases and was 56.2 months (95% CI, 44.4-79.7 months) at a corresponding time point for controls (P < .001) (supplemental Figure 2; supplemental Table 3).
Subgroup analysis for OS from diagnosis in patients with acquired del(17p) and controls based on prognostic factors at diagnosis and therapy
| Subgroup | No. of patients with available data in the subgroups | Acquired del(17p) (n = 76) | Controls (n = 152) | P* |
|---|---|---|---|---|
| Age, y | ||||
| <65 | 48 vs 101 | 72.3 (49.6-99.0) | 106.1 (98.5-127.8) | .002 |
| ≥65 | 28 vs 51 | 58.2 (44.1-71.3) | 105.9 (68.6-138.8) | <.001 |
| Translocation | ||||
| High risk | 14 vs 14 | 56.8 (24.0-119.0) | 98.3 (60.5-111.8) | .419 |
| No high risk | 62 vs 138 | 68.9 (50.8-74.8) | 111.7 (103.4-129.3) | <.001 |
| ISS | ||||
| I/II | 42 vs 110 | 71.3 (50.8-75.4) | 106.1 (101.6-129.3) | <.001 |
| III | 14 vs 26 | 44.4 (13.8-103.1) | 104.8 (60.7-111.8) | .036 |
| LDH | ||||
| Low | 44 vs 116 | 63.8 (44.6-99.0) | 105.9 (98.5-119.4) | .004 |
| High | 7 vs 5 | 55.5 (23.2-86.4) | 100.9 (80.6-NR) | .011 |
| PC proliferative rate | ||||
| Low | 31 vs 84 | 74.6 (58.3-99.0) | 106.1 (98.3-137.8) | .025 |
| High | 14 vs 24 | 42.2 (24.0-103.1) | 103.4 (67.1-NR) | .031 |
| PI-containing induction | 21 vs 37 | 34.5 (24.0-50.8) | 104.8 (70.2-137.8) | <.001 |
| Others | 55 vs 115 | 74.6 (63.8-96.5) | 106.1 (98.5-127.8) | .003 |
NR, not reached.
P for log-rank test for Kaplan-Meier analysis.
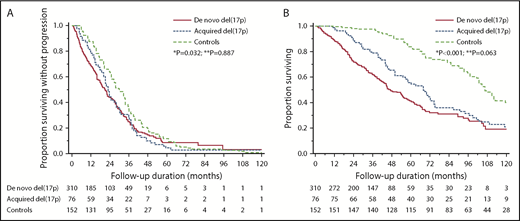
Survival outcomes in patients with de novo del(17p), acquired del(17p), and controls. (A) Comparison of PFS in the 3 groups: 21.2 months (95% CI, 17.8-23.9) vs 23.0 months (95% CI, 20.2-27.8) vs 30.1 months (95% CI, 26.0-33.9). *P = .032 for acquired del(17p) vs controls; **P = .887 for acquired del(17p) vs de novo del(17p). (B) Comparison of OS from diagnosis in the 3 groups: 47.3 months (95% CI, 42.7-55.9) vs 68.2 months (95% CI, 50.8-74.8) vs 106.1 months (95%CI, 101.6-119.4). *P < .001 for acquired del(17p) vs controls; **P = .063 for acquired del(17p) vs de novo del(17p).
Survival outcomes in patients with de novo del(17p), acquired del(17p), and controls. (A) Comparison of PFS in the 3 groups: 21.2 months (95% CI, 17.8-23.9) vs 23.0 months (95% CI, 20.2-27.8) vs 30.1 months (95% CI, 26.0-33.9). *P = .032 for acquired del(17p) vs controls; **P = .887 for acquired del(17p) vs de novo del(17p). (B) Comparison of OS from diagnosis in the 3 groups: 47.3 months (95% CI, 42.7-55.9) vs 68.2 months (95% CI, 50.8-74.8) vs 106.1 months (95%CI, 101.6-119.4). *P < .001 for acquired del(17p) vs controls; **P = .063 for acquired del(17p) vs de novo del(17p).
Characteristics of patients at detection of del(17p)
The median time from diagnosis of MM to detection of del(17p) in the acquired del(17p) cohort was 35.6 months (range, 4.8-116.1 months). Patients had received a median of 2 prior lines of therapy (range, 1-10 prior lines of therapy) before detection of del(17p). del(17p) was detected in a median of 89% (range, 9%-100%) of PCs tested by FISH. Fifty-seven patients (67.1%) were exposed to a PI, and 33 patients (43.4%) were refractory to a PI; 70 patients (92.1%) were exposed to an IMiD, and 57 patients (75.0%) were refractory to an IMiD (majority being lenalidomide and/or pomalidomide); and 60 patients (78.9%) were exposed to an alkylating agent and 25 patients (32.9%) were refractory to an alkylating agent. Thirty patients (39.5%) were PI and IMiD-refractory.
Seventy patients (86.8%) had del(17p13.1). Five patients (6.6%) had monosomy 17. One patient (1.3%) had both del(17p13.1) and monosomy 17. Four patients (5.3%) had relative loss of 17p. HRTs were present in 14 patients (18.4%). Compared with initial FISH, the proportion of patients with hyperdiploidy increased at detection of del(17p) (42.1% to 59.2%; P < .001). A similar change was seen with monosomy 13 (35.5% to 53.9%; P < .001), whereas no change was seen with del(13q) (3.9% and 6.6%; P = .187). Even though 4 patients (28.6%) had 1q22 gain at follow-up, none of those patients were tested for it initially, so we cannot determine whether it was newly acquired.
Treatment and survival outcomes after detection of del(17p)
All patients received therapy after detection of del(17p). IMiD-based and PI-based regimens were used in 22 patients (28.9%) each, and a PI + IMiD-based regimen was used in 15 patients (19.7%). Monoclonal antibodies were used in 4 patients (5.3%). Seven patients (9.2%) proceeded directly to SCT without additional therapy, and 6 patients (7.9%) received other therapies. Overall, SCT was part of the next line of treatment in 14 patients (18.4%) (1 of them underwent allogeneic SCT). Details of treatment are available in supplemental Table 4. Among 67 patients who were evaluable for response, stringent complete response was attained in 3 patients (4.5%), complete response in 3 (4.5%), very good partial response in 16 (23.9%), and partial response in 9 (13.4%), giving an overall response rate of 46.3%. A minimal response was seen in 3 patients (4.5%). Twenty patients (29.8%) showed stable disease, and 13 (19.4%) developed progressive disease. The median PFS from the start of the next line of therapy was 5.4 months (95% CI, 2.7-7.7 months). The median OS from detection of del(17p) was 18.1 months (95% CI, 11.9-25.0 months) (supplemental Figure 1).
Predictors of survival after detection of del(17p)
To identify factors affecting PFS and OS from detection of del(17p), we used age ≥65 vs <65 years, serum creatinine >2 vs ≤2 mg/dL, bone marrow PC percentage ≥50 vs <50, ISS stage III vs I or II, increased vs normal LDH, presence vs absence of an HRT, presence vs absence of monosomy 13, presence vs absence of hyperdiploidy, high vs low PC proliferative rate, prior PI and IMiD refractoriness, and different cutoffs for proportion of PCs with del(17p) (20%, 30%, 40%, 50%, and 60%) in the Cox proportional hazards model (Table 3). After univariable analysis, ISS stage III disease, high PC proliferative rate, PI and IMiD refractoriness, and presence of del(17p) in ≥30%, ≥40%, and >50% PCs, had P < .1 for predicting shorter PFS and were included in multivariable analysis. Using multivariable Cox proportional model with step-wise backward elimination, the presence of del(17p) in ≥40% of PCs predicted shorter PFS with a hazard ratio of 2.21 (95% CI, 1.21-4.01; P = .009). In a similar analysis, ISS III stage, increased LDH, high PC proliferative rate, and PI and IMiD refractoriness were included in the multivariable model to determine predictors of shorter OS. A higher PC proliferative rate alone predicted shorter OS with a hazard ratio of 2.28 (95% CI, 1.31-3.96; P = .004). The median PFS was 3.5 months (95% CI, 1.9-5.7 months) in patients with del(17p) involving ≥40% PCs and 11.3 months (95% CI, 4.4-15.6 months) in those with del(17p) involving <40% PCs (P = .008) (Figure 2A). The median OS was 8.9 months (95% CI, 4.9-17.1 months) in patients with high PC proliferative rate at detection of del(17p) and 35.6 months (95% CI, 18.2-47.5 months) in those with a low PC proliferative rate (P = .003) (Figure 2B).
Effect of characteristics at detection of del(17p) on survival measures in patients with acquired del(17p) (n = 76)
| Independent variable | No. of patients with available data in the subgroups | PFS | OS | |||||
|---|---|---|---|---|---|---|---|---|
| P for univariable analysis | HR (95% CI) for multivariable analysis | P for multivariable analysis | P for univariable analysis | HR (95% CI) for multivariable analysis | P for multivariable analysis | |||
| Age ≥65 vs <65, y | 39 vs 37 | .157 | NI | — | .147 | NI | — | |
| Serum creatinine >2 vs ≤2 mg/dL | 4 vs 74 | .311 | NI | — | .846 | NI | — | |
| Bone marrow PCs ≥50% | 37 vs 38 | .512 | NI | — | .651 | NI | — | |
| ISS III vs I/II | 13 vs 43 | .090 | 1.62 (0.78-3.35) | .193 | .047 | 1.60 (0.79-3.25) | .189 | |
| Increased vs normal LDH | 21 vs 41 | .839 | NI | - | .056 | 1.29 (0.59-2.82) | .530 | |
| High-risk vs no high-risk translocation | 14 vs 62 | .868 | NI | — | .873 | NI | — | |
| Monosomy 13 vs no monosomy 13 | 41 vs 35 | .374 | NI | — | .730 | NI | — | |
| HRD vs no HRD | 41 vs 35 | .531 | NI | — | .957 | NI | — | |
| High vs low PC proliferative rate | 32 vs 33 | .036 | 1.58 (0.93-2.69) | .093 | .004 | 2.28 (1.31-3.96) | .004 | |
| PI and IMiD refractory vs not refractory | 30 vs 46 | .080 | 1.05 (0.54-2.05) | .883 | .015 | 1.39 (0.70-2.74) | .347 | |
| Percentage of PCs with del(17p) | ||||||||
| ≥20 vs <20 | 66 vs 5 | .277 | NI | — | .686 | NI | — | |
| ≥30 vs <30 | 59 vs 12 | .032 | 1.53 (0.67-3.52) | .312 | .490 | NI | — | |
| ≥40 vs <40 | 53 vs 18 | .009 | 2.21 (1.21-4.01) | .009 | .589 | NI | — | |
| ≥50 vs <50 | 50 vs 21 | .009 | 1.57 (0.80-3.10) | .193 | .445 | NI | — | |
| ≥60 vs <60 | 49 vs 22 | .009 | 1.57 (0.80-3.10) | .193 | .566 | NI | — | |
All variables with a P < .1 in univariable analysis were included in the multivariable model. The final multivariable model included 49 patients for PFS and OS in whom the parameters were available.
HR, hazard ratio; HRD, hyperdiploidy; NI, not included in analysis.

Prognostic factors for PFS and OS after acquisition of del(17p). Presence of ≥ 40% plasma cells (PCs) with del(17p) predicted shorter PFS, and high PC proliferative rate predicted shorter OS. (A) The median PFS in patients with del(17p) involving ≥ 40% PCs was 3.5 months (95% CI, 1.9-5.7) and in those with < 40% PCs, it was 11.3 months (95% CI, 4.4-15.6) (P = .008). (B) The median OS from detection of del(17p) was 8.9 months (95% CI, 4.9-17.1) among those with high PC proliferation rate and was 35.6 months (95% CI, 18.2- 47.5) among those with low PC proliferation rate (P = .003).
Prognostic factors for PFS and OS after acquisition of del(17p). Presence of ≥ 40% plasma cells (PCs) with del(17p) predicted shorter PFS, and high PC proliferative rate predicted shorter OS. (A) The median PFS in patients with del(17p) involving ≥ 40% PCs was 3.5 months (95% CI, 1.9-5.7) and in those with < 40% PCs, it was 11.3 months (95% CI, 4.4-15.6) (P = .008). (B) The median OS from detection of del(17p) was 8.9 months (95% CI, 4.9-17.1) among those with high PC proliferation rate and was 35.6 months (95% CI, 18.2- 47.5) among those with low PC proliferation rate (P = .003).
To identify predictors at diagnosis of acquisition of del(17p), we compared patients with acquired del(17p) with controls in a case-control fashion and calculated OR. High LDH at baseline (OR, 3.69; 95% CI, 1.11-12.24), presence of t(4;14) (OR, 2.66; 95% CI, 1.09-6.48), and presence of any HRT (OR, 2.23; 95% CI, 1.00-4.95) predicted acquisition of del(17p). Age ≥65 years, ISS III stage, t(11;14), any trisomy/tetrasomy, hyperdiploidy, monosomy 13, bone marrow PC percentage, initial therapy, and exposure to high-dose melphalan in the first year and before acquiring del(17p) were not predictive (supplemental Table 5).
Discussion
In this retrospective analysis, we compare the outcomes of patients who acquired del(17p) on FISH testing with those who did not acquire del(17p) from diagnosis and show that their survival is shorter. We also show that from acquisition of del(17p), patients have a PFS of 5.4 months and OS of about 18 months. In previous reports of patients with RRMM treated with bortezomib-based and lenalidomide-based regimens, the median PFS for patients with del(17p) was 3.4 to 5 months.26,27 In a phase 3 trial of carfilzomib or bortezomib with dexamethasone, the PFS in the 2 groups were 7.6 and 4.9 months, respectively.28 The median OS in a clinical trial of patients with RRMM treated with a bortezomib-based regimen was 11.5 months, which is shorter than the OS from detection of del(17p) in our patients.26 These results underlie the poor prognosis in this subset of patients with RRMM. However, it is difficult to ascertain what proportion of patients in the above trials had a del(17p) at diagnosis of MM as opposed to new detection of del(17p) at relapse. Interestingly, in a recent trial of ixazomib or placebo, with lenalidomide and dexamethasone (IRd vs Rd), among RRMM patients with del(17p), PFS in the IRd and Rd arms were 21.4 and 9.7 months, respectively, the PFS in patients with del(17p) being similar to those with standard-risk cytogenetics.29 These results were in patients with del(17p) defined using a cutoff of ≥5% PCs with del(17p). When using cutoffs of 20% and 60%, PFS of 21.4 vs 6.7 months and 15.7 vs 5.1 months, respectively, were observed in the 2 groups. In our series, using cutoffs from 20% to 60%, PFS ranged from 5.3 to 3.5 months, suggesting progressively decreasing PFS with increase in the size of the PC clone. A cutoff of 40% predicted shorter PFS in multivariable analysis. However, the size of the PC clone with del(17p) was not a predictor of OS. This is similar to the results we observed in a series of patients with de novo del(17p).25
High PC proliferative rate at the detection of del(17p) predicted shorter OS. PC proliferative rate is a prognostic factor in patients with PC disorders, including MM and light chain amyloidosis.30-33 PC proliferative rate detects cells in S-phase and is a marker of active DNA synthesis by malignant PCs. The presence of high PC proliferative rate may be a marker of additional deregulation of cell cycle control in patients with del(17p).
A high LDH at diagnosis and the presence of HRTs, especially t(4;14), had a high OR for the acquisition of del(17p) on follow-up. A previous sequential analysis of patients showed that the presence of HRTs at baseline is associated with detection of more copy number abnormalities on follow-up, and this was postulated to be a result of higher genomic instability in these patients.34 High LDH at baseline may be a marker of aggressive tumor biology. In addition, the use of high-dose melphalan with autologous SCT was not associated with acquisition of del(17p). This is contrary to a previous report that associated high-dose melphalan and autologous SCT with acquisition of high-risk abnormalities, including del(17p), at relapse.35 However, the risk factors we identified were present at baseline in only a few patients in the acquired del(17p) and control groups. We tested 14 potential baseline predictors for acquisition of del(17p). Because this was a retrospective analysis, we did not correct the significance level for P values for multiple comparisons. Our results are hypothesis generating and need confirmation in larger prospective data sets such as CoMMpass.36
Our study is limited by the retrospective nature of the patient data we studied. Prognostic variables at baseline, especially LDH, were not available in all patients. Because the patients were not enrolled in a prospectively designed study, they were not tested at specific time intervals with FISH or at every relapse. Because the study involved patients with acquired del(17p) detected over a long time period, there is considerable heterogeneity in their prior lines of therapy and their subsequent treatments, which represents the changing landscape of treatment of MM. Our use of controls who had a second FISH test with negative del(17p) is likely to select patients who lived long enough because of the inherent good prognosis of their disease; hence, they impart an immortality bias to our study. However, given that we are matching them for time to the positive (cases) or negative (controls) FISH, this does minimize the influence on the subsequent outcome. It is possible that the control group had other currently unknown prosurvival characteristics that allowed them to be alive at the time the FISH test was performed, which may not be present in the cases. However, given the retrospective nature of our data and the absence of FISH testing at regular intervals, this is the best we could do to demonstrate the difference. Furthermore, it is possible that a proportion of patients with acquired del(17p) harbored subclones with del(17p) at diagnosis. This would be hard to ascertain by FISH analysis, given the way in which a positive abnormality is defined in FISH testing (>3 standard deviations above the mean for polyclonal PCs and myeloid cells from normal bone marrow from donors) and would need advanced techniques such as DNA amplification or next-generation sequencing (NGS).37 Subclonal deletion of TP53 detected by multiplex ligation probe amplification has been shown to predict poor prognosis in NDMM.38 This may explain why the median OS of the acquired del(17p) and de novo del(17p) groups tended to be similar and would have to be confirmed in a prospective data set of uniformly treated patients. Finally, recent studies show that combining FISH analysis with NGS identifies patients with biallelic inactivation of TP53 at diagnosis and relapse who have a poor prognosis.39-41 We did not perform NGS on bone marrow PC samples at detection of del(17p) to enable this stratification.
In conclusion, our data show that patients with acquisition of del(17p) on follow-up is associated with marked reduction in OS when compared with patients who do not acquire del(17p) and provides estimates for expected outcomes in patients who acquire del(17p). These data will be important when we design clinical trials for this group of patients with acquired high-risk disease. The presence of HRTs detected by FISH testing and high LDH at baseline predicted acquisition of del(17p). The association with high LDH, HRTs, and shorter PFS in first-line therapy may suggest that patients who acquire del(17p) have an aggressive biology, even at diagnosis.
The full-text version of this article contains supplemental data.
Acknowledgment
This study was supported by the National Institutes of Health, National Cancer Institute grant NCI CA186781.
Authorship
Contribution: A.L. and U.P. collected and analyzed the data, wrote the first draft, and approved the final version of the manuscript; S.V.R., P.K., A.D., M.A.G., F.K.B., M.Q.L., D.D., A.L.F., S.R.H., M.A.H., W.I.G., Y.L.H., N.L., R.S.G., Y.L., T.V.K., R.W., J.A.L., S.J.R., and S.R.Z. managed patients, revised the manuscript critically, and approved the final version of the manuscript; R.P.K. and P.T.G. performed FISH testing, revised the manuscript critically, and approved the final version of the manuscript; R.A.K. performed patient follow-up, revised the manuscript critically, participated in final data analysis, and approval of the final version of the manuscript; and S.K.K. designed the study, analyzed the data, wrote the first draft, approved the final version of the manuscript, and performed patient management.
Conflict-of-interest disclosure: P.K. received research funding from Takeda Pharmaceuticals, Celgene, and Amgen. A.D. received research funding from Celgene, Millennium Pharmaceuticals, Pfizer, and Janssen and received a travel grant from Pfizer. M.A.G. served as a consultant for Millennium Pharmaceuticals and received honoraria from Celgene, Millennium Pharmaceuticals, Onyx Pharmaceuticals, Novartis, GlaxoSmithKline, Prothena, Ionis Pharmaceuticals, and Amgen. M.Q.L. received research funding from Celgene. N.L. serves on an advisory board for Takeda Pharmaceuticals. S.K.K. served as a consultant for Celgene, Millennium Pharmaceuticals, Onyx Pharmaceuticals, Janssen, and Bristol-Myers Squibb and received research funding from Celgene, Millennium Pharmaceuticals, Novartis, Onyx Pharmaceuticals, AbbVie, Janssen, and Bristol-Myers Squibb. The remaining authors declare no competing financial interests.
Correspondence: Shaji K. Kumar, Division of Hematology, Mayo Clinic, 200 First St SW, Rochester, MN 55905; e-mail: kumar.shaji@mayo.edu.

