Key Points
Epigenetic modifying agents quisinostat and CPI203 retain the repopulation capacity of HSCs upon LV transduction.
Quisinostat markedly increases LV transduction efficiency.
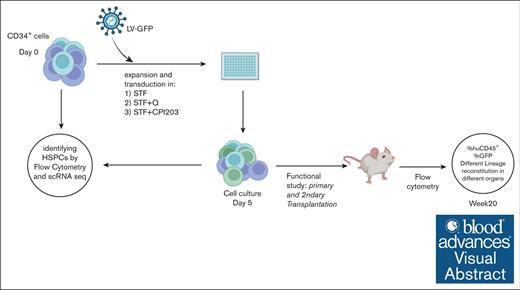
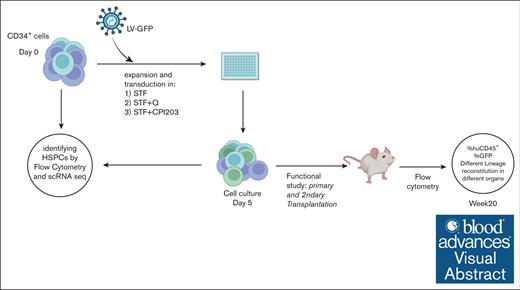
Visual Abstract
The curative benefits of autologous and allogeneic transplantation of hematopoietic stem cells (HSCs) have been proven in various diseases. However, the low number of true HSCs that can be collected from patients and the subsequent in vitro maintenance and expansion of true HSCs for genetic correction remains challenging. Addressing this issue, we here focused on optimizing culture conditions to improve ex vivo expansion of true HSCs for gene therapy purposes. In particular, we explored the use of epigenetic regulators to enhance the effectiveness of HSC-based lentiviral (LV) gene therapy. The histone deacetylase inhibitor quisinostat and bromodomain inhibitor CPI203 each promoted ex vivo expansion of functional HSCs, as validated by xenotransplantation assays and single-cell RNA sequencing analysis. We confirmed the stealth effect of LV transduction on the loss of HSC numbers in commonly used culture protocols, whereas the addition of quisinostat or CPI203 improved the expansion of HSCs in transduction protocols. Notably, we demonstrated that the addition of quisinostat improved the LV transduction efficiency of HSCs and early progenitors. Our suggested culture conditions highlight the potential therapeutic effects of epigenetic regulators in HSC biology and their clinical applications to advance HSC-based gene correction.
Introduction
Hematopoietic stem cells (HSCs) have been successfully used in allogeneic transplantation settings to treat hematological and immunological disorders, as they maintain homeostasis through their unique capacity for self-renewal and multipotency.1-3 Over the past 2 decades, autologous HSC-based gene therapy has emerged as a compelling alternative to allogeneic transplantation, as it is not dependent on finding a matched donor and avoids the risk of graft-versus-host disease. This has proven successful for several inherited diseases, such as immune deficiencies, hematological disorders, and metabolic diseases, through the ex vivo manipulation of the patient’s own hematopoietic stem and progenitor cells (HSPCs).4-7 Lentiviral (LV) vectors have emerged as vectors of choice in clinical settings for safer and more efficient transgene delivery to HSCs than γ-retroviral vectors that were used in initial gene therapy trials. Recently, gene editing has emerged as a powerful tool that provides a platform for the therapeutic correction of monogenic diseases. Proof-of-concept studies using CRISPR-CRISPR–associated protein 9 gene editing in HSPCs have shown promise to treat hematological disorders.8-10 Nevertheless, critical challenges, such as the efficiency of targeting long-term HSCs, on- and off-target side effects, and safety, still need to be addressed.
For successful treatment outcomes of hematological and immunological disorders, correction of long-term HSCs and progenitors is required to ensure long-term correction of the disease.11 Both viral gene addition therapy and homology-directed recombination–based gene editing approaches have shown preferential genetic correction of more proliferating progenitors rather than quiescent HSCs in vitro, possibly due to better chromatin accessibility of relevant loci.12,13
Combinations of hematopoietic cytokines are commonly used in human HSC cultures to promote HSPC expansion for gene therapy purposes.14 Although these cytokines support the short-term maintenance of HSCs, they fail to expand functional HSCs, particularly in genetic manipulation settings.
Great effort has been put to develop culture conditions for HSC expansion in vitro by incorporation of small molecules such as UM171,15 StemRegenin 1,16 or using a chemically defined cytokine-free medium.17 Recent approaches using various epigenetic regulators for HSC expansion in vitro have been reported. Epigenetic regulation is an essential intrinsic cue for normal hematopoiesis and cell fate decisions under physiological conditions.18 Small molecules targeting chromatin-regulating proteins, such as histone deacetylase inhibitors (HDACis), DNA methylating agents, and bromodomain and extra-terminal motif domain inhibitors (BETis), have been successfully used in culturing protocols for human HSCs.19-23 These findings have highlighted the importance of epigenetic regulators as a therapeutic target for HSC expansion and gene therapy purposes.
Methods
Human cells and CD34+ enrichment
Human cord blood was obtained after informed consent from the Leiden University Medical Center. Mononuclear cells were obtained from cord blood by density centrifugation using Ficoll-amidotrizoate. CD34+ cells were positively selected using the human CD34 UltraPure MicroBead Kit (Miltenyi Biotec), according to the manufacturer’s protocol.
CD34+ cell culture
A total of 100 000 to 250 000 enriched CD34+ cells per mL (>90% purity) were cultured in X-vivo15 medium (Lonza) supplemented with recombinant human stem cell factor (SCF; 300 ng/mL), human thrombopoietin (TPO; 100 ng/mL), human FMS-like tyrosine kinase 3 (FLT3; 100 ng/mL) (Miltenyi Biotec), and small molecules of CPI203 (150 nM) (Selleckchem) and quisinostat (0.1, 0.5, and 1 nM) (MedChemExpress). After 4 to 5 days of culture, expanded cells were harvested and counted using a NucleoCounter 3000 (ChemoMetec) for subsequent immunophenotyping, transplantation in mice, and single-cell RNA sequencing (scRNA-seq).
Lentivirus production
HEK 293T cells were seeded at a density of 4 × 10⁶ cells in a 10 cm2 plate. After 24 hours, the cells were transfected using X-tremeGENE HP DNA Transfection Reagent (Sigma-Aldrich) at a mass ratio of 1:3 (DNA:X-tremeGENE HP), with the plasmids. The amount of each viral component per million of cells was: 2.5 μg of pSIN.SF.EGFP.WPRE; 1.25 μg of pMDLg/pRRE; 0.6 μg of pRSV-Rev; and 0.75 μg of pMD2.VSVG. The supernatant was harvested and clarified using a 0.45 μm filter (Whatman) at 24 hours and 48 hours after transfection. The supernatants from different time points were pooled together. The virus concentration was performed using Vivaspin20 (Sartorius) according to the manufacturer’s instructions.
Lentivirus transduction
One day before transduction, CD34+ cells were cultured in cytokine-supplemented X-vivo15 medium in combination with CPI203 (150 nM) or quisinostat (0.5 nM). After overnight stimulation, LV particles carrying the green fluorescent protein (GFP) transgene were added to the cells at multiplicity of infection of 1.5 as well as LentiBOOST (SIRION) final concentration of 1 μg/mL followed by spinoculation at 32°C for 1 hour at 800g. Four days after transduction, transduced cells were used for in vitro and in vivo experiments.
Determination of vector copy number (VCN) by real time quantitative polymerase chain recation
Quantitative polymerase chain reaction (qPCR) was used for the quantitative analysis of proviral DNA copies in transduced cells using human immunedefciency virus-psi and Albumin as housekeeping genes. Genomic DNA of transduced cells was extracted using the GenElute Mammalian Genomic DNA kit (Sigma-Aldrich). qPCR was performed using TaqMan Universal Master Mix II (Thermo Fisher Scientific) in combination with specific probes from a universal library (Roche) on a QuantStudio system (Thermo Fisher Scientific).
Mice
NOD.Cg-Prkdcscid Il2rgtm1Wjl/SzJ (NSG) mice were purchased from the Charles River Laboratories (Evreux, France). All animal experiments were approved by the Dutch Central Commission for Animal experimentation (Centrale Commissie Dierproeven).
Primary and secondary transplantations into NSG mice
For primary transplantations, ex vivo expanded CD34+ cells (25 000 or 50 000 total nucleated cells per mouse) in Iscove Modified Dulbecco Medium without phenol red (Gibco) were transplanted by tail vein injection into preconditioned recipient NSG mice (n = 5). For the secondary transplantations, bone marrow (BM) cells from primary recipient mice from each group were pooled, and one-seventh of the pooled cells were injected into preconditioned secondary recipient NSG mice (n = 5). Recipient mice, 6 to 8-week-old, were conditioned with 2 consecutive doses of 25 mg/kg busulfan (Sigma-Aldrich) (48 hours and 24 hours before transplantation). The mice used for transplantation were kept under specific pathogen-free conditions. The first 4 weeks after transplantation, mice were fed with additional DietGel recovery food (Clear H2O) and antibiotic water containing 0.07 mg/mL Polymixin B (Bupha) and 0.0875 mg/mL ciprofloxacin (Bayer B.V.). Peripheral blood (PB) from the mice was drawn by tail vein puncture every 4 weeks until the end of the experiment. At the end of the experiment, PB, thymus (Thy), spleen (Sp), and BM were harvested. Mice were euthanized via CO2-asphyxiation.
Flow cytometry
Ex vivo cultured cells were stained with the live/dead marker Zombie (BioLegend), according to the manufacturer’s instructions. Subsequently, cells were stained with antibodies listed in supplemental Table 1 and incubated for 30 minutes at 4°C in the dark in fluorescence-activated cell sorter buffer (phosphate-buffered saline pH 7.4, 0.1% azide, 0.2% bovine serum albumin). Single-cell suspensions from murine BM, Thy, and Sp were prepared by squeezing the organs through a 70 μM cell strainer (BD Falcon). Erythrocytes from the PB and Sp were lysed in NH4Cl (8.4 g/L)/KHCO3 (1 g/L). Single-cell suspensions were counted and stained as described above. When 7-aminoactinomycin D and marker of proliferation Kiel-67 staining was needed, intracellular staining was performed using the Transcription Factor Staining Buffer Set (eBioscience) according to the manufacturer’s instructions. All cells were measured on an Aurora Spectral Flow Cytometer (Cytek). The data were analyzed using FlowJo software (Tree Star).
Single-cell analysis QC pipeline
Quality control (QC) and downstream analyses of scRNA-seq data were performed using Seurat version 4.24 The QC pipeline before integration consisted of 3 steps per sample: (1) soft filtering, (2) removal of low-quality clusters, and (3) doublet detection. In soft filtering, Seurat objects were created with cells expressing at least 200 genes and genes expressed in at least 3 cells. The standard Seurat command list was then run to detect low-quality clusters. We removed a cluster only if it had >15% mitochondrial and <1000 messenger RNA in the median. Next, we ran DoubletFinder v3 per sample with a 7.5% detection rate and filtered the singlets.25 To integrate the samples, the cell cycle analysis mode of the Seurat pipeline was used with the most variable 2000 features. Finally, after integration, we filtered cells with >15% mitochondrial messenger RNA.
Cell-type predictions for stimulated cells
After QC, we subsetted the unstimulated CD34+ cells (n = 13 429). Then, these cells were clustered again with a higher resolution parameter (resolution = 1.2) to ensure precise annotation in the downstream projections of the stimulated samples. Furthermore, we checked cluster stability using the clustree R package.26 To annotate each cell cluster, we used a combination of cord blood markers from Dong et al27 and differentially expressed genes (DEGs). The top 20 DEGs per cell cluster from the unstimulated cells are provided in supplemental Table 2. To project these annotations onto stimulated samples, we trained a random forest model with 300 trees using unstimulated CD34+ cells with 2000 integrated features. Cross-validation of the out-of-bag data showed that HSCs could be predicted with an accuracy of 81.2%.
Differential expression and gene set enrichment analysis
Differential expression analysis was conducted using MAST28 with a cutoff of at least 25% difference in cells expressing a given gene. Then, clusterprofiler29 was used along with the biological processes subset of gene ontology terms for gene set enrichment analysis. Pathway P values were adjusted using the Benjamini-Hochberg procedure. Pathways enriched with adjusted P < .05 were selected. The ggplot2 library was used for all visualizations unless indicated otherwise.
Statistics
Statistics were calculated and graphs were generated using GraphPad Prism9 (GraphPad software). Statistical significance was determined by standard 2-tailed Mann-Whitney U tests, unpaired t tests, and analysis of variance tests (∗P < .05, ∗∗P < .01, ∗∗∗P < .001 and ∗∗∗∗P < .0001).
Results
CPI203 and quisinostat support expansion of phenotypic HSCs in vitro
In clinical gene therapy settings, HSPCs are often cultured in a serum-free medium supplemented with the essential cytokines SCF, TPO, FLT3, and interleukin-3 (IL-3).5 We have previously shown the adverse effects of IL-3 on ex vivo HSC expansion and subsequently low engraftment in mice, suggesting the exclusion of IL-3 from culture protocols.14
CD34+ cells from cord blood were expanded for 4 days in a cytokine cocktail of SCF, TPO, and FLT3 (STF), with or without the addition of quisinostat (STF + Q) or CPI203 (STF + CPI203; Figure 1A). Flow cytometry analysis showed that the addition of quisinostat increased the expression of the HSC markers CD34, CD90, and CD201, whereas low expression of CD38 and CD45RA was maintained in the presence of both CPI203 and quisinostat (Figure 1B). This resulted in a substantial increase in the frequency and count of CD34+CD38–/loCD90+CD45RA–CD201+ phenotypic HSCs (Figure 1C-D); whereas the STF cytokine cocktail supported the expansion of multipotent progenitors (MPPs) and different lineage progenitors after 4 days (Figure 1D-E).
CPI203 and quisinostat support ex vivo expansion of HSCs. (A) Schematic experimental design. CD34+ cells were enriched from cord blood and cultured in a cytokine-supplemented medium with quisinostat (0.5 nM) or CPI203 (150 nM) for 4 days. (B) Representative gating strategy of expanded HSCs (CD34+CD38–CD90+CD45RA–CD201+) and MPPs (CD34+CD38–CD90–CD45RA–) in the indicated culture conditions. (C) The graph indicates the frequency of HSC and MPP after 4 days of culture in the indicated culture conditions (n = 9; mean ± standard deviation [SD]). (D) HSC and MPP count after 4 days of culture in the indicated culture conditions (n = 9; mean ± SD). (E) Stacked bar plot showing the composition of HSPCs expanded with only cytokines and in the presence of quisinostat and CPI203. (F) Frequency of cell cycle stages in the expanded HSCs (n = 3; mean ± SD). Statistical significance was determined by a 2-way analysis of variance (ANOVA) test for multiple comparisons: ∗P < .05; ∗∗P < .01; ∗∗∗P < .001; ∗∗∗∗P < .0001. CMP, common myeloid progenitor; GMP, granulocyte monocyte progenitor.
CPI203 and quisinostat support ex vivo expansion of HSCs. (A) Schematic experimental design. CD34+ cells were enriched from cord blood and cultured in a cytokine-supplemented medium with quisinostat (0.5 nM) or CPI203 (150 nM) for 4 days. (B) Representative gating strategy of expanded HSCs (CD34+CD38–CD90+CD45RA–CD201+) and MPPs (CD34+CD38–CD90–CD45RA–) in the indicated culture conditions. (C) The graph indicates the frequency of HSC and MPP after 4 days of culture in the indicated culture conditions (n = 9; mean ± standard deviation [SD]). (D) HSC and MPP count after 4 days of culture in the indicated culture conditions (n = 9; mean ± SD). (E) Stacked bar plot showing the composition of HSPCs expanded with only cytokines and in the presence of quisinostat and CPI203. (F) Frequency of cell cycle stages in the expanded HSCs (n = 3; mean ± SD). Statistical significance was determined by a 2-way analysis of variance (ANOVA) test for multiple comparisons: ∗P < .05; ∗∗P < .01; ∗∗∗P < .001; ∗∗∗∗P < .0001. CMP, common myeloid progenitor; GMP, granulocyte monocyte progenitor.
Both HDACi and BETi have been clinically evaluated as antitumor agents, mainly because of their antiproliferative effects on cancer cells by inducing G0/G1 cycle arrest through the phosphoinositide 3-kinase-protein kinase B pathway30 and targeting MYC, respectively.31 In this study, increasing concentrations of quisinostat reduced the total nucleated count but increased the frequency of phenotypic HSCs (supplemental Figure 1B-C). The addition of CPI203 reduced total cell counts and CD34+ numbers after 4 days of culture (supplemental Figure 1D). This is consistent with the observed significant increase in G0 frequency and decrease in proliferative states of S_G2 in HSCs, whereas no changes in cell cycle states were observed in the quisinostat-treated HSCs (Figure 1F).
Quisinostat increases LV transduction efficiency in vitro
LV-based gene therapy in HSCs has proven to be safe and effective for the correction of different blood disorders. Nevertheless, often clinical applications are limited by suboptimal transduction efficiency especially, in true HSCs, owing to their dormant state.11 Various transduction protocols containing small molecules, such as prostaglandin E2,32 cyclosporin H,12 and poloxamer F108 (LentiBOOST)33 have been reported to improve transduction efficiency in vitro and in vivo.
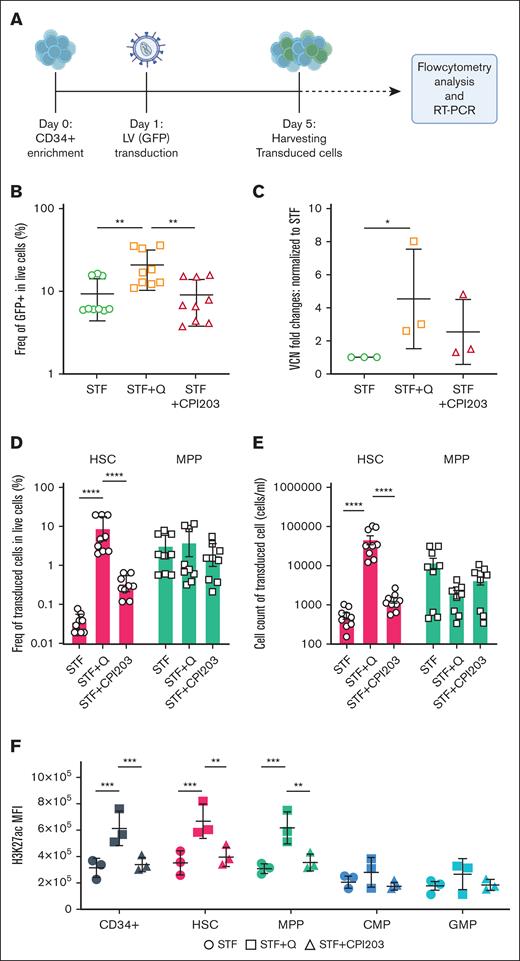
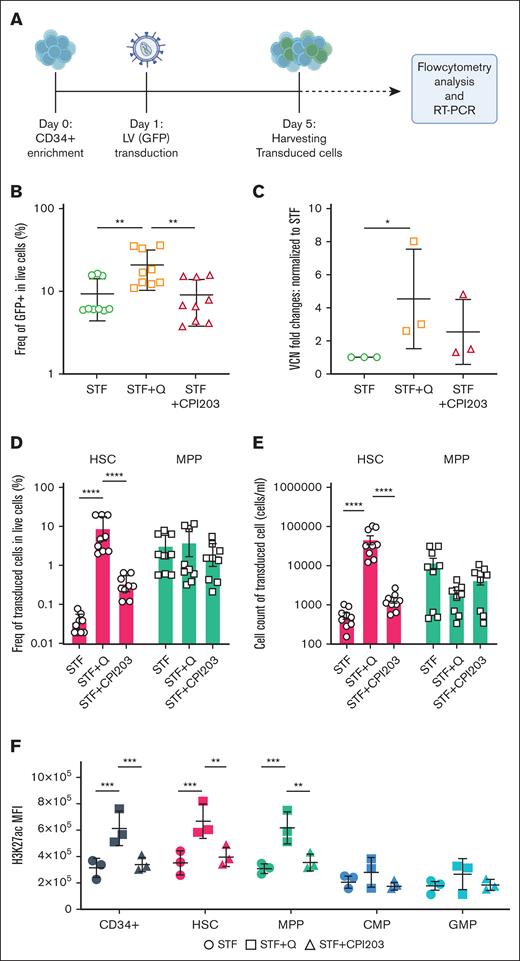
To assess the efficiency of our suggested HSC expansion culture conditions for LV-based gene therapy settings, CD34+ were transduced with LV carrying GFP, in the presence of either CPI203 or quisinostat (Figure 2A). Flow cytometry and VCN analyses showed that the addition of quisinostat in culture increased the LV transduction efficiency significantly in total cells (Figure 2B-C; supplemental Figure 2A). Notably, quisinostat had more than double the transduction efficiency in HSCs (Figure 2D-E) and other progenitors compared with other culture conditions (supplemental Figure 2B).
Quisinostat increases LV transduction efficiency. (A) Schematic experimental design. CD34+ cells were transduced with LV-GFP 24 hours after stimulation in cytokine-supplemented medium alone or the presence of quisinostat (0.5 nM) or CPI203 (150 nM). Cells were harvested for flow cytometry analysis, DNA isolation, and reverse transcription polymerase chain reaction (RT-PCR), 4 days after transduction. (B) Frequency of GFP+ 4 days after transduction in live cells (n = 9; mean ± SD). (C) VCN was determined by RT-PCR (n = 3; mean ± SD; ∗P < .05; unpaired t test). (D) Frequency of transduced HSCs and MPPs in the indicated culture conditions are shown (n = 9; mean ± SD). (E) Cell counts of transduced HSCs and MPPs (n = 9; mean ± SD). (F) The plot shows the mean fluorescence intensity of H3K27ac in different populations of expanded cells in the indicated culture conditions (n = 3; mean ± SD). Statistical significance was determined by 2-way ANOVA test with multiple comparisons: ∗P < .05; ∗∗P < .01; ∗∗∗P < .001; ∗∗∗∗P < .0001. H3K27ac, acetylation level of lysine 27 on histone 3.
Quisinostat increases LV transduction efficiency. (A) Schematic experimental design. CD34+ cells were transduced with LV-GFP 24 hours after stimulation in cytokine-supplemented medium alone or the presence of quisinostat (0.5 nM) or CPI203 (150 nM). Cells were harvested for flow cytometry analysis, DNA isolation, and reverse transcription polymerase chain reaction (RT-PCR), 4 days after transduction. (B) Frequency of GFP+ 4 days after transduction in live cells (n = 9; mean ± SD). (C) VCN was determined by RT-PCR (n = 3; mean ± SD; ∗P < .05; unpaired t test). (D) Frequency of transduced HSCs and MPPs in the indicated culture conditions are shown (n = 9; mean ± SD). (E) Cell counts of transduced HSCs and MPPs (n = 9; mean ± SD). (F) The plot shows the mean fluorescence intensity of H3K27ac in different populations of expanded cells in the indicated culture conditions (n = 3; mean ± SD). Statistical significance was determined by 2-way ANOVA test with multiple comparisons: ∗P < .05; ∗∗P < .01; ∗∗∗P < .001; ∗∗∗∗P < .0001. H3K27ac, acetylation level of lysine 27 on histone 3.
HDACis impact gene expression status by increasing acetylation levels, leading to more transcriptionally active and accessible chromatin. Upon the introduction of quisinostat, we confirmed that the acetylation level of lysine 27 on histone 3 in CD34+, HSCs, and MPPs was significantly increased (Figure 2F). This finding provides a potential explanation for the observed enhanced transduction efficiency.
In vivo repopulating potential of transduced HSPCs from an optimized cell culture
To evaluate the repopulation potential and in vivo engraftment capabilities of cultured HSPCs, we performed xenotransplantation assays, which are the accepted gold standard for assessing the multilineage potential and self-renewal of human HSCs, as reliable in vitro assays to address stem cell functionality are currently absent.34
We transplanted 5 × 10⁴ and 2.5 × 10⁴ expanded cells from the conditions STF, STF + CPI203, and STF + Q into recipient NSG mice (Figure 3A). All mice (5/5) injected with quisinostat- and CPI203-expanded cells showed signs of human engraftment (≥0.1% of human CD45+ [huCD45+]) at both cell doses, whereas mice that received cells expanded in the cytokine cocktail only showed consistent engraftment solely at higher cell doses. Significantly higher human chimerism (huCD45+) in the BM was detected in the quisinostat and CPI203 culture groups when mice received a lower cell dose (Figure 3B-C). Given this difference, subsequent sections will primarily focus on the results from mice receiving a lower cell dose of 25 000 cells. PB analysis over time showed higher human chimerism in mice that received CPI203-cultured cells (Figure 3D). Interestingly, transplantation of CPI203-expanded cells also resulted in a substantially increased engraftment in the Thy, whereas no differences were observed in the Sp (Figure 3E). The frequency of human CD34+ was significantly higher in the BM of the CPI203-expanded culture group (Figure 3F). Distinct multilineage output in different organs demonstrated that both quisinostat and CPI203 cultured cells yielded improved lymphoid development in the BM, with significantly higher frequencies of CD19+, common lymphoid progenitors, and Pro-B cells (Figure 3F). Strikingly, cells expanded with CPI203 exhibited enhanced engraftment in the Thy compared with other organs (supplemental Figure 3 A), accompanied by an increased frequency of CD3+, CD4+CD8+, and TCRab+ cells (Figure 3G).
CPI203 and quisinostat support expansion of functional HSCs. (A) Schematic overview of primary transplantation. A total of 25 000 and 50 000 nucleated expanded cells in the indicated culture conditions were transplanted per mouse. (B) Human engraftment in the BM of NSG mice at week 20 after transplantation (n = 5 mice per group; mean ± standard error of the mean [SEM]; ∗P < .05). Statistical significance was calculated by 1-way ANOVA, with multiple comparisons. (C) Representative fluorescence-activated cell sorter (FACS) plots of huCD45 in NSG BM 20 weeks after transplantation. (D) Kinetics of chimerism in PB over time (n = 5 mice per group; significance of STF vs STF + CPI203 is shown in the plot). (E) Human engraftment in different organs 20 weeks after transplantation (n = 5 mice per group). (F) Frequency of different populations in BM (n = 5 mice per group). (G) Frequency of different populations in the Thy (n = 5 mice per group; mean ± SEM). Statistical significance was calculated by 2-way ANOVA with multiple comparisons: ∗P < .05; ∗∗P < .01; ∗∗∗P < .001; ∗∗∗∗P < .0001.
CPI203 and quisinostat support expansion of functional HSCs. (A) Schematic overview of primary transplantation. A total of 25 000 and 50 000 nucleated expanded cells in the indicated culture conditions were transplanted per mouse. (B) Human engraftment in the BM of NSG mice at week 20 after transplantation (n = 5 mice per group; mean ± standard error of the mean [SEM]; ∗P < .05). Statistical significance was calculated by 1-way ANOVA, with multiple comparisons. (C) Representative fluorescence-activated cell sorter (FACS) plots of huCD45 in NSG BM 20 weeks after transplantation. (D) Kinetics of chimerism in PB over time (n = 5 mice per group; significance of STF vs STF + CPI203 is shown in the plot). (E) Human engraftment in different organs 20 weeks after transplantation (n = 5 mice per group). (F) Frequency of different populations in BM (n = 5 mice per group). (G) Frequency of different populations in the Thy (n = 5 mice per group; mean ± SEM). Statistical significance was calculated by 2-way ANOVA with multiple comparisons: ∗P < .05; ∗∗P < .01; ∗∗∗P < .001; ∗∗∗∗P < .0001.
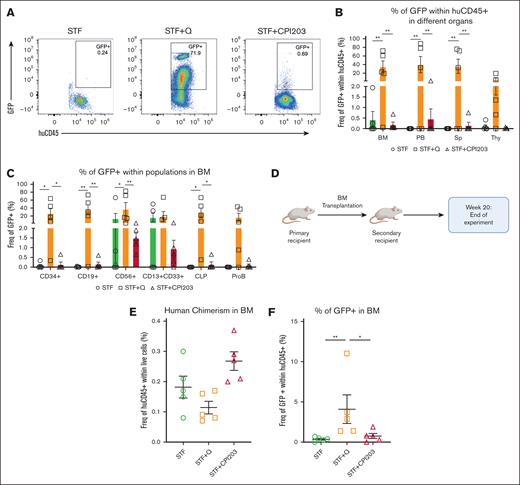
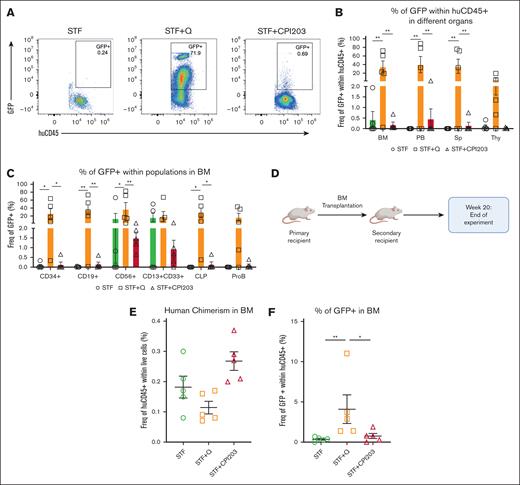
Subsequently, we examined the frequency of transduced cells (percentage of GFP+) among engrafted cells in the BM (Figure 4A). In alignment with our in vitro results, mice that received quisinostat-expanded cells exhibited a greater frequency of transduced huCD45+ in the BM, PB, and Sp, with a marginal increase observed in the Thy when compared with other culture conditions (Figure 4B). Further analysis has also revealed higher transduction efficiency across various lineages in the BM (Figure 4C). Secondary transplantation was performed to confirm the long-term repopulation capacity of expanded cells in the BM (Figure 4D-E), and engraftment of transduced cells in the BM (Figure 4F). These data confirm that the addition of CPI203 or quisinostat maintains HSC self-renewal.
Quisinostat supports better engraftment of transduced cells in vivo. (A) Representative FACS plots of BM at 20 weeks after transplantation in primary mice. (B) Frequency of GFP+ cells in different organs (n = 5 mice per group; mean ± SEM; ∗∗P < .01). Statistical significance was calculated using 2-way ANOVA and multiple comparisons. (C) Frequency of transduced populations within huCD45+ in the BM at 20 weeks after transplantation in primary NSG mice (n = 5 mice per group; mean ± SEM; ∗P < .05, ∗∗P < .01). Statistical significance was calculated by 2-way ANOVA and multiple comparisons. (D) Schematic design of the secondary transplantation into NSG mice. (E) Human chimerism in the BM at 20 weeks after transplantation (n = 5 mice per group; mean ± SEM). Statistical significance was calculated using the Mann-Whitney test. (F) Frequency of transduced cells (GFP+) in the BM (n = 5 mice per group; mean ± SEM; ∗P < .05, ∗∗P < .01). Statistical significance was calculated using the Mann-Whitney test. CLP, common lymphoid progenitor.
Quisinostat supports better engraftment of transduced cells in vivo. (A) Representative FACS plots of BM at 20 weeks after transplantation in primary mice. (B) Frequency of GFP+ cells in different organs (n = 5 mice per group; mean ± SEM; ∗∗P < .01). Statistical significance was calculated using 2-way ANOVA and multiple comparisons. (C) Frequency of transduced populations within huCD45+ in the BM at 20 weeks after transplantation in primary NSG mice (n = 5 mice per group; mean ± SEM; ∗P < .05, ∗∗P < .01). Statistical significance was calculated by 2-way ANOVA and multiple comparisons. (D) Schematic design of the secondary transplantation into NSG mice. (E) Human chimerism in the BM at 20 weeks after transplantation (n = 5 mice per group; mean ± SEM). Statistical significance was calculated using the Mann-Whitney test. (F) Frequency of transduced cells (GFP+) in the BM (n = 5 mice per group; mean ± SEM; ∗P < .05, ∗∗P < .01). Statistical significance was calculated using the Mann-Whitney test. CLP, common lymphoid progenitor.
scRNA-seq reveals epigenetic regulators support expansion of HSCs upon LV transduction
To reveal cellular heterogeneity within CD34+ cells under different culture conditions, we performed scRNA-seq. Specifically, we set out to compare our culture conditions and the effect of LV transduction on the cellular composition of total CD34+ cells.
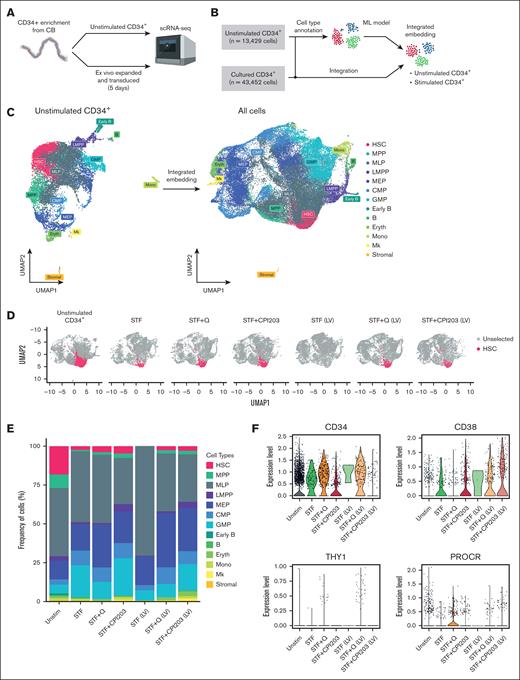
Enriched CD34+ cells (hereafter referred to as unstimulated CD34+) were used as a reference control, along with 6 samples that were cultured and transduced in a medium supplemented with cytokines alone, quisinostat or CPI203 (Figure 5A). After manual annotation of unstimulated CD34+ cells into multiple progenitor cell types based on their gene expression profiles, all samples were integrated and analyzed using Seurat. We identified 13 major clusters (Figure 5B-C) corresponding to several well-recognized early differentiation stages of CD34+ cells. Based on the marker genes adopted from Dong et al27 and the top DEGs (supplemental Table 2), we identified the bona fide HSC population as having high expression of AVP and HLF genes, whereas lacking lineage-specific genes such as MPO, DUTT, and GATA2. The populations with lower expression of HLF and AVP were identified as MPP, as they have been proposed to be early progenitors.17 Furthermore, progenitors of distinct lineages of myeloid, lymphoid, erythroid (Eryth), and megakaryocytic cells (Mks) were identified using their unique gene signatures (Figure 5C; supplemental Figure 4A).
Comparing HSPC composition among different culture conditions, a higher frequency of HSCs was observed in culture conditions with CPI203 and quisinostat than in the STF condition (Figure 5 D-E; supplemental Figure 4D). In cultures supplemented with quisinostat and CPI203, the expression of HSC signature genes of HLF, RORA, and HOXA9 was higher than that in cytokine-only (STF) expanded cells, whereas AVP gene expression decreased in CPI203 expanded cells (supplemental Figure 4C). Moreover, consistent with our flow cytometry analysis (Figure 1B), Single-cell transcriptomics data confirmed higher expression of CD34, THY1, and PROCR genes in quisinostat-expanded cells, whereas expression of the CD38 gene was decreased (Figure 5F).
In accordance with our in vivo results, the scRNA-seq data also demonstrated an increase in frequencies of lymphoid multipotent progenitors, B cells, common myeloid progenitors, and Mks in CPI203 expanded cells (Figure 5E; supplemental Figure 4D). Collectively, our in vivo and in vitro results suggest that the addition of CPI203 in the HSC expansion protocol not only improved the ex vivo expansion of HSCs but also supported the priming of cells toward the lymphoid lineage. In contrast, the addition of quisinostat reduced the frequency of granulocyte monocyte progenitors and increased megakaryocyte-Erythrocyte and common myeloid progenitors (Figure 5E; supplemental Figure 4D).
Notably, our data showed a higher frequency of megakaryocyte-Eryth progenitors, Eryth, and Mks upon LV transduction, suggesting that LVs could skew cells toward the Eryth lineage in culture conditions containing quisinostat or CPI203. In contrast, a higher frequency of myeloid-lymphoid progenitors was detected in cytokine-expanded cells (supplemental Figure 4D). This possible lineage skewing upon LV transduction warrants further investigation.
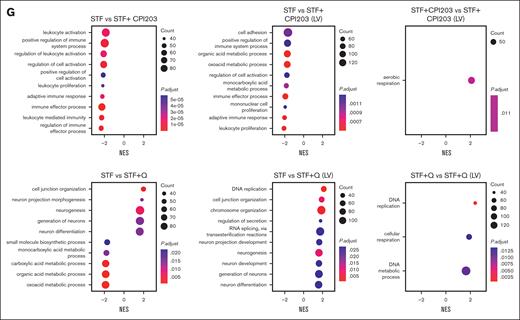
Finally, single-cell transcriptomics results showed that LV transduction in itself induces cell proliferation (supplemental Figure 4B) but reduces the frequency of the HSC population compared with nontransduced conditions. This decrease was more prominent in the STF condition, whereas the inclusion of quisinostat and CPI203 in the LV transduction protocol helped maintain HSCs (Figure 5D; supplemental Figure 4D). LV transduction induces an innate immune response via indirect activation of interferon (IFN) responses through different pathways, such as Toll-like receptors (TLRs),35 DNA damage response,36 or DNA sensor responses.37 We detected elevated gene expression related to the IFN response and DNA damage response, such as TP53, IFITM2, IFITM3, IFI16, TMEM173, and DDB2 in expanded cells. However, the addition of CPI203 resulted in a reduction of their expression. Additionally, no changes in the expression of TLRs were observed (supplemental Figure 4E). Using Gene set enrichment analysis and checking the cellular processes associated with the DEGs (Figure 5G), we noted that the addition of quisinostat to the LV transduction condition resulted in the DEGs associated with DNA replication and chromosome organization, in line with the functional effects observed.
Collectively, these findings indicate that the addition of Quisinostat and CPI203 enhances the expansion of HSCs while simultaneously priming cells for Eryth and lymphoid lineages, respectively. Furthermore, our study highlights the impact of LV transduction on cellular heterogeneity, revealing a significant loss of HSCs with the commonly used protocol in clinical settings.
Discussion
Working toward improving HSC expansion protocols for gene therapy purposes, in this study we have evaluated existing and newly tested culture conditions for HSC expansion and gene modification. We incorporated the small molecule CPI203, a BETi that has been previously reported by Hua et al,19 and the HDACi quisinostat for testing ex vivo expansion of HSCs and their genetic modification. BET proteins interact with acetylated lysins at transcriptional start sites, which regulate transcription through RNA polymerase II complex formation. BETi regulates transcription by blocking BET protein binding to histones. The therapeutic benefits of BETis have been investigated in several cancer trials; however, their clinical progression has been challenging and none have received regulatory approval.38 In contrast, quisinostat, an HDACi targeting HDAC I and II, has been evaluated in several clinical trials for different malignancies.39,40 Recent research suggests that quisinostat inhibits cancer cell self-renewal by re-establishing the expression of the histone linker H1.0.41 H1 is highly conserved and is involved in embryonic stem cell differentiation and mammalian development, although the role of the H1 linker in HSCs development and fate decisions needs further investigation.
We have reported improved culture conditions for ex vivo expansion of true HSCs, which could be implemented in LV transduction protocols for gene therapy purposes. We showed that the inclusion of epigenetic regulators of quisinostat and CPI203 increased the expansion of HSCs. In addition, the positive effect of quisinostat on transduction efficiency provides a major benefit for the gene therapy field. This not only ensures the long-term correction of true HSCs, which is the ultimate goal of gene therapy, but also reduces the costs associated with viral vectors, because fewer LV particles are required to achieve the desired VCN.
Importantly, our scRNA-seq data revealed the stealth effect of LV transduction on the loss of HSCs, particularly in the conventional clinical protocol for STF-cytokine–expanded cells. LV transduction induces an innate immune response via indirect activation of IFN responses through different pathways, such as TLRs,35 DNA damage response,36 or DNA sensor responses.37 Even though LVs can escape innate immune responses,42 they can be detected through TLRs35 in HSPCs or trigger p53 signaling followed by robust induction of IFN responses.42 Human CD34+ cells express TLR3, TLR4, TLR7, TLR8, and TLR9 to detect infection and induce innate immune response immediately.35 Upon viral infection under physiological conditions, IFN-α induction leads to proliferation in response to clear infection.43 In addition, results from mouse studies showed that induction of IFN-γ impairs HSC self-renewal and restores HSCs numbers upon viral infection.44 However, in our study, no changes in TLRs’ gene expressions were found. Strikingly, the benefit of CPI203 in gene editing can be investigated, as it reduces IFN responses through p53 and reduces DNA damage responses.
Furthermore, our in vivo study suggests that CPI203 improved lymphoid development in the BM and significantly in the Thy without compromising other lineages, a benefit that would be valuable for patients with an impaired immune system. Moreover, based on our single-cell transcriptomic data, quisinostat primed HSCs toward the Eryth lineage, which also holds promise for gene therapy targeting blood disorders.
In the realm of clinical trials focused on HSC-based gene therapy, substantial financial investments are dedicated to producing Good Manufacturing Practice–grade LV batches. Frequently, the expenses associated with generating these batches reach into the millions of dollars, even for a small number of patients. Compliance with regulatory standards mandates full-scale test runs in meticulously controlled clean room environments. Consequently, the limited availability of Good Manufacturing Practice–grade virus for patient treatment significantly amplifies the overall costs associated with gene therapy medicines, emerging as a critical concern in the field.45 This underscores the pressing need for advancements in HSC transduction protocols to alleviate the financial burden and streamline the production of gene therapies. Here, we reported on enhanced culture conditions that not only improve transduction efficiency but also preserve the integrity of HSCs. Such optimization is imperative for achieving a more favorable clinical outcome and emphasizes the importance of refining current protocols for expanded hematopoietic cell therapies.
Acknowledgments
This work was supported in part by an unrestricted educational grant from Batavia Biosciences (P.T.). Work in the Staal Laboratory is supported in part by a ZonMW E-RARE grant (40-419000-98-236 020) and European Union Horizon 2020 (EU H2020) grant RECOMB (755170-2) and funding from the EU H2020 research and innovation program as well as from reNEW, the Novo Nordisk Foundation for Stem Cell Research (reNEW) grant NNF21CC0073729.
Authorship
Contribution: P.T. designed, performed, and analyzed the experiments, and wrote the manuscript; E.O.K. performed the bioinformatics analysis; K.C.-B. supported the in vivo experiments; B.A.E.N., S.A.V., and M.C.J.A.v.E. assisted with mouse experiments; M.-L.v.d.H. provided the cord blood for this study; E.v.d.A. supported the single-cell RNA sequencing experimental design; K.P.-O. and F.J.T.S. supervised and revised the manuscript; and all authors read and agreed to the final version of the manuscript.
Conflict-of-interest disclosure: The authors declare no competing financial interests.
Correspondence: Frank J. T. Staal, Department of Immunology, Leiden University Medical Center, 2333 ZA Leiden, The Netherlands; email: f.j.t.staal@lumc.nl.
References
Author notes
The sequencing data reported in this article have been submitted in the European Genome-Phenome Archive (accession numbers EGAS50000000175 and EGAD50000000254).
Original data are available on request from the corresponding author, Frank J. T. Staal (f.j.t.staal@lumc.nl).
The full-text version of this article contains a data supplement.

![CPI203 and quisinostat support ex vivo expansion of HSCs. (A) Schematic experimental design. CD34+ cells were enriched from cord blood and cultured in a cytokine-supplemented medium with quisinostat (0.5 nM) or CPI203 (150 nM) for 4 days. (B) Representative gating strategy of expanded HSCs (CD34+CD38–CD90+CD45RA–CD201+) and MPPs (CD34+CD38–CD90–CD45RA–) in the indicated culture conditions. (C) The graph indicates the frequency of HSC and MPP after 4 days of culture in the indicated culture conditions (n = 9; mean ± standard deviation [SD]). (D) HSC and MPP count after 4 days of culture in the indicated culture conditions (n = 9; mean ± SD). (E) Stacked bar plot showing the composition of HSPCs expanded with only cytokines and in the presence of quisinostat and CPI203. (F) Frequency of cell cycle stages in the expanded HSCs (n = 3; mean ± SD). Statistical significance was determined by a 2-way analysis of variance (ANOVA) test for multiple comparisons: ∗P < .05; ∗∗P < .01; ∗∗∗P < .001; ∗∗∗∗P < .0001. CMP, common myeloid progenitor; GMP, granulocyte monocyte progenitor.](https://ash.silverchair-cdn.com/ash/content_public/journal/bloodadvances/8/18/10.1182_bloodadvances.2024013047/2/m_blooda_adv-2024-013047-gr1.jpeg?Expires=1770019207&Signature=LIK5qjZgOeTfe64B~iB8OL6u986azWrGtfhROB7nSSD4zusqwznm1fbACRkHP1Ty6zOrRVJ07A3BHbjb9lSd1MrJQlktesBH34e3zXTEzMZ6Dw3tNXTz1e9PCYXXrYbF37E5kJC2VfTiisnkW7oaPEVApLkT06CHbzoVKV-x5QmNotNMBFnYHAPppWoRJqRxnPxK4d9ZhmiEqAmGz6qDd1Ml9aalBZbO9sT4npiVEWVNFr22PlwIPI1d8uIAGpYxGvX~~DCZFJOQ63d3aPlsbQt-SKb1eda-9EWo6kasyL8AmcsjnuEjk~qkPH5tJS7dAkDxpxl7R4RVnXrnamZkWg__&Key-Pair-Id=APKAIE5G5CRDK6RD3PGA)
![CPI203 and quisinostat support expansion of functional HSCs. (A) Schematic overview of primary transplantation. A total of 25 000 and 50 000 nucleated expanded cells in the indicated culture conditions were transplanted per mouse. (B) Human engraftment in the BM of NSG mice at week 20 after transplantation (n = 5 mice per group; mean ± standard error of the mean [SEM]; ∗P < .05). Statistical significance was calculated by 1-way ANOVA, with multiple comparisons. (C) Representative fluorescence-activated cell sorter (FACS) plots of huCD45 in NSG BM 20 weeks after transplantation. (D) Kinetics of chimerism in PB over time (n = 5 mice per group; significance of STF vs STF + CPI203 is shown in the plot). (E) Human engraftment in different organs 20 weeks after transplantation (n = 5 mice per group). (F) Frequency of different populations in BM (n = 5 mice per group). (G) Frequency of different populations in the Thy (n = 5 mice per group; mean ± SEM). Statistical significance was calculated by 2-way ANOVA with multiple comparisons: ∗P < .05; ∗∗P < .01; ∗∗∗P < .001; ∗∗∗∗P < .0001.](https://ash.silverchair-cdn.com/ash/content_public/journal/bloodadvances/8/18/10.1182_bloodadvances.2024013047/2/m_blooda_adv-2024-013047-gr3.jpeg?Expires=1770019207&Signature=ovUgsieIFBz4WpiJL42DmVHONNgA7wstZ0fl21ztmABXZpQdTXZIUea9y-zt3473v8eLXTraGer4GWUpbUh09f0HxPHlFqyFDEOu4s3Dako5zYewyfS~k9g7k6Bg-z0b1J15m8O0-Na-VtQnF88qV5oH9ieKWVQ1zizQyJqWnBdN7AIvR2Q8BKvA00fYiuK3EaVGYFVA8-dC8k8svD~Pc50v6PT9l7oVDNeW2Oq5tzLrgPfVDivNOBKXOq1v~n6n-CqYwyJOhIKHbm4Z8OSiwPaJ0OK99r0FIozGLahqETyaNbyMS5zxRXMUAOpRfA~9yxcWmYoxtscdCuFPNt-btg__&Key-Pair-Id=APKAIE5G5CRDK6RD3PGA)

![CPI203 and quisinostat support ex vivo expansion of HSCs. (A) Schematic experimental design. CD34+ cells were enriched from cord blood and cultured in a cytokine-supplemented medium with quisinostat (0.5 nM) or CPI203 (150 nM) for 4 days. (B) Representative gating strategy of expanded HSCs (CD34+CD38–CD90+CD45RA–CD201+) and MPPs (CD34+CD38–CD90–CD45RA–) in the indicated culture conditions. (C) The graph indicates the frequency of HSC and MPP after 4 days of culture in the indicated culture conditions (n = 9; mean ± standard deviation [SD]). (D) HSC and MPP count after 4 days of culture in the indicated culture conditions (n = 9; mean ± SD). (E) Stacked bar plot showing the composition of HSPCs expanded with only cytokines and in the presence of quisinostat and CPI203. (F) Frequency of cell cycle stages in the expanded HSCs (n = 3; mean ± SD). Statistical significance was determined by a 2-way analysis of variance (ANOVA) test for multiple comparisons: ∗P < .05; ∗∗P < .01; ∗∗∗P < .001; ∗∗∗∗P < .0001. CMP, common myeloid progenitor; GMP, granulocyte monocyte progenitor.](https://ash.silverchair-cdn.com/ash/content_public/journal/bloodadvances/8/18/10.1182_bloodadvances.2024013047/2/m_blooda_adv-2024-013047-gr1.jpeg?Expires=1770019208&Signature=gSOKD7u~uuTKfLEyBM1kzc9AMK5gXNuxELV8hSrWF7rHhhmzvT0zScjjlGaH8JjEP8MinMX-ecz6uKi1szCHHR9rGbRRYaK32qQhs7ZswJO4b2rrNLrEmRpEiuGZ1NbWQSv~WE9II9Kuq3Ksy8p5tlwroM7CWVFrvzIKQN9ksTy6-bkwohHB9RnZ93h1X3XDYdnFIT5YPDFmgTZ2Mbtt1ZHssXATT2BCX21jcpxZD06H96n3qkOfb57MNFeirFkclCVCVsxe13jkbAU5od~oah3KWcdtccxfWkBvsn3eI~aEDZylzEwXfHvsZNLF2~YFgNUWrzhQ0SbwwbSX3HFEcg__&Key-Pair-Id=APKAIE5G5CRDK6RD3PGA)
![CPI203 and quisinostat support expansion of functional HSCs. (A) Schematic overview of primary transplantation. A total of 25 000 and 50 000 nucleated expanded cells in the indicated culture conditions were transplanted per mouse. (B) Human engraftment in the BM of NSG mice at week 20 after transplantation (n = 5 mice per group; mean ± standard error of the mean [SEM]; ∗P < .05). Statistical significance was calculated by 1-way ANOVA, with multiple comparisons. (C) Representative fluorescence-activated cell sorter (FACS) plots of huCD45 in NSG BM 20 weeks after transplantation. (D) Kinetics of chimerism in PB over time (n = 5 mice per group; significance of STF vs STF + CPI203 is shown in the plot). (E) Human engraftment in different organs 20 weeks after transplantation (n = 5 mice per group). (F) Frequency of different populations in BM (n = 5 mice per group). (G) Frequency of different populations in the Thy (n = 5 mice per group; mean ± SEM). Statistical significance was calculated by 2-way ANOVA with multiple comparisons: ∗P < .05; ∗∗P < .01; ∗∗∗P < .001; ∗∗∗∗P < .0001.](https://ash.silverchair-cdn.com/ash/content_public/journal/bloodadvances/8/18/10.1182_bloodadvances.2024013047/2/m_blooda_adv-2024-013047-gr3.jpeg?Expires=1770019208&Signature=dINuryBu2XfGn6e9EhmYx0MO12sdtLrP9Q9EH9MIu1sD5KtQ~a1lM6p8q5S1TSBYbSch8YiVyI4HJC-G1byPNkTFsVM9AVRWHXBZPQ5B43hAZkp87kNBkv2EeWm6jg1WqeixdJzlj9JZYJnB-ytaYktPavxNfY468n0Fp91Yx8Dyzz5LuB6dVkPDFXCw147z~b0iGPoJ~pbUUdoEhUZL1GiR6On7SLILP5gGbg79VO9m3ZOuF7C3Ar~Ozg1VYym09JYGYK6LkGxlktCjtWRqXjLz1j3jhVuegZBu~i6FCDPWTp5U9Q~B5yn1jyzbfR74mdH0CBx~iRUybcU5Q6JY9A__&Key-Pair-Id=APKAIE5G5CRDK6RD3PGA)
