Key Points
Cancer survivors have disproportionately greater insulin resistance with increasing BMI compared with controls without malignancies.
Our findings indicate that interventions targeting obesity will be needed to prevent the sequelae of insulin resistance in cancer survivors.

Abstract
Cancer survivors are at increased risk of type 2 diabetes, which usually develops from obesity and insulin resistance. Whether diabetes susceptibility is due to shared risk factors for cancer and insulin resistance or directly related to cancer and its treatment is unknown. We investigated effect modification between malignancy and body mass index (BMI) as determinants of insulin sensitivity in patients with hematologic malignancies and controls without cancer. In a cross-sectional study of 43 individuals without diabetes (20 patients with treated hematologic malignancies; 23 controls without malignancies), we measured insulin-stimulated whole-body glucose use (M) by hyperinsulinemic euglycemic clamp. Insulin sensitivity index (ISI) was calculated by dividing M over steady-state plasma insulin. Inflammatory cytokines were measured in plasma. Controls were more obese and included more non-White individuals and women vs patients with hematologic malignancies. Patients with cancer exhibited greater insulin sensitivity (median ISI, 42.4 mg/kg/min/[μU/mL]; interquartile range [IQR], 33.9-67.2 vs 23.4 mg/kg/min/[μU/mL]; IQR, 12.9-29.2; P < .001) and higher interleukin-6 (IL-6) and monocyte chemoattractant protein-1 (MCP-1) concentrations vs controls. Patients with cancer demonstrated greater reduction in ISI with increasing BMI vs controls, which remained significant after adjustment for sex and race (β = −2.6 units; 95% confidence interval, −4.8 to −0.4; P interaction = .024). This interaction also remained significant after adjusting for log IL-6 (P interaction = .048) and log MCP-1 (P interaction = .021). Cancer survivors had disproportionately greater insulin resistance with increasing BMI vs controls without malignancies. Effect modification between cancer and BMI in determining insulin sensitivity implicated cancer-specific etiologies in glucose dysregulation and could partially explain excess diabetes diagnoses among oncology patients.
Introduction
Advances in cancer detection and treatment have led to unprecedented improvements in survival, resulting in later development of nononcologic chronic diseases in these survivors. The number of cancer survivors in the United States is projected to exceed >20 million by the latter half of this decade, including ∼1.5 million individuals with either leukemia or lymphoma.1 With oncology patients living longer, greater emphasis is now being placed on decreasing complications, reducing treatment-related morbidity, and improving the quality of life of patients with cancer.
Type 2 diabetes is a significant complication for cancer survivors, including patients with hematologic malignancies.2,3 Diabetes is a major risk factor for cardiovascular disease,4 which is the leading cause of noncancer mortality in patients with cancer.5
Previous studies reported evidence linking cancer survivorship with diabetes,2,3 but the mechanistic insights to support these findings remain elusive. It is unknown whether diabetes susceptibility in the setting of malignancy is due to shared risk factors for cancer and diabetes, such as obesity, or directly related to cancer and its treatment.
Type 2 diabetes is an inflammatory disease6,7 characterized by hyperglycemia and defects in insulin action and secretion.8 Usually, type 2 diabetes develops from established insulin resistance, which can be detected with an oral glucose tolerance test (OGTT) or directly measured via the gold-standard hyperinsulinemic euglycemic clamp.9 Obesity is of particular interest because it is a major risk factor for both cancer development10 and insulin resistance, the predecessor to diabetes.11 Adipose tissue deposition and dysfunction leading to the release of various adipokines, growth factors, and inflammatory cytokines have been proposed as shared but indirect mechanisms for the development of both cancer and diabetes.12
Alternatively, cancer-specific factors could be the culprit for diabetes genesis after malignancy diagnosis. Medication or radiation used in oncology care can impair glucose tolerance by increasing insulin resistance, promoting hepatic glucose production, or decreasing insulin synthesis and secretion. Thus, therapeutics could directly contribute to diabetes conversion in cancer survivors.13,14 Furthermore, by impairing the action of insulin, inflammatory cytokines from the tumor can induce insulin resistance independently of adiposity-related mechanisms.15 Accordingly, acquired mutations in DNMT3A, TET2, and ASXL1, which are observed in clonal hematopoiesis and myeloid neoplasms, have been shown to increase the risk of atherosclerosis and cardiovascular disease through inflammatory pathways.16,17 Recurrent somatic mutations found in both hematologic diseases and the sequelae of insulin resistance are further evidence supporting a direct biologic link between malignancy and diabetes.
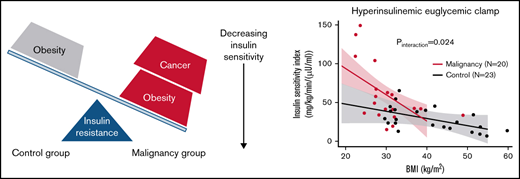
Given the excess risk of diabetes in oncology patients and the possible synergistic effects of malignancy and obesity, we hypothesized that patients with cancer would exhibit greater resistance to insulin with increasing body mass index (BMI) compared with controls without cancer. To test this hypothesis, we investigated the effect modification between cancer status and BMI as determinants of whole-body insulin sensitivity measured by hyperinsulinemic euglyemic clamp in individuals without diabetes who either had treated hematological malignancies or were controls without cancer. To elucidate the potential mechanism for this effect of malignancy, we also tested the hypothesis that chronic underlying inflammation in patients with cancer would lead to impaired insulin sensitivity. We focused on hematologic malignancies because their genetic landscape could contribute to insulin resistance, and their treatment often incorporates agents known to disturb glucose homeostasis.
Methods
Design and study sample
This study was a cross-sectional investigation that included 43 participants without diabetes recruited at Vanderbilt University Medical Center (20 patients with hematologic malignancies and 23 controls without a history of cancer). Patients with treated hematologic malignancies (age 18-70 years) were recruited to the study while undergoing evaluation for first allogeneic hematopoietic cell transplant (HCT; registered at www.clinicaltrials.gov as #NCT02240381). Metabolic testing was completed before conditioning and transplantation. Controls (age 21-60 years) were obese but otherwise healthy and without a history of cancer; they were recruited using a volunteer registry and study advertisements. Control participants underwent hyperinsulinemic clamp studies conducted under standardized basal conditions (#NCT03486223). Individuals with major cardiovascular, pulmonary, hepatic, renal, neurologic, or psychiatric disorders were omitted from the investigation. In both groups, pregnant or breastfeeding women and those with a history of diabetes, diabetes therapy within 6 months of enrollment, fasting blood glucose ≥126 mg/dL at screening, or 2-hour postprandial blood glucose ≥200 mg/dL during the OGTT were excluded. For patients with hematologic malignancies, HbA1c was not used as a screening mechanism because of blood transfusion requirements. The study was approved by the institutional review board of the Vanderbilt University Medical Center, and informed consent was obtained from all participants. The study activities were performed in accordance with the Declaration of Helsinki.
Study procedures
All participants completed an OGTT and hyperinsulinemic euglycemic clamp at the Vanderbilt Clinical Research Center on separate days. No individuals were receiving corticosteroids or chemotherapy at the time of metabolic assessment.
OGTT.
Each participant underwent a standard 75-g OGTT after an 8-hour overnight fast. Plasma samples were analyzed for glucose and insulin at time 0 and 120 minutes. OGTT results were categorized using standard definitions as either normal (<100 mg/dL), impaired (100-125 mg/dL), or diabetic (≥126 mg/dL) for fasting glucose levels and either normal (<140 mg/dL), impaired (140-199 mg/dL), or diabetic (≥200 mg/dL) for 2-hour postprandial glucose values.18 Individuals with fasting plasma glucose ≥126 mg/dL or 2-hour postprandial glucose ≥200 mg/dL were considered to have established diabetes and were excluded from analysis.
Homeostasis Model Assessment.
Homeostasis Model Assessments of insulin sensitivity (HOMA2-S) and β-cell function (HOMA2-B) were calculated using fasting plasma insulin and glucose levels during the OGTT to generate noninvasive estimations (HOMA2 calculator, https://www.dtu.ox.ac.uk/homacalculator/).
Hyperinsulinemic euglycemic clamp.
Whole-body glucose use was assessed in study participants after an 8-hour overnight fast using the glucose clamp technique originally described by DeFronzo et al.9 During the high-dose insulin phase, a primed continuous infusion of insulin (80 mU/m2/min) was administered for 2 hours to achieve hyperinsulinemia to suppress hepatic glucose production and increase glucose uptake by skeletal muscle. Plasma glucose was measured every 5 minutes, and an IV infusion of 20% dextrose was adjusted to maintain plasma glucose at 95 mg/dL (considered euglycemia).9,19 The M value was calculated as the amount of glucose in milligrams infused per kilogram body weight per minute (M = [dextrose infusion rate at steady state in mL/hour × 181.9 mg/mL]/[body weight in kg] × 60 minutes/hour). The M value provides a measure of the action of insulin, because the greater the insulin sensitivity, the more dextrose required to maintain euglycemia.
Calculating insulin sensitivity.
Whole-body glucose use was expressed as the steady-state glucose infusion rate (M) during the last 30 minutes of the procedure. Because steady-state kinetics are in effect, glucose disposal equals the glucose infusion rate (M). The insulin sensitivity index (ISI) during the final 30 minutes of the clamp was calculated as follows: ISI = M/I, where M is the glucose disposal rate (mg/kg/min), and I is the average plasma insulin level (μU/mL). Increasing M and M/I values indicate greater insulin sensitivity.
Calculating insulin clearance.
Insulin clearance is an important regulator of the action of insulin, because it determines the availability of the hormone along with secretion. Insulin is cleared primarily by the liver, followed by kidneys and skeletal muscle. To determine if insulin metabolism differed between the groups, insulin clearance during the clamp was calculated by the following formula: insulin clearance = insulin infusion rate/average insulin concentration during the last 30 minutes of the procedure.
Clamp and OGTT sample analysis.
Plasma glucose was measured by the glucose oxidase method. Plasma insulin was uniformly analyzed via radioimmunoassay (Millipore) by the Vanderbilt Assay and Analytical Services Core.
Cytokine measurements.
Fasting blood samples were collected in EDTA tubes, and plasma was stored at −80°C after centrifugation. Inflammatory cytokines and proteins involved with glucose metabolism and insulin resistance were selected for analysis.20-22 Interleukin-6 (IL-6), IL-1α, tumor necrosis factor-α (TNF-α), monocyte chemoattractant protein-1 (MCP-1), and IL-1 receptor antagonist concentrations were measured in the plasma using the sandwich immunoassay from the Meso Scale Discovery U-PLEX Biomarker Group 1 Human Kit (catalog #K15067L-1; Meso Scale Diagnostics, Rockville, MD). Experiments were conducted according to manufacturer instructions in duplicate on each 96-well plate.
Statistical analysis
Descriptive statistics included medians and interquartile ranges (IQRs) for continuous variables and frequencies (percentages) for categorical variables. The primary outcome measured was ISI. Skewed variables (plasma cytokine concentrations) were log transformed to improve normality in the residuals. The differences between the study groups were assessed by Wilcoxon rank-sum test for continuous variables and χ2 test for categorical variables. A univariable linear regression model was generated to test the effect of either BMI or malignancy on the following outcome variables: whole-body glucose use (M), insulin sensitivity (ISI), and insulin clearance. A multivariable linear regression model was fit with ISI as the dependent variable. Independent variables included malignancy, BMI, and a malignancy × BMI interaction term. The interaction was also assessed with adjustment for race, sex, and inflammatory markers, because these variables differed between the cancer and control groups and can also affect insulin sensitivity. The univariable and multivariable analyses were repeated for M and insulin clearance as dependent variables. A 2-sided P value <.05 was considered significant. All analyses were performed using Stata/IC 16.0.
Results
Study population
OGTT and hyperinsulinemic euglycemic clamp were performed in 23 healthy controls and 20 patients with cancer at various time points after hematologic malignancy diagnosis and treatment but before conditioning and allogeneic HCT. No individuals had preexisting diabetes, and all oncology patients had received conventional treatment before metabolic testing. The demographic and clinical characteristics of the 43 study participants are presented in Table 1. The median age was 52 years (IQR, 34-56), 47% were men, and 35% were non-White. Compared with controls, patients with cancer were more likely to be men and White, whereas controls had a higher BMI than individuals with malignancies.
In the oncology cohort, myelodysplastic syndrome/acute myeloid leukemia and non-Hodgkin lymphoma (NHL) were the most frequent diagnoses (Table 1). All patients received conventional systemic chemotherapy, except for 3 individuals (15%). The majority of this treatment was antileukemic induction/consolidation or intensive chemoimmunotherapy for relapsed lymphoma. In addition, oral tyrosine kinase inhibitors were used in 6 patients (30%), and they were the only therapy for the 3 people who did not receive traditional cytotoxic chemotherapy for chronic myelogenous leukemia or myeloproliferative neoplasm. During the course of their disease, 8 patients (40%) were treated with pulsed corticosteroids for cancer, and only 4 individuals (20%) received radiotherapy (noncranial). One person with NHL underwent autologous HCT 5 years before OGTT and clamp. No patients had undergone allogeneic HCT. The median number of systemic therapies was 2 (IQR, 1-3), and the median time from cancer diagnosis to metabolic testing was 9.5 months (IQR, 5.5-42.3). At the time of study entry, all oncology patients had completed treatment, 11 (55%) were in remission, and 4 (20%) were cancer survivors for >5 years (Table 1). Of the 5-year cancer survivors, all 4 patients had received treatment for NHL, with initial remission ranging from 2 to 4 years followed by relapse of the original hematopoietic neoplasm, additional chemotherapy, and eventual referral for allogeneic HCT.
OGTT results
The median time from chemotherapy completion to metabolic assessment was 2 months (IQR, 1-3). No study participants were receiving corticosteroids or cancer treatment while undergoing OGTT or hyperinsulinemic euglycemic clamp. During OGTT, prediabetes, defined as either fasting plasma glucose from 100 to 125 mg/dL or 2-hour postprandial plasma glucose from 140 to 199 mg/dL, was identified in 15 controls (65%) and 9 patients with cancer (45%; P = .183). Specifically, 5 patients with cancer (25%) and 10 controls (43%) had impaired fasting glucose, and 7 patients with cancer (35%) and 8 controls (35%) exhibited impaired glucose tolerance. When analyzed as either a continuous or categorical variable (normal vs impaired), neither fasting nor postprandial glucose values could discriminate between the oncology cohort and participants without cancer (Table 2). Similarly, calculated indices for insulin sensitivity (HOMA2-S) and β-cell function (HOMA2-B) were not different between cases and controls (Table 2).
Relationship between malignancy, BMI, and ISI
We directly measured whole-body glucose use (M) and insulin sensitivity (ISI) by hyperinsulinemic euglycemic clamp. During clamp, patients with cancer and controls exhibited similar insulin-stimulated glucose use (M) (Table 2; Figure 1). However, ISI was significantly greater in the oncology cohort compared with participants without cancer (Table 2; Figure 1).
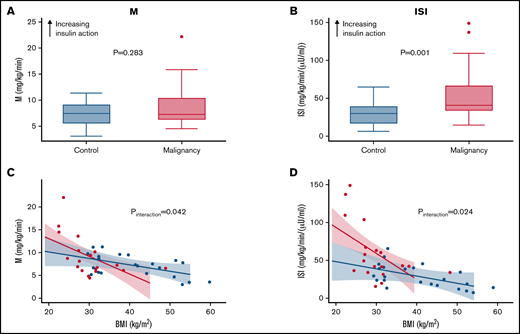
Malignancy amplifies the negative effect of obesity on insulin sensitivity. (A) Clamp-derived M in controls and patients with hematologic malignancies. (B) Clamp-derived whole-body ISI in controls and patients with hematologic malignancies. (C) Linear relationship between BMI and M across the study groups. (D) Linear relationship between BMI and clamp-derived ISI across the study groups. (C-D) Red and blue lines depict results for malignancy and control cohorts, respectively. Decreasing M and ISI values indicate lower insulin sensitivity and impaired glucose disposal.
Malignancy amplifies the negative effect of obesity on insulin sensitivity. (A) Clamp-derived M in controls and patients with hematologic malignancies. (B) Clamp-derived whole-body ISI in controls and patients with hematologic malignancies. (C) Linear relationship between BMI and M across the study groups. (D) Linear relationship between BMI and clamp-derived ISI across the study groups. (C-D) Red and blue lines depict results for malignancy and control cohorts, respectively. Decreasing M and ISI values indicate lower insulin sensitivity and impaired glucose disposal.
To test the hypothesis that patients with cancer would exhibit greater insulin resistance with increasing obesity, BMI was plotted against either M or M/I, stratified by history of malignancy. Figure 1C-D shows the differential slopes for the linear relationship between BMI and M and M/I, respectively. The effect of BMI on M and ISI was greater among patients with cancer (β = −0.30 units; 95% confidence interval [CI], −0.60 to −0.01; P interaction = .042 and β = −2.6 units; 95% CI, −4.8 to −0.4; P interaction = .024, respectively). As BMI increased, insulin sensitivity seemed to decrease at an accelerated rate for oncology patients compared with individuals without cancer.
Initial assessment with univariable linear regression showed that increasing BMI and history of cancer were associated with lower and higher ISI, respectively (Table 3). After adjustment for sex, race, and BMI, patients with cancer continued to demonstrate increased ISI (β = 104 units; 95% CI, 26.7-181.2; P = .010), and they showed greater reduction in ISI compared with controls with increasing BMI (β = −2.6 units; 95% CI, −4.8 to −0.44.6; P interaction = 0.024; Table 3). The sequentially adjusted models with either M or ISI as a dependent variable are presented in supplemental Table 1.
Unfortunately, the contribution of lean muscle to fat cannot be determined in the calculation of BMI. To account for this potential problem, we repeated our analysis using waist/hip ratio, which might be a better measure of central obesity.23,24 Waist/hip ratio was calculated by dividing waist circumference by hip circumference. All waist and hip measurements were obtained uniformly by trained staff at the Vanderbilt Clinical Research Center. After controlling for sex, race, and waist/hip ratio, patients with cancer still exhibited increased ISI (β = 238.7 units; 95% CI, 95.8-471.7; P = .004), and they showed greater reduction in ISI compared with controls with increasing waist/hip ratio (β = −273 units; 95% CI, −475.2 to −70.9; P interaction = .010; supplemental Table 2). Thus, the malignancy interaction effect remained significant when analyzed using 2 different anthropometric indices. The sequentially adjusted models incorporating waist/hip ratio instead of BMI as a covariable with either M or ISI as a dependent variable are outlined in supplemental Table 2.
Insulin clearance
Because M values were similar for patient cases and controls, differences in ISI (M/I) seemed to be driven by lower plasma insulin levels among the oncology patients (Table 2). To determine if insulin metabolism differed between the groups, insulin clearance during clamp was calculated as insulin infusion rate divided by average plasma insulin concentration. Despite receiving identical doses of insulin (80 mU/m2/min), plasma insulin levels were higher in controls, with a corresponding decrease in insulin clearance, compared with patients with malignancies (Table 2). Unlike with ISI, we did not detect a significant interaction between BMI and cancer with respect to insulin clearance (P = .598; supplemental Figure 1). In multivariable models, patients with cancer continued to have greater insulin clearance compared with controls after adjustment for demographic differences (supplemental Table 3).
Inflammatory markers
Inflammation has been implicated in altered glucose homeostasis. To determine if immune dysfunction contributes to diabetes susceptibility among cancer survivors, inflammatory cytokines were analyzed. Despite having less adiposity, oncology patients exhibited significantly higher plasma concentrations of IL-6 (median, 3.06 pg/mL; IQR, 2.31-4.92 vs median, 1.61; IQR, 1.03-2.37; P = .005) and elevations in MCP-1 (median, 263.46 pg/mL; IQR, 225.78-395.68 vs median, 206.71 pg/mL; IQR, 166.69-242.53; P = .006) compared with individuals without malignancy (Figure 2). Differences between the plasma concentrations of IL-1α, TNF-α, and IL-1RA were not significant. The median (IQR) levels of all cytokine levels in each group are provided in supplemental Table 4.
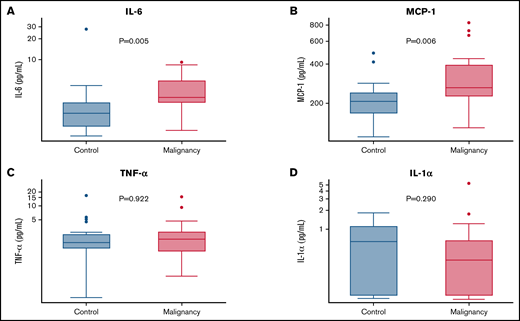
Inflammatory metabolic cytokines are elevated in the plasma of patients with hematologic malignancies. Y-axes are log transformed in all graphs. (A) IL-6. (B) TNF-α. (C) MCP-1. (D) IL-1α.
Inflammatory metabolic cytokines are elevated in the plasma of patients with hematologic malignancies. Y-axes are log transformed in all graphs. (A) IL-6. (B) TNF-α. (C) MCP-1. (D) IL-1α.
Lastly, IL-6 and MCP-1 were analyzed as covariates in the ISI regression models to determine if these cytokines were associated with insulin sensitivity. After multivariable analysis, log MCP-1 but not log IL-6 was an independent predictor of ISI, with higher concentrations of MCP-1 predicting lower insulin sensitivity (β = −19.3 units; 95% CI, −37.5 to −1.1; P = .039). Furthermore, the interaction between malignancy and BMI remained significant after adjustment for log IL-6 (β = −2.26 units; 95% CI, −4.51 to −0.02; P interaction = 0.048) or log MCP-1 (β = −2.5 units; 95% CI, −4.6 to 0.4; P interaction = 0.021; supplemental Table 1).
Discussion
Cancer survivors are up to 5 times more likely to develop type 2 diabetes than the general population, and ∼30% of cancer survivors are obese, with a BMI ≥30 kg/m2.25 Development of diabetes in oncology patients is associated with reduced quality of life and higher mortality.26 It is unclear how malignancy increases type 2 diabetes risk, and advances in our understanding could lead to highly beneficial prevention and treatment strategies. As a novel finding, we demonstrate the effect modification between cancer and BMI on insulin sensitivity. The interaction analysis showed that patients with hematologic malignancies exhibit greater insulin resistance with increasing BMI compared with individuals without cancer. If confirmed, this finding could explain the excess risk of diabetes development among oncology patients and may inform surveillance and management strategies for cancer survivors. Specifically, our data point toward obesity and insulin resistance as targets for intervention. Lifestyle changes and weight-neutral or weight loss–promoting treatments for insulin resistance and type 2 diabetes, such as metformin, GLP-1 agonists, or sodium glucose cotransporter 2 inhibitors, could be used to improve the wellbeing and outcomes of cancer survivors.
The connections between adiposity, insulin resistance, and cancer are compelling but not completely understood.27 A large Korean cohort study reported that malignancy including blood cancers increases the risk of new-onset diabetes even after accounting for precancer metabolic risk factors.2 Furthermore, a meta-analysis of 7 cross-sectional studies with 3550 participants showed that hematologic malignancy survivors are at increased risk of metabolic syndrome.28 Metabolic syndrome is a cluster of clinical findings, including abdominal obesity, hyperglycemia, dyslipidemia, and hypertension, that arises from insulin resistance and increases the risk of type 2 diabetes. Therefore, strong epidemiologic evidence exists to support an association between hematologic malignancies and insulin resistance and diabetes development.
In our study, insulin action was directly measured. Contrary to what would be predicted by the epidemiologic studies, patients with hematologic malignancies were more insulin sensitive than individuals without cancer. This result was likely driven by the higher BMI and lower insulin clearance in the noncancer group. Weight loss resulting from chemotherapy, lifestyle changes after cancer diagnosis, or increased physical activity could also contribute to reduced body weight, improved insulin sensitivity, and possibly greater insulin uptake/clearance by skeletal muscle among cancer survivors. Furthermore, the oncology cohort was recruited during HCT evaluation. Because transplantation candidates require a baseline level of fitness and were primarily White, we cannot rule out patient selection bias as a cause for the greater insulin sensitivity and higher insulin clearance among cancer survivors.
Along with enhanced insulin sensitivity within the oncology group, we also showed an effect modification indicating that cancer amplifies insulin resistance as BMI increases. At first, these findings seem inconsistent; however, these data could be complementary in explaining the risk of diabetes and cardiovascular disease in cancer survivors. Obesity has become a leading but preventable cause of cancer in the United States and in the world.29-31 Our data suggest that adiposity is one of the key events responsible for initiating insulin resistance among individuals either with or without cancer. However, as BMI increases, oncology patients may have a more pronounced drop in insulin sensitivity compared with individuals without cancer. The cooccurrence of obesity in a significant proportion of cancer survivors could exacerbate insulin resistance and compound downstream cardiometabolic effects, including impaired glucose metabolism, endothelial dysfunction, and cardiovascular disease. Understanding effect modification between cancer and BMI, as well as the underlying mechanisms, could guide physicians in preventing the negative outcomes of insulin resistance and metabolic syndrome.
Malignancy, obesity, and diabetes are characterized by immune dysfunction and chronic inflammation.32 Along with cytokine-induced cancer cachexia, clonal disorders involving somatic mutations of DNMT3A, TET2, and ASXL1 result in changes of innate immunity, leading to increases of various cytokines including IL-1β, IL-6, TNF-α, IL-8, and IL-13 in studies of clonal hematopoiesis and myeloid malignancy.33,34 Similarly, elevations of IL-1β, IL-6, TNF-α, and MCP-1 are observed with obesity-induced insulin resistance.20-22 To test if immune dysregulation could explain the effect modification between cancer and BMI on insulin sensitivity, inflammatory markers were analyzed. Despite being less obese, the group with cancer had greater inflammation, as measured by plasma IL-6 and MCP-1 levels. This result may reflect the myeloid predominance (60%) in our oncology cohort, which was generally enriched with DTA mutations. Unfortunately, small numbers precluded further analysis by mutation type (eg, DNMT3A, TET2, and ASXL1). Although oncology patients exhibited greater IL-6 and MCP-1 levels, only elevated MCP-1 was a significant determinant of insulin resistance in multivariable models. It is important to note that cytokine levels fluctuate with time, and concentrations can vary based on the tissue analyzed. There are also conflicting data with regard to the positive vs negative effects of some cytokines. For IL-6, transient elevations could be beneficial, whereas sustained increases could have adverse metabolic effects.35 We also show that the interactions between malignancy and BMI remained significant even after adjustment for cytokines. Collectively, these data suggest that inflammation contributes to lower insulin sensitivity, but inflammatory cytokines were not the underlying cause of the magnified effect of obesity on insulin resistance among cancer survivors. The molecular mechanisms causing the effect modification between cancer and BMI remain to be elucidated.
Major strengths of this study include the direct measurement of the action of insulin in vivo with the gold standard, hyperinsulinemic euglycemic clamp. For this investigation, we did not rely on surrogate measures or need to identify disease states affiliated with insulin resistance. Additionally, because patients with established diabetes were excluded via prospective questioning, medical record review, and OGTT, the chance of preexisting diabetes confounding the measured effect of cancer on insulin sensitivity was minimized.
The study had several limitations. By design, we focused on adults with high-risk hematologic malignancies undergoing first allogeneic HCT evaluation. Therefore, it is unclear if our findings can be extrapolated to pediatric cancers or malignancies not routinely referred for allogeneic transplantation, including solid tumors, Hodgkin lymphoma, or multiple myeloma. All oncology patients received conventional treatment before metabolic testing; therefore, we could not distinguish between malignancy vs chemotherapy effect on insulin sensitivity. For pragmatic purposes, our analysis focused on BMI as a surrogate measure of obesity. BMI is a common and convenient measure of body composition, but it has limitations and may underestimate obesity, especially in women.36 Because of sex differences in the study population, this bias could have led to even greater adiposity than that predicted by BMI for controls. To help address this problem, we repeated our analysis using waist/hip ratio instead of BMI and obtained similar results and observed no effect of sex on these findings. Future studies will need to incorporate dual-energy x-ray absorptiometry scanning to more accurately measure body composition in patients with cancer. Despite the modest sample size, our results remained significant even after adjustment for clinical differences in multivariable models. However, the relationship between BMI and insulin resistance is complex and most likely nonlinear. Because of sample size, we were unable to accommodate nonlinearity in our regression models. Larger studies are needed to confirm our results and adjust for additional covariates without overfitting.37
The connections between obesity, inflammation, type 2 diabetes, and malignancy are extremely complex. We show that patients with cancer had elevations in cytokines involved in both inflammation and metabolic disease; however, not all oncology patients developed insulin resistance. Instead, we show that cancer survivors exhibited augmented reductions in insulin sensitivity with increasing BMI compared with controls without malignancy, which could then predispose to diabetes development. With the exception of adolescents and young adults, there are no specific guidelines for screening and prevention of diabetes in adult survivors of cancer. If confirmed, dissemination of these data to the oncology community could lead to (1) improved opportunities for early lifestyle intervention and education, (2) research to address whether cancer survivors require more aggressive screening or treatment schedules for hypertension, dyslipidemia, obesity, or impaired glucose tolerance than those recommended by standard guidelines, and (3) earlier referrals to specialists, including endocrinologists, cardio-oncologists, or survivorship clinics for metabolic risk factor management. Our data provide mechanistic insights linking cancer to metabolic disease through changes in insulin sensitivity. Inflammation likely contributes to this metabolic derangement; however, additional research will be needed to elucidate the precise causes for the effect modification between cancer and BMI on insulin sensitivity.
Acknowledgments
The authors thank Bhagirathbhai Dholaria, Feng Sha, and Thomas G. Stewart for their contribution.
This study was supported by National Heart, Lung, and Blood Institute, National Institutes of Health (NIH), grants 1K23HL122143-01A and 1R01HL141943-01 (B.G.E.), National Center for Advancing Translational Sciences, NIH grant UL1TR000445 (Vanderbilt Clinical and Translational Science Award), and National Institute of Diabetes and Digestive and Kidney Diseases, NIH, grants DK117875 (J.M.L.) and DK020593 and DK059637 (Vanderbilt Diabetes Research and Training Center).
Authorship
Contribution: M.S. analyzed and interpreted data and wrote the manuscript; M.M. conducted experiments, analyzed data, and revised the manuscript; D.K.J. assisted with the experiments and revised the manuscript; T.A.I. assisted with the interpretation of the data and revised the manuscript; and J.M.L. and B.G.E. designed the research, conducted experiments, interpreted the data, and revised the manuscript.
Conflict-of-interest disclosure: The authors declare no competing financial interests.
Correspondence: Brian G. Engelhardt, Vanderbilt University Medical Center, 3927 The Vanderbilt Clinic, Nashville, TN 37232; e-mail: brian.engelhardt@vumc.org.