Key Points
Larotrectinib has clinical activity in adult Ph-like acute lymphoblastic leukemia with ETV6-NTRK3 rearrangements.
ETV6-NTRK3 rearrangements can be cryptic and subclonal in Ph-like ALL at diagnosis and selected for with aggressive therapy.

Abstract
Philadelphia chromosome (Ph)–like acute lymphoblastic leukemia (ALL) is a subtype of Ph-negative ALL that molecularly resembles Ph-positive ALL. It shares the adverse prognosis of Ph-positive ALL, but lacks the BCR-ABL1 fusion oncogene. Instead, Ph-like ALL is associated with alternative mutations in signaling pathways. We describe a case of Ph-like ALL that harbored 2 genomic alterations, which activated signaling, an NRASGly12Asp mutation, and an ETV6-NTRK3 rearrangement. Initially, the NRAS mutation was detected at high frequency, whereas the gene fusion was only detectable with a targeted next-generation sequencing-based fusion assay, but not by fluorescence in situ hybridization analysis. The disease failed to respond to multiagent chemotherapy but investigational CD19-directed chimeric antigen receptor T-cell therapy resulted in a complete remission. However, the leukemia relapsed after 6 weeks. Intriguingly, the NRAS mutation was extinguished during the chimeric antigen receptor T-cell therapy and did not contribute to the relapse, which was instead associated with a rise in ETV6-NTRK3. The relapsed leukemia progressed with further chemo- and immunotherapy but was controlled for 6 weeks with substantial leukemic cytoreduction using the TRK inhibitor larotrectinib. Unfortunately, recovery of normal hematopoiesis was only marginal and the patient eventually succumbed to infections. These results demonstrate that larotrectinib has clinical activity in ETV6-NTRK3-associated Ph-like ALL.
Introduction
Treatment and prognosis of Philadelphia chromosome (Ph)+–like acute lymphoblastic leukemia (ALL) have markedly improved with drugs targeting the oncogenic tyrosine kinase BCR-ABL1.1 In Ph− ALL, targets for similar small molecule drugs are elusive in most cases. However, 2 research groups identified a subgroup of Ph− ALL cases, termed Ph-like ALL or BCR-ABL1-like ALL, which resembles Ph+ ALL with similar associated mutations including IKZF1, similarities in gene expression, and a poor prognosis.2,3 Ph-like ALL commonly harbors genomic alterations activating alternative pathways, including ABL, JAK-STAT, RAS, and tropomyosin receptor tyrosine kinase (TRK) signaling.4 Some of these have been targeted experimentally and clinically, but the development of optimal treatment strategies is only beginning.5 TRK alterations occur in ∼1% of cases of Ph-like ALL.6
Methods
Next-generation sequencing of candidate genes associated with hematological malignancies
A clinically validated Anchored Multiplex polymerase chain reaction (PCR)–based assay7,8 (Heme SNaPshot v3) was used for the detection of single nucleotide variants and insertion/deletions (indels) in 103 genes recurrently mutated in hematological malignancies, using the ArcherDx platform and Illumina NextSeq next-generation sequencing. Briefly, genomic DNA extracted from bone marrow (BM) aspirate, blood, unstained smears, or FFPE specimens was enzymatically sheared, end-repaired, adenylated, and ligated with a half-functional adapter. A sequencing library targeting hotspots and full exons was generated using 2 heminested PCR reactions. Illumina NextSeq 2 × 151 base paired-end sequencing results were aligned to the hg19 human genome reference. An ensemble-based variant calling approach and a laboratory-developed hotspot caller were applied for single nucleotide variant and indel variant detection.
Fusion detection
A clinically validated Anchored Multiplex PCR-based targeted assay (heme fusion assay v2) was used for detection of fusion transcripts involving genes more commonly rearranged in hematological malignancies using next-generation sequencing.8,9 Briefly, total nucleic acid was isolated from blood, BM aspirate, or smears or FFPE tissue. Double-stranded complementary DNA was created then end-repaired, adenylated, and ligated with a half-functional adapter. Two heminested PCR reactions using ArcherDx Heme Fusion kit primers were performed to create a fully functional sequencing library that targets 86 genes (exons). Illumina NextSeq 2 × 151 base paired-end sequencing results were aligned to the hg19 human genome reference with BWA-MEM10 ; a laboratory-developed algorithm was then used for fusion transcript detection and annotation through split-read analysis of primary and secondary alignments. Two recurrent ETV6-NTRK3 isoforms were observed in the fusion data, where the dominant isoform always demonstrated fusion of ETV6 exon 4 to NTRK3 exon 15 of the standard transcript of NTRK3 (NM_001012338.2), whereas the minor isoform demonstrated fusion of ETV6 exon 4 to NTRK3 exon 15 of an alternative transcript of NTRK3 (NM_001007156.2). The ratio of fusion transcripts (spanning the ETV6-NTRK3 junction of either isoform) over wild-type transcripts (spanning the ETV6 exon 4 to exon 5 junction) was calculated for each of the time points fusion assay testing was performed.
Cytogenetic analysis and FISH
GTG-banded metaphases were obtained from unstimulated 24-hour BM cultures according to standard cytogenetic protocols. Interphase fluorescence in situ hybridization (FISH) was performed on remaining fixed pellet BM cultures, and on 5-micron FFPE tissue sections from the lymph node specimen slides according to standard genetic protocols and the manufacturer’s recommended hybridization conditions. FISH probes were purchased from Abbott Molecular (Des Plaines, IL), Vysis LSI ETV6 (Cen) and Vysis LSI ETV6 (Tel) probes at 12p13, to identify any 12p13 rearrangement; Vysis LSI TP53 SpectrumOrange/CEP17 SpectrumGreen probe at 17p13.1 and D17Z1 at 17p11.1-q11.1 were used to identify del(17p); and centromeric probes for chromosomes 8 and 9 were used to identify trisomy 8 and monosomy 9, respectively. For NTRK3 rearrangements we used a break-apart probe set targeting the 5′ upstream region (RP11-110O23, green probe) and the 3′ downstream region of NTRK3 (RP11-267B23, red probe). Well-delineated fluorescence signals were screened in at least 100 nuclei and 50 nuclei, on fixed pellets and on 5-micron tissue sections, respectively. In all samples, a considered positive result was based on the cutoff value used by our laboratory for each probe.
Immunohistochemistry
Immunohistochemistry with a pan-TRK (anti-TrkA, anti-TrkB, and anti-TrkC) antibody was performed by Paradigm Diagnostics as described.11
Treatments
Informed consent was obtained for treatment including participation in 3 institutional review board–approved trials (NCT02228772, 17033, 18410).
Results and discussion
A 61-year-old man presented with Legionella pneumonia and pancytopenia. Workup established a diagnosis of B-ALL with 95% blasts (Figure 1A-B) positive for CD19, CD10, TdT, CD34, and HLA-DR, but negative for CD20 and myeloperoxidase. Analysis demonstrated an abnormal karyotype, including deletion 17p (TP53 deletion confirmed by FISH), monosomy 9, and trisomy 10 (Figure 2A), but no t(9;22) or BCR-ABL1 by reverse transcriptase-PCR. Sequencing7 revealed mutations in IKFZ1 (p.Ser258Ter, variant allelic frequency [VAF] 71.6%), ETV6 (p.Lys384TyrfsTer11, VAF 52.9%), CREBBP (c.3836+2_3836+3insGGGG splice region variant, VAF 45.5%), and NRAS (p.Gly12Asp, VAF 40.4%) (Figure 3A). The IKFZ1 and ETV6 mutations result in truncated, functionally crippled proteins that act as dominant negatives of the respective normal proteins in B-ALL.3,12 CREBBP mutations have also been described in B-ALL.13 Finally, a targeted RNA-based assay to detect gene fusions (heme fusion assay)9 revealed a low amount (29 unique fusion reads) of ETV6-NTRK3 chimeric transcripts, in which the oligomerization domain of the transcription factor ETV6 (exons 1-4) is joined to a truncated neutrotrophin-3 receptor (NTRK3, exon 15 gene end, including its tyrosine kinase domain), identical to a previously described alteration in a patient with AML14 (Figure 3B-C; supplemental Figure 1). Unlike the ETV6 p.Lys384TyrfsTer11 mutation, ETV6-NTRK3 fusions do not involve the ETV6 DNA binding domain, so these 2 ETV6 alterations are independent. Cytogenetic analysis did not reveal the translocation t(12;15)(p13;q25) associated with ETV6-NTRK315 and, at this early time, we were unable to demonstrate ETV6 rearrangements by FISH (100 nuclei scored; Figure 3E), indicating that the frequency of the fusion was below the detection limit of these assays. Together, our findings established the diagnosis of Ph-like B-ALL. The low frequency of ETV6-NTRK3 fusions at diagnosis and early in the course of treatment (Figure 3C-D) suggested that it was initially not the dominant oncogene.
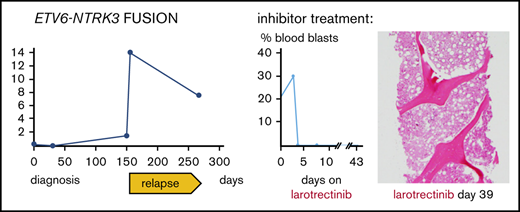
![Clinical course and treatment response. (A) Blood LDH levels in synopsis with treatments over time. (B) Initial bone marrow aspirate (left; Wright-Giemsa stain, magnification ×100) and histology (right; hematoxylin and eosin [H&E] stain, magnification ×20). (C) Positron emission tomography scan of the neck with enhanced signal in lymph nodes and lymphoid tissues (left, arrows) and lymph node histology showing leukemia infiltration (right; H&E, magnification ×4). (D) Leukemia cutis in skin biopsy. Magnification ×4. (E) Core biopsy demonstrating bone marrow leukemia in progressive relapse (H&E, magnification ×10). (F) Response to larotrectinib represented by blood blast counts over time (left) and bone marrow biopsy histology (middle and right; H&E, magnification ×4). (G) Autopsy results. (a) Gomori methenamine-silver stain demonstrating invasive aspergillosis. Magnification ×20. (b-c) Bone marrow histology (H&E) showing paucicellular areas, abundant necrosis, rare patches of viable leukemia (short arrows), and histiocytes and myeloid elements (long arrows). Magnification ×4 (b) and ×100 (c). (d) Necrotic lymph node (H&E, magnification ×4). (e) Normal skin (H&E, magnification ×10). (A-G) Days refer to time from diagnosis, except in panel F, which shows days from larotrectinib treatment start. Blin, blinatumomab; Crizo; crizotinib; CSC, consolidation chemotherapy; HAM, high-dose cytarabine and mitoxantrone; IC, induction chemotherapy; Ino, inotuzumab; LDC, lymphodepletion chemotherapy.](https://ash.silverchair-cdn.com/ash/content_public/journal/bloodadvances/4/1/10.1182_bloodadvances.2019000769/3/m_advancesadv2019000769f1.png?Expires=1768333926&Signature=2g2sxUaSekGxyhfMJM0rNRXHHsRBe0NHhMTpVJnFJdyTuxzneuFeh-wKtLGAeGnyOeelo5E0VnQPsItVsc7esM9a0DGASbxS-jV-JPQzNhxXRwo6vk4-cA91PG1HBUTBvzl98dS~T-lwXw5tWyedoaheKfodHbxzZ1ztOc8zitwY9UM6GrWkw8W78cAbXFATg4hyFI0bXOlV0njdmR~yI8QXTHp1-Tabxlv9X4gojWjmDIphG-lzSHtnTHQ23fDAZ~ixwXcDiqNOOcX90kuMS3-ro2vjk8voDH2UrKYgw9oKitoM7WjlXAZLYWkVkbmOfoOxZYG4NzYDP2~gN75CMg__&Key-Pair-Id=APKAIE5G5CRDK6RD3PGA)
Clinical course and treatment response. (A) Blood LDH levels in synopsis with treatments over time. (B) Initial bone marrow aspirate (left; Wright-Giemsa stain, magnification ×100) and histology (right; hematoxylin and eosin [H&E] stain, magnification ×20). (C) Positron emission tomography scan of the neck with enhanced signal in lymph nodes and lymphoid tissues (left, arrows) and lymph node histology showing leukemia infiltration (right; H&E, magnification ×4). (D) Leukemia cutis in skin biopsy. Magnification ×4. (E) Core biopsy demonstrating bone marrow leukemia in progressive relapse (H&E, magnification ×10). (F) Response to larotrectinib represented by blood blast counts over time (left) and bone marrow biopsy histology (middle and right; H&E, magnification ×4). (G) Autopsy results. (a) Gomori methenamine-silver stain demonstrating invasive aspergillosis. Magnification ×20. (b-c) Bone marrow histology (H&E) showing paucicellular areas, abundant necrosis, rare patches of viable leukemia (short arrows), and histiocytes and myeloid elements (long arrows). Magnification ×4 (b) and ×100 (c). (d) Necrotic lymph node (H&E, magnification ×4). (e) Normal skin (H&E, magnification ×10). (A-G) Days refer to time from diagnosis, except in panel F, which shows days from larotrectinib treatment start. Blin, blinatumomab; Crizo; crizotinib; CSC, consolidation chemotherapy; HAM, high-dose cytarabine and mitoxantrone; IC, induction chemotherapy; Ino, inotuzumab; LDC, lymphodepletion chemotherapy.
Clinical course and treatment response. (A) Blood LDH levels in synopsis with treatments over time. (B) Initial bone marrow aspirate (left; Wright-Giemsa stain, magnification ×100) and histology (right; hematoxylin and eosin [H&E] stain, magnification ×20). (C) Positron emission tomography scan of the neck with enhanced signal in lymph nodes and lymphoid tissues (left, arrows) and lymph node histology showing leukemia infiltration (right; H&E, magnification ×4). (D) Leukemia cutis in skin biopsy. Magnification ×4. (E) Core biopsy demonstrating bone marrow leukemia in progressive relapse (H&E, magnification ×10). (F) Response to larotrectinib represented by blood blast counts over time (left) and bone marrow biopsy histology (middle and right; H&E, magnification ×4). (G) Autopsy results. (a) Gomori methenamine-silver stain demonstrating invasive aspergillosis. Magnification ×20. (b-c) Bone marrow histology (H&E) showing paucicellular areas, abundant necrosis, rare patches of viable leukemia (short arrows), and histiocytes and myeloid elements (long arrows). Magnification ×4 (b) and ×100 (c). (d) Necrotic lymph node (H&E, magnification ×4). (e) Normal skin (H&E, magnification ×10). (A-G) Days refer to time from diagnosis, except in panel F, which shows days from larotrectinib treatment start. Blin, blinatumomab; Crizo; crizotinib; CSC, consolidation chemotherapy; HAM, high-dose cytarabine and mitoxantrone; IC, induction chemotherapy; Ino, inotuzumab; LDC, lymphodepletion chemotherapy.
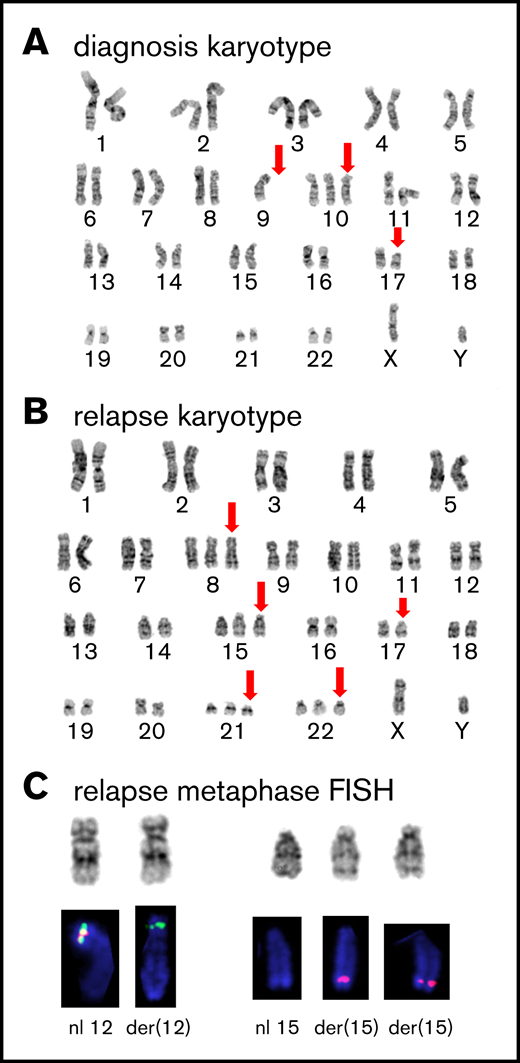
Cytogenetic analysis. (A) GTG-banded representative karyotype at diagnosis showing a 46,XY,-9,+10,del(17)(p11.2) karyotype; abnormal or absent chromosome marked by red arrows. (B) Representative karyotype during relapse showing a 50,XY, +8,+15,del(17)(p11.2), +21,+22 karyotype; abnormal chromosomes marked by red arrows. (C) Partial FISH analysis on chromosomes 12 and 15 demonstrate the cryptic rearrangement t(12;15)(p13q26) and the additional der(15)t(12;15): the 3′ETV6(Cen) signal (green) remains on der(12)t(12;15), and 2 copies of the 5′ETV6 (Tel) signal (red) translocated on 2 copies of der(15)t(12;15).
Cytogenetic analysis. (A) GTG-banded representative karyotype at diagnosis showing a 46,XY,-9,+10,del(17)(p11.2) karyotype; abnormal or absent chromosome marked by red arrows. (B) Representative karyotype during relapse showing a 50,XY, +8,+15,del(17)(p11.2), +21,+22 karyotype; abnormal chromosomes marked by red arrows. (C) Partial FISH analysis on chromosomes 12 and 15 demonstrate the cryptic rearrangement t(12;15)(p13q26) and the additional der(15)t(12;15): the 3′ETV6(Cen) signal (green) remains on der(12)t(12;15), and 2 copies of the 5′ETV6 (Tel) signal (red) translocated on 2 copies of der(15)t(12;15).
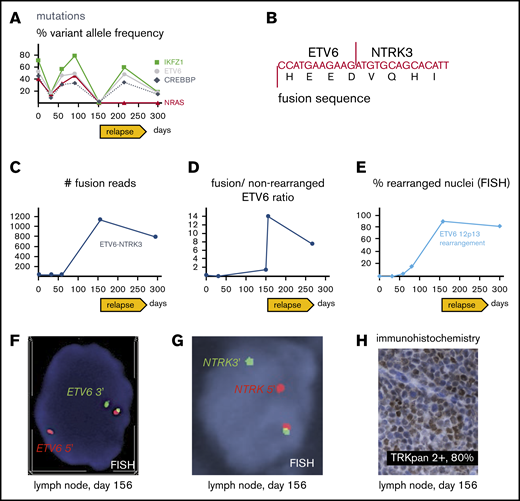
Molecular pathology results. (A) Targeted next-generation sequencing of DNA from bone marrow aspirates with allelic frequency of pathogenic mutations. (B) Sequence of ETV6-NTRK3 transcript revealed with the fusion assay; for more detailed information, see supplemental Figure 1. (C) Number of unique ETV6-NTRK3 fusion reads in bone marrow aspirates (days 1, 32, 59, 295) and lymph node (day 156). (D) Ratio of fusion transcripts (ETV6 exon 4-NTRK3 exon 15) over wild-type transcript (ETV6 exon 4-ETV6 exon 5) from bone marrow aspirates (days 1, 32, 150, 266) and lymph node (day 156). (E) FISH of bone marrow aspirates (day 1, 32, 59, 80, 295) and lymph node (day 156). (F) FISH from lymph node showing break apart of 5′ (red) and 3′ (green) ETV6 probes revealing rearrangement as split-apart red and green signals as well the normal locus (unseparated red-green pair with yellow overlap). Magnification ×100. (G) FISH from lymph node showing break apart of 5′ (red) and 3′ (green) probes recognizing regions upstream and downstream of NTRK3, respectively; rearrangement resulting in split-apart red and green signals as well the normal locus (unseparated pair with yellow overlap). Magnification ×100. (H) Immunohistochemical stain revealing aberrant expression of TRK in lymph node. Magnification ×40. (A-H) Days refer to time from diagnosis.
Molecular pathology results. (A) Targeted next-generation sequencing of DNA from bone marrow aspirates with allelic frequency of pathogenic mutations. (B) Sequence of ETV6-NTRK3 transcript revealed with the fusion assay; for more detailed information, see supplemental Figure 1. (C) Number of unique ETV6-NTRK3 fusion reads in bone marrow aspirates (days 1, 32, 59, 295) and lymph node (day 156). (D) Ratio of fusion transcripts (ETV6 exon 4-NTRK3 exon 15) over wild-type transcript (ETV6 exon 4-ETV6 exon 5) from bone marrow aspirates (days 1, 32, 150, 266) and lymph node (day 156). (E) FISH of bone marrow aspirates (day 1, 32, 59, 80, 295) and lymph node (day 156). (F) FISH from lymph node showing break apart of 5′ (red) and 3′ (green) ETV6 probes revealing rearrangement as split-apart red and green signals as well the normal locus (unseparated red-green pair with yellow overlap). Magnification ×100. (G) FISH from lymph node showing break apart of 5′ (red) and 3′ (green) probes recognizing regions upstream and downstream of NTRK3, respectively; rearrangement resulting in split-apart red and green signals as well the normal locus (unseparated pair with yellow overlap). Magnification ×100. (H) Immunohistochemical stain revealing aberrant expression of TRK in lymph node. Magnification ×40. (A-H) Days refer to time from diagnosis.
The patient was first treated on a phase 1 study16 combining the protease inhibitor ixazomib with prednisone, vincristine, doxorubicin, cyclophosphamide, asparaginase, and intrathecal therapy (Figure 1A). This resulted in clearance of blood blasts and recovery of blood counts, but bone marrow biopsies after the first and second therapy cycle revealed refractory disease (>70% blasts), so the study treatment was discontinued.
ETV6 FISH in the BM following multiagent chemotherapy revealed 4% rearrangements (day 59 after diagnosis; Figure 3E) suggesting that the clone carrying ETV6-NTRK3 had increased during therapy. He was then treated with crizotinib (250 mg by mouth twice daily), a multiple kinase inhibitor with activity in experimental ETV6-NTRK3 models4 together with 6MP and steroids (Figure 1A) for 20 days but BM and blood lymphoblast counts increased on therapy. Moreover, ETV6 FISH revealed 16% rearrangements in the bone marrow (day 80 after diagnosis; Figure 3E), indicating crizotinib failure.
At this point, the patient elected to participate in a trial of an investigational CD19-directed chimeric antigen receptor T-cell (CAR-T) therapy, which included conditioning chemo-immunotherapy for lymphodepletion (Figure 1A). His CAR-T treatment was complicated by grade 3 cytokine release syndrome and grade 3 neurotoxicity (Lee criteria17 ) requiring tocilizumab, anakinra, and steroids, but he rapidly recovered blood production without detectable leukemia. He was discharged home 20 days after infusion in a complete remission (Figure 1A).
At 6 weeks following CAR-T infusion, the patient relapsed with generalized lymphadenopathy confirmed with a biopsy of a cervical lymph node (Figure 1A,C). A BM biopsy demonstrated only minor leukemic involvement (∼7% blasts) with normal blood counts. However, his disease continued to progress despite salvage treatment with blinatumomab18 (Figure 1A,D; progression with leukemia cutis after less than 3 weeks), inotuzumab19 (Figure 1A,E; progression after 4 weeks with pancytopenia and 80% blasts in the bone marrow), and high-dose cytarabine with mitoxantrone20 (Figure 1A; initial myeloablation but persistent pancytopenia followed by rising blood blasts, leukemia cutis, and lymphadenopathy).
Notably, at remission following CAR-T therapy, cytogenetic analysis demonstrated a normal karyotype and mutations were markedly decreased or absent (Figure 3A). At relapse, the IKFZ1 (VAF, 59.8%), ETV6 (VAF, 48%), and CREBBP-mutations (VAF, 34%) reemerged (Figure 3A). In contrast, the NRAS mutation, which persisted after multiagent chemotherapy and was detected at all time points before CAR-T cell therapy, remained undetectable after relapse (VAF, 0%) (Figure 3A). This suggested that it extinguished with the pressure of immunotherapy, consistent with previous data demonstrating that NRAS mutations can be selected against or persist during chemotherapy in different circumstances.21
Cytogenetic analysis after relapse revealed a second cytogenetically related subclone that was not detected early in the disease. Specifically, the analysis demonstrated persistence of 17p loss, but acquisition of additional chromosomes 8, 14, 21, and 22 and absence of the chromosome 9 deletion detected at diagnosis (Figure 2B). Subsequently, metaphase FISH studies confirmed that this second clone exhibited a cryptic t(12;15) consistent with the ETV6-NTRK3 rearrangement (Figure 2C). Moreover, analysis of data from the fusion assay revealed that fusion transcripts (ETV6 exon 4–NTRK3 exon 15) increased sharply compared with unrearranged ETV6 transcript (ETV6 exon 4–ETV6 exon 5) after relapse (Figure 3D). Consistent with this, ETV6 rearrangements were detectable by interphase FISH in 45/50 blast nuclei off/from the lymph node (Figure 2E-F) and, similarly, NTRK3 rearrangements were demonstrated in 50/50 blast nuclei from the lymph node (Figure 3G). Accordingly, immunohistochemistry confirmed TRK protein expression, which is absent in normal lymphoid tissue11 (Figure 2H). Together, these data suggest that the relapse was associated with an expansion of an ETV6-NTRK3 rearranged subclone.
Based on these findings, the patient enrolled on a single-patient protocol in an expanded access program for larotrectinib, an agent with activity against ETV6-NTRK3–driven solid tumors22 (Figure 1A,F). At the start of oral monotherapy treatment (100 mg twice per day), he had a poor performance status (Eastern Cooperative Oncology Group performance scale 4). By day 4 of treatment, peripheral blood blasts became undetectable (Figure 1F). On day 6, palpable lymphadenopathy and leukemia cutis resolved and a biopsy revealed an ablated BM with only a few scattered blasts (Figure 1F). By day 15, the lactic dehydrogenase (LDH) blood levels, which had correlated with disease activity,23 had normalized (Figure 1A). He did experience clinical benefit, had no apparent side effects, and was able to spend a week at home. The leukemia did not overtly return during 42 days of larotrectinib treatment, and the patient’s LDH level remained normal (Figure 1A). However, blood counts showed only little recovery, and the patient eventually succumbed to multifocal angioinvasive aspergillosis (Figure 1Ga). The autopsy showed extensive tumor necrosis in the BM with rare areas of viable leukemic cells and very rare areas with nonleukemic hematopoietic activity (Figure 1Gb-c). The lymph nodes showed extensive necrosis without viable leukemia, and no leukemia cutis was seen. (Figure 1Gd-e). Sequencing of the NTRK3 kinase domain did not show larotrectinib resistance-associated mutations, specifically p.G623R and p.G696A.24
In conclusion, we demonstrate that larotrectinib has powerful clinical activity in a case of Ph-like ALL with an ETV6-NTRK3 fusion in agreement with preclinical studies.6,25-27 The case emphasizes the necessity for aggressively searching for pathogenic fusions that can be cytogenetically cryptic. Moreover, it highlights the importance of treatment timing. ETV6-NTRK3 was initially not the dominant mutation and barely detectable. Yet, it was selected with multiple chemo- and immunotherapies and, ultimately, drove the relapse. We speculate that earlier treatment with larotrectinib might result in better outcomes. The failure of blood cell recovery was likely related to his multiple lines of prior treatment because myelosuppression was not frequently seen with larotrectinib during the treatment of solid tumors.22 Because larotrectinib has very recently been approved for NTRK fusion-associated solid tumors irrespective of histology,28 it is now more accessible, and our data reinforce that its use in Ph-like ALL should be further explored.
Acknowledgments
The authors thank the patient and his family for participation in research studies. The authors also thank Cynthia McLaughlin and Casey Keagan for expert technical assistance and Aura Ramos and Tina Som for clinical research support.
H.H. was supported by a Hyundai Hope on Wheels Scholar Grant.
Authorship
Contribution: V.N. and H.H. made figures, designed research, and wrote the paper; N.K., M.E.B., and H.H. wrote the larotrectinib protocol; V.N., A.M.D., H.K.T., and P.D.C. performed experiments; and all authors interpreted data and edited the manuscript.
Conflict-of-interest disclosure: N.K. is employed by Loxo Oncology, a subsidiary of Eli Lilly. The remaining authors declare no competing financial interests.
Correspondence: Hanno Hock, Massachusetts General Hospital Cancer Center, 185 Cambridge St, CPZN 4212, Boston, MA 02114; e-mail: hock.hanno@mgh.harvard.edu.