Key Points
N-methylated thrombospondin-1 mimetic peptides selectively kill the leukemic CD5+ B cells, sparing mature and precursor nontumor cells.
CD47 peptide triggering eliminates drug-resistant CLL cells by inducing an original form of cell death regulated by G proteins.

Abstract
Chronic lymphocytic leukemia (CLL), the most common adulthood leukemia in Western countries, is a very heterogeneous disease characterized by a peripheral accumulation of abnormal CD5+ B lymphocytes in the immune system. Despite new therapeutic developments, there remains an unmet medical need for CLL. Here, we demonstrate that the use of N-methylated thrombospondin-1 (TSP-1)–derived peptides is an efficient way to kill the malignant CLL cells, including those from high-risk individuals with poor clinical prognosis, del11q, del17p, 2p gain, or complex karyotype. PKT16, our hit N-methylated peptide, triggers the elimination of the leukemic cells, sparing the nontumor cells, including the hematopoietic precursors, and reduces the in vivo tumor burden of a CLL-xenograft mice model. A complementary analysis underscores the improved cytotoxic efficiency of PKT16 compared with the previously described TSP-1–derived probes, such as PKHB1. PKT16 elicits an original caspase-independent programmed necrotic mode of cell death, different from necroptosis or ferroptosis, implicating an intracellular Ca2+ deregulation that provokes mitochondrial damage, cell cycle arrest, and the specific death of the malignant CLL cells. The activation of the Gαi proteins and the subsequent drop of cyclic adenosine monophosphate levels and protein kinase A activity regulate this cytotoxic cascade. Remarkably, PKT16 induces the molecular hallmarks of immunogenic cell death, as defined by the calreticulin plasma membrane exposure and the release of adenosine triphosphate and high-mobility group box 1 protein from the dying CLL cells. Thus, PKT16 appears to be able to stimulate an anticancer in vivo immune response. Collectively, our results pave the way toward the development of an efficient strategy against CLL.
Introduction
Chronic lymphocytic leukemia (CLL) is a heterogeneous disease in terms of genetic characteristics and response to treatments. CLL is characterized by an accumulation of monoclonal B cells (CD20+, CD5+, and CD23+) in the peripheral blood, bone marrow, and secondary lymphoid organs, which result in the letdown of the immune system. CLL prognosis is dependent on clinical staging and biological markers, including IGHV status, cytogenetic abnormalities, and the presence of critical NOTCH1, SF3B1, MYD88, or TP53 mutations.1,-3 The most classical CLL chromosomal abnormalities are the deletions of the long arm of chromosome 13 (del13q) and chromosome 11 (del11q), the deletion of the short arm of chromosome 17 (del17p), and trisomy 12. Patients with B cells presenting dysfunction relevant to the TP53 gene have the poorest prognosis.4 Other recurrent abnormalities, such as 2p gain, 8q gain, 8p deletion, or 14q deletion are also involved in the progression of this pathology.5,-7 From a clinical point of view, according to the Binet classification, there are 3 clinical-biological stages (A, B, C), which take into account the invasion of lymphoid organs and cytopenias. Only stages A/B with active disease and C are treated.8,9
Although apparent remissions have been obtained with recent treatments, CLL remains an incurable disease with inevitable relapses and the appearance of resistance to conventional drugs.10 The treatments usually prescribed are the combination of fludarabine-cyclophosphamide-rituximab (FCR), the inhibitors of B-cell receptor signaling (ibrutinib, idelalisib), or the antagonist of Bcl-2 (venetoclax).9 Unfortunately, these therapies are often accompanied by adverse effects or favored mutations associated to drug resistance (eg, in the BTK, PLCγ2, or Bcl-2 proteins).11,-13 Therefore, a medical need for CLL is still unmet, and it appears crucial to develop alternative therapeutic approaches.
To this end, we have demonstrated that the use of agonist peptides that mimic the CD47 binding epitope of the thrombospondin-1 (TSP-1) can induce caspase-independent programmed cell death (PCD) in CLL cells.14,15 The CD47 binding appears essential in the cytotoxicity induced by these peptides. Indeed, the disruption of the peptide-CD47 interaction by SIRPαFc (a fusion protein designed to specifically bind CD47) leads to the inhibition of the cytotoxicity induced by the peptide.15 Independent from its TSP-1-mediated PCD function, CD47 serves as a “don’t-eat-me signal” by binding to SIRPα on phagocytes.16 Alternative cancer therapies using CD47-SIRPα-blocking agents have been recently developed.17,,,-21 A bispecific antibody targeting CD47 and CD1922 and an antibody inhibiting the macrophage immune checkpoint by blocking CD4723 have been proposed as strategies to eliminate non-Hodgkin's leukemic B cells. Other approaches, such as the use of SIRPαFc, have also been proven to have a therapeutic benefit.24
In this work, we generated PKT16, an original N-methylated TSP-1 mimetic peptide that induces PCD in CLL cells more efficiently than the previously described peptides, and that is protected from the aggregation phenomenon characterizing the nonmethylated probes. In addition, we corroborated the specificity of PKT16 in inducing death in malignant cells (sparing mature immune cells and hematopoietic progenitors), we tested its efficiency in reducing tumor burden in a CLL mouse model, and finally, we uncovered key molecular determinants regulating the PCD pathway activated by PKT16 in the CLL cells.
Methods
Patients, B-cell purification, and culture conditions
Mononuclear cells were purified from blood samples, using a standard Ficoll-Hypaque gradient, and immune cell subsets were isolated with magnetic selective sorting. Primary cells and the OSU-CLL cell line were cultured in complete medium (RPMI 1640 supplemented with 10% fetal calf serum and 100 U/mL penicillin-streptomycin).
Flow cytometry
Assessments were performed in a FACSCanto II (BD Biosciences), and data were analyzed using FlowJo software. Annexin-V-APC (0.1 µg/mL; BD Biosciences) was used for the assessment of phosphatidylserine exposure, propidium iodide (PI; 0.5 µg/mL) for cell viability analysis.
Cell death induction and inhibition
We used fresh or thawed CLL samples presenting low levels of spontaneous apoptosis. To induce PCD, 2 × 10⁶/mL cells were treated at the times and concentrations indicated in the figure legends with the different peptides, erastin, tumor necrosis factor α, or with the anti-CLL drugs FCR (fludarabine, cyclophosphamide, rituximab), ibrutinib, idelalisib, or venetoclax (Selleckchem). Drug concentration and time treatment have been adapted to in vitro assays in which the spontaneous apoptosis associated to primary CLL cell culture is about 10% to 15%. To provide prosurvival microenvironment signals, IL-4 and sCD40L (50 ng/mL and 100 ng/mL; R&D Systems) were added to culture medium. Before inducing PCD, the different inhibitors or the fusion protein hSIRPα-Fc25,26 were added to the culture medium at the concentrations indicated in the figure legends.
Ca2+ measurement
Cells were loaded for 15 minutes at 37°C and 15 minutes at RT with 1 µM Fura2-AM and Pluronic acid (Life Technologies), washed in Ringer solution (in mM: 145 NaCl, 5.4 KCl, 2 CaCl2, 1 MgCl2, 10 glucose, 10 N-2-hydroxyethylpiperazine-N′-2-ethanesulfonic acid and 0.1% bovine serum albumin at pH 7.5 with NaOH). The cells were activated with PKT16 (100 µM) or venetoclax (4 nM) and then ionomycin (1 µM, maximum response), and were excited by 340- and 380-nm wavelengths. Fluorescence emission at 510 nm was recorded on an Infinite M1000 PRO plate reader (TECAN). Signals were computed into relative ratio units (340/380 nm) and were normalized to the first value according to the equation (F/F0)-1, where F is the fluorescence at a specific time and F0 is the fluorescence at time 0.
Cyclic adenosine monophosphate measurement
After treatment, 10 μL of cells (4 × 10⁶/mL) were transferred to 384-well plates for cyclic adenosine monophosphate (cAMP) level quantification with a homogeneous time resolved fluorescence (HTRF) assay (Cisbio, 62 am4PEB). Signal was quantified on an Infinite M1000 PRO plate reader (TECAN) at 665 and 620 nm. Results were expressed as nanomolar cAMP per million cells and normalized to the cAMP levels recorded in control nontreated cells.
Protein kinase A activity
Cells cultured at 1 × 10⁶/mL were treated or not with PKT16. Then, cells were lysed and 50 ng proteins analyzed in a microtiter plate from a colorimetric solid phase enzyme-linked immune-absorbent assay kit to detect protein kinase A (PKA) activity (Enzo Life Sciences; ADI-EKS-390A). PKA activity was quantified on an Infinite M1000 PRO plate reader (TECAN) at 450 nm. Results were expressed as nanograms active PKA per microgram proteins and normalized to the PKA activity recorded in control nontreated cells (set at 1.0).
HMGB1 extrusion
Cells were cultured at 4 × 10⁶/mL and treated or not with PKT16 (100 µM, 6 hours), and 10 µL supernatants were recovered to quantify high-mobility group box 1 protein (HMGB1) released by cells with an immunoassay enzyme-linked immunosorbent assay test (IBL-international). HMGB1 release was evaluated by absorbance measurement at 450 nm on an Infinite M1000 PRO plate reader (TECAN). Results were expressed as concentration of HMGB1 in cell culture supernatant and normalized to the mean of control nontreated cells (set at 1.0).
Adenosine triphosphate release
Cells were cultured at 4 × 10⁶/mL, treated or not with PKT16 (100 µM, 6 hours), and 20 µL supernatants was recovered to analyze adenosine triphosphate (ATP) cell release with the bioluminescent ENLITEN ATP detection assay (Promega). ATP release was evaluated by luminescence measurement at 560 nm on an Infinite M1000 PRO plate reader (TECAN). Results were expressed as concentration of ATP in cell culture supernatant and normalized to the mean of control nontreated cells (set at 1.0).
Animals
A total of 3 × 10⁶ OSU-CLL cells were xenografted into female Swiss Nude mice (Charles River). Mice bearing growing tumors with a volume of 60 to 150 mm3 were randomly assigned to the control (4NGG) or PKT16 groups. Intraperitoneal treatments of 4NGG or PKT16, 5 days per week at 10 mg/kg, were performed. Mice were weighed twice a week, and tumor growth was evaluated by the measurement of 2 perpendicular diameters with a caliper.
Results
PKT16, a N-methylated TSP-1 mimetic peptide with improved efficiency in inducing cell death in CLL cells
Our team has recently demonstrated that the use of serum-stable mimetic peptides (eg, PKHB1) is an effective way to induce PCD in malignant CLL B cells.15 Unfortunately, even if it appears effective in inducing PCD in vitro and in vivo,15,27 these peptides have a tendency to aggregate and precipitate (supplemental Figure 1A). This phenomenon is favored by the β-strand structure of the peptide and the concomitant β-sheet formation.27 The introduction of a methyl group in replacement of the amide proton of amino acids blocks the hydrogen bonding that stabilizes the β-sheet formation implicated in peptide aggregation. We thus performed a N-methyl amino acid scan in the PKHB1 sequence (kRFYVVMWKk), looking to identify a suitable position for the N-methylation that would not affect the PCD efficacy of the peptide. Among the resulting peptides, only a peptide in which the arginine (Arg; R) has been replaced by the corresponding N-methyl derivative (peptide 1) maintained a relevant cytotoxic activity (Figure 1A-1C). To further optimize our peptide, we investigated the effect of the methionine sulfur atom oxidation that is known to decrease peptide biological activity. With this in mind, we generated PKHB1 derivatives possessing sulfone (PKHB1-SO) or sulfoxide (PKHB1-SO2) groups and tested their biological PCD activity in the OSU-CLL cells.28 As described in Figure 1B, these oxidized PKHB1 derivatives are inefficient in inducing PCD. As a consequence, to avoid peptide oxidation, we replaced the methionine (Met; M) in peptide 1 for a norleucine, an amino acid bioisostere of methionine in which the sulfur atom is replaced by a methylene group (Figure 1C). This change resulted in a highly efficient N-methylated TSP-1 mimetic peptide, hereafter referred to as PKT16 (Figure 1D, left). In fact, PKT16 showed a cytotoxic half maximal effective concentration (EC50) lower than PKHB1 (Figure 1D, right). The improved EC50 of PKT16 has been fully confirmed in the OSU-CLL cell line (supplemental Figure 1B). Finally, as for PKHB1, we have validated the specific binding of PKT16 to CD47 by the disruption of the PKT16-CD47 interaction with hSIRPα-Fc (a fusion protein designed to specifically bind CD47),15 which led to the inhibition of PCD (supplemental Figure 1C). Overall, our data demonstrate that the peptide modifications performed in the PKHB1 backbone circumvent aggregation phenomena and generate a PCD-improved N-methylated TSP-1 mimetic peptide.
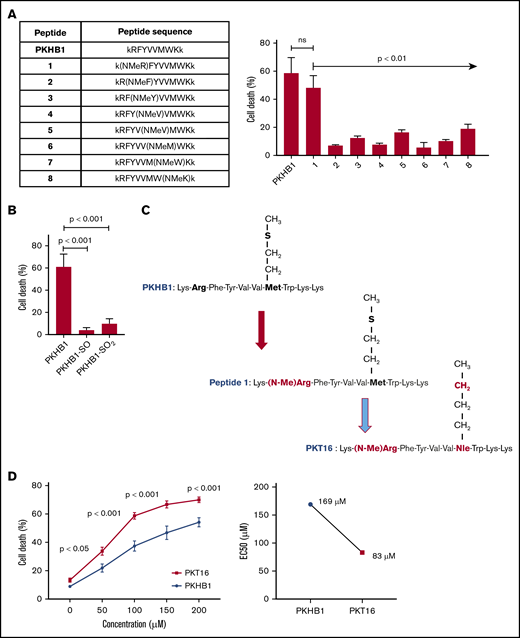
Generation of PKT16, a N-methylated TSP-1 mimetic peptide with improved efficiency in inducing PCD in the malignant CLL B cells. (A, left) Table enclosing the sequence of peptides generated by replacing the amino acids of the PKHB1 sequence with its N-methyl derivatives. (Right) After accounting for spontaneous PCD, cell viability was measured by Annexin-V/PI colabeling in the OSU-CLL cell line treated with the PKHB1-derived peptides described in the table (200 µM, 6 hours). The percentages, expressed as a histogram, refer to the Annexin-V-positive cells and are presented at mean ± standard deviation (SD). (B) The OSU-CLL cells were preincubated with PKHB1 or the derivatives PKHB1-SO and PKHB1-SO2, and cell viability was assessed by flow cytometry by Annexin-V/PI costaining. After accounting for spontaneous PCD, the percentages of Annexin-V-positive cells were graphed as a mean ± SD. (C) Primary structure of PKHB1, peptide 1, and PKT16. Compared with PKHB1, Arg2 and Met7 of PKHB1 were respectively replaced by N-methyl Arg (N-MeArg) and Nor-Leucine (NLe) (highlighted in red). (D, left) Cytotoxicity, measured by Annexin-V/PI colabeling in a panel of CLL B lymphocytes treated over the course of 6 hours with PKHB1 (n = 29) or the optimized peptide PKT16 (n = 42) at the indicated concentrations. The data, referring to Annexin-V positivity, are presented at mean ± standard error of the mean (SEM). (Right) The EC50 was calculated with the GraphPad Prism software by a nonlinear regression curve. Statistical significance was calculated by the Student t test. ns, not significant.
Generation of PKT16, a N-methylated TSP-1 mimetic peptide with improved efficiency in inducing PCD in the malignant CLL B cells. (A, left) Table enclosing the sequence of peptides generated by replacing the amino acids of the PKHB1 sequence with its N-methyl derivatives. (Right) After accounting for spontaneous PCD, cell viability was measured by Annexin-V/PI colabeling in the OSU-CLL cell line treated with the PKHB1-derived peptides described in the table (200 µM, 6 hours). The percentages, expressed as a histogram, refer to the Annexin-V-positive cells and are presented at mean ± standard deviation (SD). (B) The OSU-CLL cells were preincubated with PKHB1 or the derivatives PKHB1-SO and PKHB1-SO2, and cell viability was assessed by flow cytometry by Annexin-V/PI costaining. After accounting for spontaneous PCD, the percentages of Annexin-V-positive cells were graphed as a mean ± SD. (C) Primary structure of PKHB1, peptide 1, and PKT16. Compared with PKHB1, Arg2 and Met7 of PKHB1 were respectively replaced by N-methyl Arg (N-MeArg) and Nor-Leucine (NLe) (highlighted in red). (D, left) Cytotoxicity, measured by Annexin-V/PI colabeling in a panel of CLL B lymphocytes treated over the course of 6 hours with PKHB1 (n = 29) or the optimized peptide PKT16 (n = 42) at the indicated concentrations. The data, referring to Annexin-V positivity, are presented at mean ± standard error of the mean (SEM). (Right) The EC50 was calculated with the GraphPad Prism software by a nonlinear regression curve. Statistical significance was calculated by the Student t test. ns, not significant.
PKT16 kills the leukemic CLL cells with no detected resistance
The PCD response to PKT16 was verified in a cohort of 56 CLL patients with favorable and unfavorable prognostic features in the malignant B cells (supplemental Table 1). As described in Figure 2A-B, the PKT16-treated CLL cells underwent a rapid cell viability loss irrespective of the IGVH mutational status, 17p deletion, or other cytogenetic alterations associated with drug resistance, such as 11q deletion or 2p gain.29,30 PKT16 also induced cytotoxicity in CLL B cells presenting a complex karyotype (≥3 chromosomal abnormalities). From a therapeutic perspective, it is important to underline that CLL cells showing in vitro low PCD response to FCR, ibrutinib, idelalisib, or venetoclax remained significantly sensitive to PKT16 (Figure 2C). Interestingly enough, the combination of PKT16 with these drugs shows an additional PCD effect, strongly suggesting that PKT16 and the most commonly used anti-CLL drugs could be used in a combined therapy (Figure 2D). A complementary viability approach corroborated the additional effect of the combination PKT16 and the anti-CLL drugs (supplemental Figure 2).31 Altogether, these findings reveal that PKT16 kills the leukemic B cells with no detected resistance.
![PKT16 induces PCD in CLL cells with no detected resistance. (A) Patients from supplemental Table 1 were classified into IGVH mutated (IGHV-M) or unmutated (IGHV-UM; mutated-VH3-21 gene [V3-21*], conferring worse prognosis, has been included in this group) and absence of del17p (No del17p) or del17p and incubated with PKT16 (100 µM, 6 hours). Cell viability was measured by Annexin-V/PI colabeling. After accounting for spontaneous PCD, the percentages of Annexin-V positive cells were recorded and expressed as a histogram. Box plots represent the mean of cell death in each population with minimum to maximum values. (B) B cells from patients with CLL with del13q alone (n = 14), tri12 (n = 3), del11q (n = 7), del17p (n = 6), 2p gain (n = 3), complex karyotype (CK; n = 7), or without any of these cytogenetic abnormalities (Abs; n = 8) were untreated or treated with PKT16 (100 µM, 6 hours), and cell death, measured by Annexin-V/PI costaining, was recorded and graphed. Box plots represent the mean of cell death in each population with minimum to maximum values. (C) Cell death was measured in CLL cells presenting in vitro resistance to at least 1 drug used in the treatment of CLL. Cells were incubated either with the combination FCR (fludarabine 10 µM, cyclophosphamide 3 mM, rituximab 10 µg/mL), ibrutinib (15 µM), idelalisib (100 µM), venetoclax (4 nM), or PKT16 (100 µM) over the course of 24 hours, and cytotoxicity was assessed by flow cytometry by Annexin-V/PI colabeling. The percentages of Annexin-V-positive cells were recorded and expressed as a dot plot. The points represent the results obtained in the CLL cells from each individual, and the lines indicate the mean of the 8 patients tested. (D) CLL cells were left untreated (Control) or incubated over the course of 24 hours, either with low doses of FCR (fludarabine 1 µM, cyclophosphamide 2 mM, and rituximab 10 µg/mL), ibrutinib (10 µM), idelalisib (50 µM), venetoclax (2 nM), PKT16 (50 µM), or the combination of PKT16 and the different drugs, all at the above low doses. The PCD induced was assessed by Annexin-V/PI colabeling and the percentages of Annexin-V-positive cells were recorded and expressed as a histogram (n = 6). Note that the combination of PKT16 with each individual drug induced an additional PCD rate. (E) Cell death was evaluated as above in CLL cells untreated (Control) or treated with venetoclax (4 nM) or PKT16 (100 µM, 6 hours) in the absence (−) or presence of interleukin 4 (50 ng/mL) and CD40L (100 ng/mL; n = 5). Statistical significance was calculated in panels A and C by the Student t test and in panels B, D, and E by Mann-Whitney U test. Symbols and bars represent mean ± SD.](https://ash.silverchair-cdn.com/ash/content_public/journal/bloodadvances/3/20/10.1182_bloodadvances.2019000350/5/m_advancesadv2019000350f2.png?Expires=1766372818&Signature=vs1s~989SW4OfD1zuAa608VDL6~Nu8LI9~B5lxJ4WjSFvxR6J8P03YOSDKCamj3zHdYvjH4toTL1KaH8og-vQl~ndE8RPjQFkBHpIAC~BypEzug1Dd0skRwIkE2q8KqD0rgK6QyNycXJuV8DhEQZoGSVF30Rklt-NSpLbVX~E8EPVUBmn6v9xicEvOJdLaGNnyXBtoDzowxq7qpPldufLmLerXeF067c8xBg62VDCl3dFRq4BU5Tzgeb6pX8P5X8QX6Tcmf5rRjY7ET-o3anKmgm0B7~pWC1fGMdLS2Dn-eygQwI6OYzkTXnsZPlRWJPkeY25jkomFUGAvYTOASBxw__&Key-Pair-Id=APKAIE5G5CRDK6RD3PGA)
PKT16 induces PCD in CLL cells with no detected resistance. (A) Patients from supplemental Table 1 were classified into IGVH mutated (IGHV-M) or unmutated (IGHV-UM; mutated-VH3-21 gene [V3-21*], conferring worse prognosis, has been included in this group) and absence of del17p (No del17p) or del17p and incubated with PKT16 (100 µM, 6 hours). Cell viability was measured by Annexin-V/PI colabeling. After accounting for spontaneous PCD, the percentages of Annexin-V positive cells were recorded and expressed as a histogram. Box plots represent the mean of cell death in each population with minimum to maximum values. (B) B cells from patients with CLL with del13q alone (n = 14), tri12 (n = 3), del11q (n = 7), del17p (n = 6), 2p gain (n = 3), complex karyotype (CK; n = 7), or without any of these cytogenetic abnormalities (Abs; n = 8) were untreated or treated with PKT16 (100 µM, 6 hours), and cell death, measured by Annexin-V/PI costaining, was recorded and graphed. Box plots represent the mean of cell death in each population with minimum to maximum values. (C) Cell death was measured in CLL cells presenting in vitro resistance to at least 1 drug used in the treatment of CLL. Cells were incubated either with the combination FCR (fludarabine 10 µM, cyclophosphamide 3 mM, rituximab 10 µg/mL), ibrutinib (15 µM), idelalisib (100 µM), venetoclax (4 nM), or PKT16 (100 µM) over the course of 24 hours, and cytotoxicity was assessed by flow cytometry by Annexin-V/PI colabeling. The percentages of Annexin-V-positive cells were recorded and expressed as a dot plot. The points represent the results obtained in the CLL cells from each individual, and the lines indicate the mean of the 8 patients tested. (D) CLL cells were left untreated (Control) or incubated over the course of 24 hours, either with low doses of FCR (fludarabine 1 µM, cyclophosphamide 2 mM, and rituximab 10 µg/mL), ibrutinib (10 µM), idelalisib (50 µM), venetoclax (2 nM), PKT16 (50 µM), or the combination of PKT16 and the different drugs, all at the above low doses. The PCD induced was assessed by Annexin-V/PI colabeling and the percentages of Annexin-V-positive cells were recorded and expressed as a histogram (n = 6). Note that the combination of PKT16 with each individual drug induced an additional PCD rate. (E) Cell death was evaluated as above in CLL cells untreated (Control) or treated with venetoclax (4 nM) or PKT16 (100 µM, 6 hours) in the absence (−) or presence of interleukin 4 (50 ng/mL) and CD40L (100 ng/mL; n = 5). Statistical significance was calculated in panels A and C by the Student t test and in panels B, D, and E by Mann-Whitney U test. Symbols and bars represent mean ± SD.
PKT16 induces PCD in CLL cells with no detected resistance. (A) Patients from supplemental Table 1 were classified into IGVH mutated (IGHV-M) or unmutated (IGHV-UM; mutated-VH3-21 gene [V3-21*], conferring worse prognosis, has been included in this group) and absence of del17p (No del17p) or del17p and incubated with PKT16 (100 µM, 6 hours). Cell viability was measured by Annexin-V/PI colabeling. After accounting for spontaneous PCD, the percentages of Annexin-V positive cells were recorded and expressed as a histogram. Box plots represent the mean of cell death in each population with minimum to maximum values. (B) B cells from patients with CLL with del13q alone (n = 14), tri12 (n = 3), del11q (n = 7), del17p (n = 6), 2p gain (n = 3), complex karyotype (CK; n = 7), or without any of these cytogenetic abnormalities (Abs; n = 8) were untreated or treated with PKT16 (100 µM, 6 hours), and cell death, measured by Annexin-V/PI costaining, was recorded and graphed. Box plots represent the mean of cell death in each population with minimum to maximum values. (C) Cell death was measured in CLL cells presenting in vitro resistance to at least 1 drug used in the treatment of CLL. Cells were incubated either with the combination FCR (fludarabine 10 µM, cyclophosphamide 3 mM, rituximab 10 µg/mL), ibrutinib (15 µM), idelalisib (100 µM), venetoclax (4 nM), or PKT16 (100 µM) over the course of 24 hours, and cytotoxicity was assessed by flow cytometry by Annexin-V/PI colabeling. The percentages of Annexin-V-positive cells were recorded and expressed as a dot plot. The points represent the results obtained in the CLL cells from each individual, and the lines indicate the mean of the 8 patients tested. (D) CLL cells were left untreated (Control) or incubated over the course of 24 hours, either with low doses of FCR (fludarabine 1 µM, cyclophosphamide 2 mM, and rituximab 10 µg/mL), ibrutinib (10 µM), idelalisib (50 µM), venetoclax (2 nM), PKT16 (50 µM), or the combination of PKT16 and the different drugs, all at the above low doses. The PCD induced was assessed by Annexin-V/PI colabeling and the percentages of Annexin-V-positive cells were recorded and expressed as a histogram (n = 6). Note that the combination of PKT16 with each individual drug induced an additional PCD rate. (E) Cell death was evaluated as above in CLL cells untreated (Control) or treated with venetoclax (4 nM) or PKT16 (100 µM, 6 hours) in the absence (−) or presence of interleukin 4 (50 ng/mL) and CD40L (100 ng/mL; n = 5). Statistical significance was calculated in panels A and C by the Student t test and in panels B, D, and E by Mann-Whitney U test. Symbols and bars represent mean ± SD.
Moreover, given that the microenvironment plays a critical role in the progression and drug resistance of tumors,32 we have analyzed the effect of PKT16 in the presence of interleukin 4 and CD40L, 2 cytokines generated by lymphoid tissues and known to promote cell survival. Under these conditions, we observed that the responsiveness of the CLL cells to PKT16 remained unchanged (Figure 2E). Thus, contrary to other forms of PCD (eg, venetoclax-induced death), the PKT16-mediated killing is not downregulated by survival stimuli provided by the lymphocyte microenvironment.
PKT16 selectively kills the leukemic CLL cells, sparing nontumor cells
In view of a future therapeutic option for PKT16, it became relevant to demonstrate that this peptide is devoid of cytotoxicity in nontumor cells. Thus, we have analyzed the effect of PKT16 in mature immune subsets and in key hematopoietic progenitors, which appear important to allow a potential immune reconstitution. Of note, all the subsets tested similarly expressed CD47 (supplemental Figure 3A). As shown in Figure 3A and supplemental Figure 3B, PKT16 treatment killed the CD5+ tumor B cells while significantly sparing the T lymphocytes, natural killer cells, monocytes, and polynuclear cells from the patients with CLL. The selectivity of PKT16 in inducing death in the malignant cells was fully corroborated in cells from healthy donors, in which the treatment with the peptide was innocuous (Figure 3A; supplemental Figure 3C). And that was also the case even in the activated CD69+ nontumor B cells (Figure 3B). Similarly, PKT16 appeared to be inefficient in inducing PCD in the hematopoietic stem cells and the common myeloid and lymphoid progenitors (Figure 3C; supplemental Figure 3D). Thus, PKT16 selectively kills leukemic CD5+ B cells, sparing mature and precursor nontumor immune cells.
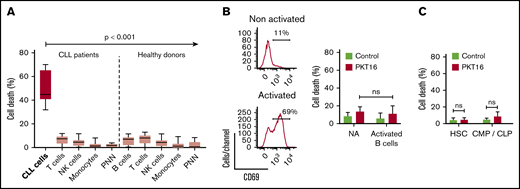
PKT16 selectively targets the malignant CLL cells. (A, left) CLL B cells (n = 6), T-cells (n = 9), natural killer (NK) cells (n = 5), monocytes (n = 5), and polynuclear neutrophils (PNN; n = 9) were isolated from patients with CLL and incubated with PKT16 (100 µM, 6 hours), and the cytotoxicity induced was evaluated by Annexin-V/PI colabeling. The percentages of Annexin-V-positive cells were recorded and graphed. (Right) B cells (n = 9), T cells (n = 10), NK cells (n = 10), monocytes (n = 11), and PNNs (n = 8) were isolated from healthy donors, treated with PKT16 (100 µM, 6 hours), and the PCD induced was assessed by flow cytometry as above. (B, left) Flow cytometry panels of CD69 staining performed on B cells before (not activated) and after activation with interleukin 4 (50 ng/mL) and CD40L (100 ng/mL; activated cells). Numbers indicate the percentages of CD69 positive cells. (Right) PCD was measured after PKT16 treatment (100 µM, 6 hours) by Annexin-V/PI colabeling in control (nonactivated; NA) and activated/gathered CD69-positive B cells. The percentages of Annexin-V-positive cells were recorded and expressed as a histogram (n = 6 donors). (C) Hematopoietic stem cells (HSC; n = 7) and common myeloid and lymphoid progenitors (CMP/CLP; n = 6) were purified from the bone marrow of healthy donors and incubated with PKT16 (100 µM, 6 hours). Cell death was assessed by Annexin-V/PI colabeling and the Annexin-V-positive cells were quantified and expressed as a percentage (n = 7 donors). Statistical significance was calculated by Mann-Whitney U test. Symbols and bars represent mean ± SD.
PKT16 selectively targets the malignant CLL cells. (A, left) CLL B cells (n = 6), T-cells (n = 9), natural killer (NK) cells (n = 5), monocytes (n = 5), and polynuclear neutrophils (PNN; n = 9) were isolated from patients with CLL and incubated with PKT16 (100 µM, 6 hours), and the cytotoxicity induced was evaluated by Annexin-V/PI colabeling. The percentages of Annexin-V-positive cells were recorded and graphed. (Right) B cells (n = 9), T cells (n = 10), NK cells (n = 10), monocytes (n = 11), and PNNs (n = 8) were isolated from healthy donors, treated with PKT16 (100 µM, 6 hours), and the PCD induced was assessed by flow cytometry as above. (B, left) Flow cytometry panels of CD69 staining performed on B cells before (not activated) and after activation with interleukin 4 (50 ng/mL) and CD40L (100 ng/mL; activated cells). Numbers indicate the percentages of CD69 positive cells. (Right) PCD was measured after PKT16 treatment (100 µM, 6 hours) by Annexin-V/PI colabeling in control (nonactivated; NA) and activated/gathered CD69-positive B cells. The percentages of Annexin-V-positive cells were recorded and expressed as a histogram (n = 6 donors). (C) Hematopoietic stem cells (HSC; n = 7) and common myeloid and lymphoid progenitors (CMP/CLP; n = 6) were purified from the bone marrow of healthy donors and incubated with PKT16 (100 µM, 6 hours). Cell death was assessed by Annexin-V/PI colabeling and the Annexin-V-positive cells were quantified and expressed as a percentage (n = 7 donors). Statistical significance was calculated by Mann-Whitney U test. Symbols and bars represent mean ± SD.
PKT16 enables an original caspase-independent programmed necrotic PCD pathway
To evaluate whether the peptide backbone adjustment performed to generate PKT16 modified the PLCγ1-mediated caspase-independent programmed necrotic pathway induced by the CD47 agonist peptides,15 we first confirmed that, contrary to the caspase-dependent PCD induced by venetoclax, the pretreatment of primary CLL cells with a caspase inhibitor (QVD.OPh) had no effect on PKT16-mediated killing (Figure 4A). Next, we corroborated that PKT16 generated a double AnnexinV/PI copositive staining characteristic of the programmed necrotic pathways (supplemental Figure 4A).15,33,-35 Finally, we demonstrated that the key enzyme PLCγ1 was also phosphorylated/activated in the PKT16-treated malignant cells (Figure 4B).

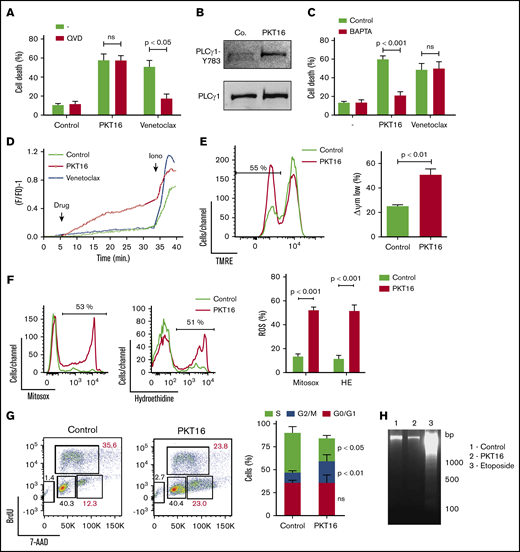
PKT16 treatment provokes cell cycle arrest and a mitochondrial type of caspase-independent PCD in CLL cells. (A) Cell viability was determined by Annexin-V/PI colabeling in CLL cells that were preincubated with the vehicle (−) or QVD (+) (1 µM, 20 minutes) and were treated with PKT16 (100 µM, 6 hours) or venetoclax (4 nM, 24 hours). The percentages refer to the Annexin-V-positive staining (n = 4). (B) PLCγ1-Y783 phosphorylation was detected by immunoblot analysis in untreated (Co.) or PKT16-treated (100 µM, 6 hours) B lymphocytes. Equal loading was confirmed by whole PLCγ1 detection. This blot was repeated 3 times with similar results. (C) Cell death was measured by Annexin-V/PI co-labeling in B cells untreated (−) or treated with PKT16 (100 µM, 6 hours) or venetoclax (4 nM, 24 hours) and preincubated with the vehicle (Control) or the external Ca2+ chelator BAPTA (10 mM, 30 minutes). Annexin-V positive cells were quantified and expressed as a percentage (n = 5). (D) Representative Ca2+ mobilization recorded with the Fura-2 dye in a fluorimeter in untreated (Control) and PKT16 (100 µM) or venetoclax-treated (4 nM) B cells. Ionomycin (Iono; 1 μM) was used as a control to show the maximum response. (E) The loss of ΔΨm was measured in the CLL B cells untreated (Control) or treated with PKT16 (100 µM, 6 hours). A representative flow cytometry plot is shown. The percentage in the cytofluorometric plot refers to cells with low ΔΨm after PKT16 treatment. The data from 5 patients are presented in a histogram. (F) Mitochondrial and cellular ROS levels were recorded by flow cytometry with the help of the mitosox and hydroethidine dyes in CLL B cells untreated (Control) or treated with PKT16 (100 µM, 6 hours). Percentages in the cytofluorometric plots refer to cells with high ROS levels. The data from 7 patients are presented in a histogram. (G) Flow cytometry cell cycle analysis performed in control and PKT16-treated (100 µM, 6 hours) OSU-CLL cells by BrdU and 7-AAD (DNA content) colabeling. (Left) Representative cytometric panels of control and PKT16-treated B cells. Percentages refer to cells in the indicated cell cycle phase. (Right) Percentage of cells in phases S, G2/M, and G0/G1 was quantified and expressed as a plot (n = 5). (H) Assessment of oligonucleosomal DNA fragmentation in OSU-CLL cells untreated (Control) or treated with PKT16 (100 µM, 6 hours) or etoposide (100 µM, 24 hours). This gel was repeated 3 times with similar results. Statistical significance in panels A, C, E, and F was calculated by the Student t test and by a Mann-Whitney U test in panel G. Symbols and bars represent mean ± SD.
PKT16 treatment provokes cell cycle arrest and a mitochondrial type of caspase-independent PCD in CLL cells. (A) Cell viability was determined by Annexin-V/PI colabeling in CLL cells that were preincubated with the vehicle (−) or QVD (+) (1 µM, 20 minutes) and were treated with PKT16 (100 µM, 6 hours) or venetoclax (4 nM, 24 hours). The percentages refer to the Annexin-V-positive staining (n = 4). (B) PLCγ1-Y783 phosphorylation was detected by immunoblot analysis in untreated (Co.) or PKT16-treated (100 µM, 6 hours) B lymphocytes. Equal loading was confirmed by whole PLCγ1 detection. This blot was repeated 3 times with similar results. (C) Cell death was measured by Annexin-V/PI co-labeling in B cells untreated (−) or treated with PKT16 (100 µM, 6 hours) or venetoclax (4 nM, 24 hours) and preincubated with the vehicle (Control) or the external Ca2+ chelator BAPTA (10 mM, 30 minutes). Annexin-V positive cells were quantified and expressed as a percentage (n = 5). (D) Representative Ca2+ mobilization recorded with the Fura-2 dye in a fluorimeter in untreated (Control) and PKT16 (100 µM) or venetoclax-treated (4 nM) B cells. Ionomycin (Iono; 1 μM) was used as a control to show the maximum response. (E) The loss of ΔΨm was measured in the CLL B cells untreated (Control) or treated with PKT16 (100 µM, 6 hours). A representative flow cytometry plot is shown. The percentage in the cytofluorometric plot refers to cells with low ΔΨm after PKT16 treatment. The data from 5 patients are presented in a histogram. (F) Mitochondrial and cellular ROS levels were recorded by flow cytometry with the help of the mitosox and hydroethidine dyes in CLL B cells untreated (Control) or treated with PKT16 (100 µM, 6 hours). Percentages in the cytofluorometric plots refer to cells with high ROS levels. The data from 7 patients are presented in a histogram. (G) Flow cytometry cell cycle analysis performed in control and PKT16-treated (100 µM, 6 hours) OSU-CLL cells by BrdU and 7-AAD (DNA content) colabeling. (Left) Representative cytometric panels of control and PKT16-treated B cells. Percentages refer to cells in the indicated cell cycle phase. (Right) Percentage of cells in phases S, G2/M, and G0/G1 was quantified and expressed as a plot (n = 5). (H) Assessment of oligonucleosomal DNA fragmentation in OSU-CLL cells untreated (Control) or treated with PKT16 (100 µM, 6 hours) or etoposide (100 µM, 24 hours). This gel was repeated 3 times with similar results. Statistical significance in panels A, C, E, and F was calculated by the Student t test and by a Mann-Whitney U test in panel G. Symbols and bars represent mean ± SD.
Because PLCγ1-Y783 catalyzes the formation of IP3, which leads to endoplasmic reticulum stress and cellular Ca2+ overload, we next verified whether PKT16 induced a Ca2+-mediated mode of PCD. This was first assessed by pretreating the CLL cells with the Ca2+ chelator BAPTA before incubation with PKT16, which, in contrast to that observed with venetoclax, significantly decreased PKT16-mediated death (Figure 4C). This result was substantiated by a fluorescence technology demonstrating that PKT16 incubation, not venetoclax treatment, provoked a sustained Ca2+ mobilization in the CLL cells (Figure 4D).
One of the hallmarks of PCD is the mitochondrial damage, characterized by a loss of the mitochondrial transmembrane potential (ΔΨm) and the overgeneration of reactive oxygen species (ROS). As seen in Figure 4E-F, PKT16 treatment of primary CLL cells resulted in a significant decrease in ΔΨm that was accompanied by the enhancement of the mitochondrial and cellular ROS levels. Therefore, it seems that the treatment of the CLL cells with PKT16 induces a Ca2+ overload that provokes PCD via mitochondrial damage. Next, to assess whether, as in other modes of Ca2+-mediated cell death,36 PKT16 treatment provoked modification in the cell cycle before PCD commitment, we performed BrdU/7-AAD co-staining in the OSU-CLL cells (primary CLL CD5+ cells are arrested in cell cycle G0/G1 stages, and only a minimal portion of the clone displays a proliferative activity). As depicted in Figure 4G, PKT16 treatment provoked an accumulation of the OSU-CLL cells in the G2/M phase (Figure 4G) that was not accompanied by the typical DNA fragmentation characterizing other PCD processes (Figure 4H). Even if the cell cycle behaviors of the PKT16-treated primary CLL cells and the OSU-CLL cell line are probably distinct, our data revealed new specific hallmarks to the killing induced by the TSP-1–derived peptides and demonstrated that the modifications in the backbone of PKT16 did not change the PCD signaling pathway enabled by the CD47 agonist peptides.
To gain insights into the characterization of PKT16-induced PCD, we next tested whether the mode of death triggered by PKT16 in CLL was related to 2 recently described programmed necrotic pathways: ferroptosis and necroptosis.37 To do this, we pretreated CLL cells with ferrostatin-1 and necrostatin-1 (respectively, ferroptosis and necroptosis inhibitors). As depicted in supplemental Figure 4B-C, these 2 inhibitors did not modulate PKT16-induced death. It is important to underline that, contrary to normal B cells, the CLL B cells appeared resistant to typical ferroptotic or necroptotic inductors, suggesting that the programmed necrotic way of death does not exist in CLL.38,39 However, in contrast to this assertion, our PKT16 data confirm that it is possible to enable programmed necrotic pathways in CLL distinct from ferroptosis and necroptosis.
PKT16-dependent PLCγ1-Y783 phosphorylation is mediated by the G proteins and modulated by cAMP levels and PKA activity
It has been reported, in cancer cell lines,40,41 that CD47 binds to the G proteins to activate PCD. Therefore, we analyzed whether the G proteins were involved in PKT16-induced death in primary CLL cells. As shown in Figure 5A and supplemental Figure 5A, pretreatment of CLL cells with suramin, a general G-protein inhibitor,42 precluded PKT16-mediated death. As a negative control, venetoclax-induced PCD was not modified by suramin pretreatment. Thus, the cytotoxicity induced by PKT16, not that induced by venetoclax, implicated the activation of the G-proteins. Next, we investigated which subfamily of G proteins was involved in PKT16-induced PCD. More precisely, before PKT16 treatment, we preincubated the CLL cells with forskolin, GP-2A, and gallein, respectively, which are inhibitors of the Gαi and Gαq subfamilies of the G-proteins and the βγ G-protein complex.43 Among these inhibitors, only forskolin significantly diminished PKT16-induced PCD (∼50% PCD reduction; Figure 5B; supplemental Figure 5B), unveiling that the Gαi proteins regulate this killing. As expected, forskolin is unable to modulate venetoclax-induced PCD in CLL (Figure 5B).
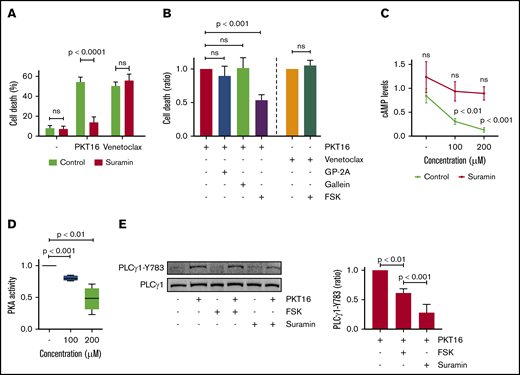
PKT16-induced PCD in CLL is mediated by heterotrimeric Gαi proteins and modulated by cAMP levels and PKA activity. (A) Cell death was measured in CLL cells preincubated with the vehicle (Control) or the protein G inhibitor suramin (100 µM, 20 minutes) and untreated (−) or treated with PKT16 (100 µM, 6 hours) or venetoclax (4 nM, 24 hours). After Annexin-V/PI costaining, the percentages of Annexin-V positive cells were recorded and graphed as a mean ± SD (n = 5). (B) Cell death was measured in CLL cells preincubated with the vehicle (Control) or the GP-antagonist 2A (protein Gαq inhibitor, 30 µM, 2 hours), gallein (protein G βγ dimer inhibitor, 30 µM, 2 hours), or forskolin (protein Gαi inhibitor, FSK, 100 µM, 2 hours) and treated with PKT16 (100 µM, 6 hours) or venetoclax (4 nM, 24 hours). After Annexin-V/PI colabeling, the percentages of Annexin-V-positive cells were recorded, graphed, and depicted as a ratio of PCD relative to B cells preincubated with the vehicle and treated with PKT16 or venetoclax (considered as the maximum of PCD induced for each drug, set at 1.0). Data are expressed as a mean ± SD (n = 6). (C) cAMP levels were evaluated by HTRF in CLL cells left untreated or treated with PKT16 at the indicated concentration and preincubated with the vehicle or the protein G inhibitor suramin (100 µM, 20 minutes). Data are expressed as a mean ± SD (n = 6). (D) PKA activity was evaluated by fluorescence in CLL cells treated with PKT16 (6 hours) at the indicated doses. Results are expressed as a ratio of PKA activity relative to untreated B cells (considered as a 100% of cellular PKA activity). Data are expressed as a mean ± SD (n = 6). (E) CLL cells were preincubated or not with FSK (100 µM, 2 hours) or suramine (100 µM, 20 minutes) and treated with PKT16 (100 µM, 6 hours) before PLCγ1-Y783 phosphorylation assessment by immunoblot. Equal loading was confirmed by whole PLCγ1 detection. The OD PLCγ1-Y783/PLCγ1 ratio depicted in the graph illustrates the PLCγ1-Y783 inhibition immunodetected in PKT16-treated CLL cells coincubated with FSK or suramin. Data are expressed as a mean ± SD (n = 3). The statistical significance in the figure was calculated by the Student t test.
PKT16-induced PCD in CLL is mediated by heterotrimeric Gαi proteins and modulated by cAMP levels and PKA activity. (A) Cell death was measured in CLL cells preincubated with the vehicle (Control) or the protein G inhibitor suramin (100 µM, 20 minutes) and untreated (−) or treated with PKT16 (100 µM, 6 hours) or venetoclax (4 nM, 24 hours). After Annexin-V/PI costaining, the percentages of Annexin-V positive cells were recorded and graphed as a mean ± SD (n = 5). (B) Cell death was measured in CLL cells preincubated with the vehicle (Control) or the GP-antagonist 2A (protein Gαq inhibitor, 30 µM, 2 hours), gallein (protein G βγ dimer inhibitor, 30 µM, 2 hours), or forskolin (protein Gαi inhibitor, FSK, 100 µM, 2 hours) and treated with PKT16 (100 µM, 6 hours) or venetoclax (4 nM, 24 hours). After Annexin-V/PI colabeling, the percentages of Annexin-V-positive cells were recorded, graphed, and depicted as a ratio of PCD relative to B cells preincubated with the vehicle and treated with PKT16 or venetoclax (considered as the maximum of PCD induced for each drug, set at 1.0). Data are expressed as a mean ± SD (n = 6). (C) cAMP levels were evaluated by HTRF in CLL cells left untreated or treated with PKT16 at the indicated concentration and preincubated with the vehicle or the protein G inhibitor suramin (100 µM, 20 minutes). Data are expressed as a mean ± SD (n = 6). (D) PKA activity was evaluated by fluorescence in CLL cells treated with PKT16 (6 hours) at the indicated doses. Results are expressed as a ratio of PKA activity relative to untreated B cells (considered as a 100% of cellular PKA activity). Data are expressed as a mean ± SD (n = 6). (E) CLL cells were preincubated or not with FSK (100 µM, 2 hours) or suramine (100 µM, 20 minutes) and treated with PKT16 (100 µM, 6 hours) before PLCγ1-Y783 phosphorylation assessment by immunoblot. Equal loading was confirmed by whole PLCγ1 detection. The OD PLCγ1-Y783/PLCγ1 ratio depicted in the graph illustrates the PLCγ1-Y783 inhibition immunodetected in PKT16-treated CLL cells coincubated with FSK or suramin. Data are expressed as a mean ± SD (n = 3). The statistical significance in the figure was calculated by the Student t test.
It is known that the Gαi proteins block the adenyl cyclase activity that generates most of the cellular cAMP. Thus, we tested whether the treatment of the CLL cells with PKT16 provoked changes in the cAMP cellular levels and the activity of the cAMP-dependent PKA. Verified by HTRF (cAMP) and colorimetric (PKA) approaches, we effectively detected a dose-dependent decrease in cAMP levels and PKA activity in the CLL cells treated with PKT16 (Figure 5C-D). Altogether, these data fully corroborate the implication of the Gαi proteins in the PKT16-mediated killing in CLL.
Finally, as seen in Figure 5E, we observed that the above-described PLCγ1-Y783 phosphorylation/activation associated with PKT16 treatment (Figure 4B) was markedly reduced by pretreating CLL cells with forskolin or suramin. Thus, there exists a relationship between heterotrimeric Gαi protein activation and PLCγ1-Y783 phosphorylation. This result also indicates that the activation of the Gαi proteins is upstream of the PLCγ1 phosphorylation associated with PKT16-mediated death. Overall, our results provide a sequence of events initiated by the activation of the Gαi proteins, the decrease of the cAMP levels, and the subsequent loss of the PKA activity. All these events are upstream of the PLCγ1-Y783 phosphorylation controlling this mode of PCD (Figure 6A).

The signaling pathway enabled by the TSP-1 mimetic peptides in CLL cells activates an immunogenic mode of cell death. (A) Schematic representation of the signaling pathway regulating CD47 peptide targeting in CLL. The PCD pathway enabled by the TSP-1 mimetic peptides in the malignant CLL cells (eg, PKT16) initiates by a CD47 triggering that leads to the activation of the heterotrimeric Gαi proteins and the subsequent decrease of the cAMP levels and PKA activity before phosphorylation of PLCγ1 at Y873. PLCγ1-Y873 cleaves phosphatidylinositol 4,5 bisphosphate (PIP2) into inositol 1,4,5-trisphosphate (IP3), which binds IP3 (IP3R) and ryanodine receptors (RyR) in the endoplasmic reticulum (ER) to provoke a deregulation in the intracellular/extracellular Ca2+ trafficking that induces mitochondrial damage and, finally, CLL cell death. (B) Induction of calreticulin (CALR) exposure by PKT16. CLL cells were treated for 6 hours with PKT16 (100 µM) and subjected to cytofluorometric assessment to detect CALR. (Left) Flow cytometry panels of CALR staining performed on CLL cells untreated (Control) or treated with PKT16 (100 µM, 6 hours). Numbers indicate the percentages of CALR-positive cells. Immunoglobulin G labeling was used as a negative control. (Right) Percentages of CALR-positive cells were recorded, graphed, and represented as a ratio relative to untreated CLL cells. Data are expressed as a mean ± SD (n = 10). Box plots represent the mean of cell death with minimum to maximum values. (C) Release of ATP from CLL cells exposed to PKT16. CLL cells were treated for 6 hours with PKT16 (100 µM), and extracellular ATP was measured in the culture supernatant, plotted, and represented as a ratio relative to untreated CLL cells. Data are expressed as a mean ± SD (n = 8). Box plots represent the mean of cell death with minimum to maximum values. (D) Exodus of nuclear HMGB1 from CLL cells exposed to PKT16. CLL cells were treated for 6 hours with PKT16 (100 µM), and the amounts of HMGB1 were measured in the culture supernatant, plotted, and represented as a ratio relative to untreated CLL cells. Data are expressed as a mean ± SD (n = 7). Box plots represent the mean of cell death with minimum to maximum values. The statistical significance in the figure was calculated by the Student t test.
The signaling pathway enabled by the TSP-1 mimetic peptides in CLL cells activates an immunogenic mode of cell death. (A) Schematic representation of the signaling pathway regulating CD47 peptide targeting in CLL. The PCD pathway enabled by the TSP-1 mimetic peptides in the malignant CLL cells (eg, PKT16) initiates by a CD47 triggering that leads to the activation of the heterotrimeric Gαi proteins and the subsequent decrease of the cAMP levels and PKA activity before phosphorylation of PLCγ1 at Y873. PLCγ1-Y873 cleaves phosphatidylinositol 4,5 bisphosphate (PIP2) into inositol 1,4,5-trisphosphate (IP3), which binds IP3 (IP3R) and ryanodine receptors (RyR) in the endoplasmic reticulum (ER) to provoke a deregulation in the intracellular/extracellular Ca2+ trafficking that induces mitochondrial damage and, finally, CLL cell death. (B) Induction of calreticulin (CALR) exposure by PKT16. CLL cells were treated for 6 hours with PKT16 (100 µM) and subjected to cytofluorometric assessment to detect CALR. (Left) Flow cytometry panels of CALR staining performed on CLL cells untreated (Control) or treated with PKT16 (100 µM, 6 hours). Numbers indicate the percentages of CALR-positive cells. Immunoglobulin G labeling was used as a negative control. (Right) Percentages of CALR-positive cells were recorded, graphed, and represented as a ratio relative to untreated CLL cells. Data are expressed as a mean ± SD (n = 10). Box plots represent the mean of cell death with minimum to maximum values. (C) Release of ATP from CLL cells exposed to PKT16. CLL cells were treated for 6 hours with PKT16 (100 µM), and extracellular ATP was measured in the culture supernatant, plotted, and represented as a ratio relative to untreated CLL cells. Data are expressed as a mean ± SD (n = 8). Box plots represent the mean of cell death with minimum to maximum values. (D) Exodus of nuclear HMGB1 from CLL cells exposed to PKT16. CLL cells were treated for 6 hours with PKT16 (100 µM), and the amounts of HMGB1 were measured in the culture supernatant, plotted, and represented as a ratio relative to untreated CLL cells. Data are expressed as a mean ± SD (n = 7). Box plots represent the mean of cell death with minimum to maximum values. The statistical significance in the figure was calculated by the Student t test.
PKT16 triggers immunogenic cell death
A large variety of the caspase-independent modes of PCD induce an effective antitumor immune response, named immunogenic cell death (ICD).44 ICD provokes the activation of a specific T-cell response that leads to in vivo tumor elimination.45 As PKT16, most of the agents inducing ICD implicate the targeting of the endoplasmic reticulum and the overproduction of ROS.44 Challenged by this possibility, we investigated whether PKT16 triggers ICD. To do this, we assessed 3 main ICD hallmarks, named DAMPs (damage-associated molecular patterns): the exposure of calreticulin (CALR) at the surface of the dying cells, where it functions as an “eat me” signal for professional phagocytes; the release of ATP, which functions as a “find me” signal for monocytes; and the HMGB1 exodus, which seems to be required for the optimal presentation of tumor antigens to dendritic cells.46 As shown in Figure 6, in CLL cells, PKT16 caused the induction of CALR exposure (Figure 6B), the increase in extracellular ATP levels (Figure 6C), and the exodus of HMGB1 into the culture supernatant (Figure 6D). Thus, PKT16 can induce ICD and would be able to stimulate the local immune reactions that provoke an anticancer in vivo immune response.
Treatment with PKT16 reduces CLL tumor burden in vivo
In view of the above results, we finally evaluated the in vivo effect of PKT16 on the growth of OSU-CLL xenographs in nude mice. Note that the OSU-CLL cell line responds to PKT16 in exactly the same way as primary CLL cells (supplemental Figures 1 and 4). Mice were treated intraperitoneally 5 days per week with the control peptide 4NGG (a TSP-1–derived peptide unable to induce death in CLL) or PKT16 at 10 mg/kg. After only 2 weeks of treatment, the PKT16-treated, but not the 4NGG-treated, mice had a significantly decreased tumor growth rate (∼60% of tumor volume diminution in PKT16-treated mice compared with 4NGG-treated mice) (Figure 7A-B). The analysis of the PKT16- and 4NGG-treated blood mice revealed similar red cell, white cell, and platelet counts (Figure 7C). Similarly, the percentage of granulocytes, monocytes, and lymphocytes was analogous in the PKT16- and 4NGG-treated mice (Figure 7D). The levels of hemoglobin, hematocrit, and mean cell volume indicated that PKT16 did not provoke anemia (Figure 7E). Importantly, no liver, kidney, spleen, or lymph nodes necrotic areas were found in the PKT16-treated mice (Figure 7F). Overall, these findings confirm that treatment with PKT16 reduces CLL tumor burden in vivo without detected adverse effects.
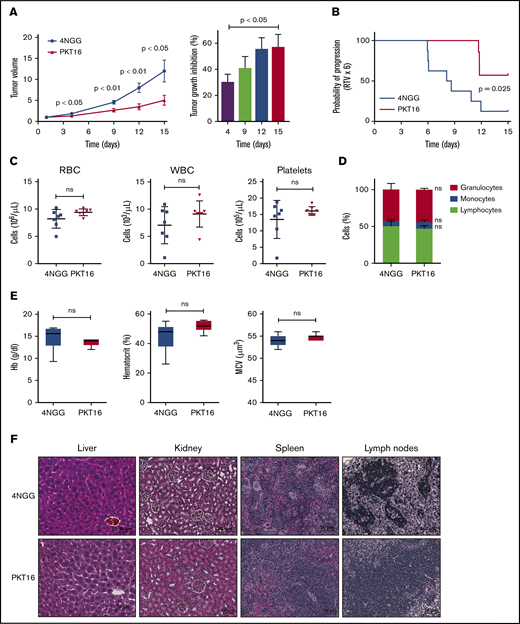
PKT16 reduces in vivo CLL tumor burden. (A) Nude mice were transplanted with OSU-CLL cells, as indicated in"Methods." When the tumors reached 60 to 150 mm2, mice received intraperitoneal injections of the control peptide 4NGG or PKT16 (10 mg/kg, 5 days per week), and tumor volume was measured at the indicated time using a caliper. The data are presented in the graph as the mean ± SEM (n = 8 mice per group). Contrary to 4NGG treatment, PKT16 significantly reduced the tumor volume. The percentage of tumor growth inhibition was calculated and depicted in a plot. P values correspond to statistical differences between the 4NGG and the PKT16 groups. (B) The probability of tumor progression overtime (RTV) after 4NGG and PKT16 mice treatment was represented as a curve and plotted. The graph indicated the probability of the OSU-CLL tumors to increase 6 times their volume after 4NGG or PKT16 treatment (RTV x 6). (C) Count of red blood cells (RBC), white blood cells (WBC), and platelets in 4NGG- and PKT16-treated OSU-CLL xenotransplanted mice (15 days of treatment, 8 mice per group). (D) Percentages of granulocytes, monocytes, and lymphocytes recorded after 15 days of treatment in 4NGG- and PKT16-treated mice (n = 8 mice per group). (E) Hemoglobin (Hb) concentration, hematocrit percentage, and mean cell volume (MCV) were assessed in 4NGG- and PKT16-treated mice (15 days of treatment). Box plots represent the mean of the data recorded in each population with minimum to maximum values (n = 8 mice per group). (F) Histological analysis of liver, kidney, spleen, and lymph nodes of 4NGG- and PKT16-treated mice at 15 days of treatment. Tissue sections were stained with hematoxylin-eosin-saffron. Representative images are shown. The statistical analysis included in this figure was performed with the Student t test, except panel B performed with the Wilcoxon test. Symbols and bars in panels A and B represent mean ± SEM.
PKT16 reduces in vivo CLL tumor burden. (A) Nude mice were transplanted with OSU-CLL cells, as indicated in"Methods." When the tumors reached 60 to 150 mm2, mice received intraperitoneal injections of the control peptide 4NGG or PKT16 (10 mg/kg, 5 days per week), and tumor volume was measured at the indicated time using a caliper. The data are presented in the graph as the mean ± SEM (n = 8 mice per group). Contrary to 4NGG treatment, PKT16 significantly reduced the tumor volume. The percentage of tumor growth inhibition was calculated and depicted in a plot. P values correspond to statistical differences between the 4NGG and the PKT16 groups. (B) The probability of tumor progression overtime (RTV) after 4NGG and PKT16 mice treatment was represented as a curve and plotted. The graph indicated the probability of the OSU-CLL tumors to increase 6 times their volume after 4NGG or PKT16 treatment (RTV x 6). (C) Count of red blood cells (RBC), white blood cells (WBC), and platelets in 4NGG- and PKT16-treated OSU-CLL xenotransplanted mice (15 days of treatment, 8 mice per group). (D) Percentages of granulocytes, monocytes, and lymphocytes recorded after 15 days of treatment in 4NGG- and PKT16-treated mice (n = 8 mice per group). (E) Hemoglobin (Hb) concentration, hematocrit percentage, and mean cell volume (MCV) were assessed in 4NGG- and PKT16-treated mice (15 days of treatment). Box plots represent the mean of the data recorded in each population with minimum to maximum values (n = 8 mice per group). (F) Histological analysis of liver, kidney, spleen, and lymph nodes of 4NGG- and PKT16-treated mice at 15 days of treatment. Tissue sections were stained with hematoxylin-eosin-saffron. Representative images are shown. The statistical analysis included in this figure was performed with the Student t test, except panel B performed with the Wilcoxon test. Symbols and bars in panels A and B represent mean ± SEM.
Discussion
Relapsed and drug-refractory patients with CLL face a critical medical need. The standard front-line therapies against this leukemia, the immunochemotherapy FCR, as well as the most recent treatments (eg, ibrutinib, idelalisib, or venetoclax) lack specificity for the patient’s tumor cells while generating mutations associated to refractoriness or undesirable adverse effects.11,-13 Here, taking advantage of a significant CLL cohort, which included cells from patients with favorable and unfavorable prognosis, we describe the possibility to use N-methylated TSP-1–derived peptides as a novel approach to broadly induce PCD in CLL. We also shed new light into the mechanism regulating the PCD pathway activated by these peptides.
TSP-1, which has been shown to bind CD47 via its COOH-terminal domain,47,-49 enables a PCD pathway in the leukemic CLL cells.14,50 Taking advantage of this specificity, TSP-1–derived peptides have been developed.15,27,40,51,52 Indeed, therapeutic peptides have several advantages over other drugs: they have higher affinity and specificity to interact with the targets and do not accumulate in the kidney, liver, or spleen, thus minimizing adverse effects. Here, we have generated PKT16 that, unlike previous TSP-1–derived peptides, is the first N-methylated peptide efficient in inducing death in CLL cells. PKT16 could offer therapeutic advantages, such as improved physical and chemical properties, specificity in provoking PCD in the malignant CD5+ B cells, no detected in vitro resistance in CLL (eg, active in high-risk patients), lack of down-modulation by cytokines known to promote cell survival/drug resistance, and induction of immunogenic cell death. Moreover, PKT16 is highly soluble, induces PCD rapidly, and significantly reduces in vivo tumor burden with no toxicity.
Our experiments demonstrated that CLL cells showing low PCD response to FCR, ibrutinib, idelalisib, or venetoclax are still sensitive to PKT16 treatment. Indeed, the way of death enabled by PKT16 appeared active even in the CLL B lymphocytes showing deficiencies associated with drug resistance. Thus, the fact that, in contrast to the anti-CLL drugs (eg, venetoclax), PKT16 uses a caspase-independent programmed necrotic mode of PCD seems key to the broad cytotoxic effect of the peptide. Similar to this, the activation of different PCD pathways by a combination of PKT16 and FCR, ibrutinib, idelalisib, or venetoclax causes an additional cytotoxic effect in CLL. A coupled treatment including PKT16 and 1 of these drugs appears as an interesting possibility to treat relapsed and refractory CLL.
Despite the similar expression of CD47 in the tested immune cell subsets, an important element of our work is the selectivity of PKT16 for the CD5+ malignant B cells. A possibility for the different response of the immune cells to PKT16 could be the conformation of CD47, its glycosylation state, or its specific partners in the malignant cells.49 Alternatively, our previous work revealed that PLCγ1, a key component of this PCD program, is overexpressed in the CLL cells.15 Indeed, it seems that the sustained activation/phosphorylation of the overexpressed PLCγ1 generated a massive intracellular Ca2+ mobilization in the CLL cells that could not be regulated by Ca2+ resequestration into the mitochondria and endoplasmic reticulum.15 Under these conditions, the CLL cell had no choice but to die.
By describing the implication of the Gαi proteins, the cellular cAMP levels, and the PKA in the PLCγ1-Y873 phosphorylation, our work also contributes to deciphering how the N-methylated TSP-1 mimetic peptides trigger PCD in CLL. In this way, our immunoblot experiences on cells treated with suramin and forskolin show that the blockade of the Gαi-protein pathway also precludes the phosphorylation of PLCγ1. This provides a sequence of events placing the Gαi proteins over the PLCγ1 activation and the subsequent mitochondria and endoplasmic reticulum damage associated with this type of PCD.
ICD is a form of cell death activating a specific immune response that is set up after the release of danger signals, named DAMPs.44,45 The 3 most important DAMPs are CALR, HMGB1, and ATP. The relocation of the CALR at the surface of the cell is detected by the dendritic cells to induce stimulation and maturation. HMGB1 released to the extracellular medium leads to the activation of the antigen-presenting cells. Finally, cell-liberated ATP binds to the surface of the antigen-presenting cells to create a highly inflammatory environment.44,45 In our case, we could suggest that the treatment of CLL cells with PKT16 provokes a release of the DAMPs, leading to the recruitment and maturation of antigen-presenting cells, the release of inflammatory cytokines, and the maturation of cytotoxic T lymphocytes. This environment would establish an immune response that could remove dead CLL cells, supporting the in vivo efficiency of PKT16 treatment.
Expected goals in CLL research are the identification of new molecular pathways sustaining the lifespan of the malignant B cells and the subsequent development of therapeutic agents that activate these pathways to induce PCD. In this way, our results provide substantial progress in CLL research. From a wider perspective, through the development of N-methylated TSP-1 mimetic peptides that are highly effective in the induction of PCD in drug-resistant cells, our work proposes an original strategy that could pave the way for new therapeutic developments, not only in the fields of CLL and leukemia but also in the general treatment of cancer.
Acknowledgments
The authors thank Brigitte Bauvois for help with experimental work; Kevin Garbin (Histology, Cell Imaging, and Flow Cytometry Platform Centre de Recherche des Cordeliers) for immunohistochemistry advice; Anaïs Rousseaux, Marie-Noëlle Brunelle-Navas, Sandrine Bouchet, Ana-Carolina Martinez-Torres, and Ashanti-Concepción Uscanga-Palomeque for preliminary assessments; and Marcela Segade for proofreading. OSU-CLL cells were provided by The Ohio State University’s Human Genetics Sample Bank.
This work was supported by Fondation ARC (PJA20171206551), Association Laurette Fugain, Gefluc, Ligue Nationale Contre le Cancer-Comité de Paris (RS19/75-59), Fondation pour la Recherche Medicale, and the SIRIC-CURAMUS (INCA-DGOS-Inserm_12560). E.P. received fellowships from the French Research Ministry and Société Française d’Hématologie.
Authorship
Contribution: E.P. conceived and performed CLL experimental work, analyzed the data, and helped to write the manuscript; L.H.B. conceived and performed CLL experimental work and analyzed the data; T.D. and E.L. generated the peptides used in the manuscript; F.N. performed mouse experimental work and analyzed the data; M.X. performed ICD tests and analyzed the data; K.M. provided CLL samples; D.R.-W. provided bone marrow cells; E.C. performed CLL cytogenetic tests; M.L.G.-T. supervised TP53 status; F.D. verified IGHV mutational status; D.D. supervised and analyzed in vivo mouse experiments; M.S. performed CLL experimental work and provided critical advice throughout the study; F.N.-K. provided CLL samples, performed cytogenetic analysis, and completed the mutational status and karyotype of the patients with CLL; H.M.-B. supervised CLL research; P.K. designed and supervised the synthesis of the peptides used in the manuscript; and S.A.S. conceived and supervised all aspects of the project, designed experiments, interpreted the data, and wrote the manuscript.
Conflict-of-interest disclosure: The authors declare no competing financial interests.
Correspondence: Santos A. Susin, Centre de Recherche des Cordeliers, 15 Rue de l’Ecole de Médecine, 75006 Paris, France; e-mail: santos.susin@sorbonne-universite.fr.
The full-text version of this article contains a data supplement.


![PKT16 induces PCD in CLL cells with no detected resistance. (A) Patients from supplemental Table 1 were classified into IGVH mutated (IGHV-M) or unmutated (IGHV-UM; mutated-VH3-21 gene [V3-21*], conferring worse prognosis, has been included in this group) and absence of del17p (No del17p) or del17p and incubated with PKT16 (100 µM, 6 hours). Cell viability was measured by Annexin-V/PI colabeling. After accounting for spontaneous PCD, the percentages of Annexin-V positive cells were recorded and expressed as a histogram. Box plots represent the mean of cell death in each population with minimum to maximum values. (B) B cells from patients with CLL with del13q alone (n = 14), tri12 (n = 3), del11q (n = 7), del17p (n = 6), 2p gain (n = 3), complex karyotype (CK; n = 7), or without any of these cytogenetic abnormalities (Abs; n = 8) were untreated or treated with PKT16 (100 µM, 6 hours), and cell death, measured by Annexin-V/PI costaining, was recorded and graphed. Box plots represent the mean of cell death in each population with minimum to maximum values. (C) Cell death was measured in CLL cells presenting in vitro resistance to at least 1 drug used in the treatment of CLL. Cells were incubated either with the combination FCR (fludarabine 10 µM, cyclophosphamide 3 mM, rituximab 10 µg/mL), ibrutinib (15 µM), idelalisib (100 µM), venetoclax (4 nM), or PKT16 (100 µM) over the course of 24 hours, and cytotoxicity was assessed by flow cytometry by Annexin-V/PI colabeling. The percentages of Annexin-V-positive cells were recorded and expressed as a dot plot. The points represent the results obtained in the CLL cells from each individual, and the lines indicate the mean of the 8 patients tested. (D) CLL cells were left untreated (Control) or incubated over the course of 24 hours, either with low doses of FCR (fludarabine 1 µM, cyclophosphamide 2 mM, and rituximab 10 µg/mL), ibrutinib (10 µM), idelalisib (50 µM), venetoclax (2 nM), PKT16 (50 µM), or the combination of PKT16 and the different drugs, all at the above low doses. The PCD induced was assessed by Annexin-V/PI colabeling and the percentages of Annexin-V-positive cells were recorded and expressed as a histogram (n = 6). Note that the combination of PKT16 with each individual drug induced an additional PCD rate. (E) Cell death was evaluated as above in CLL cells untreated (Control) or treated with venetoclax (4 nM) or PKT16 (100 µM, 6 hours) in the absence (−) or presence of interleukin 4 (50 ng/mL) and CD40L (100 ng/mL; n = 5). Statistical significance was calculated in panels A and C by the Student t test and in panels B, D, and E by Mann-Whitney U test. Symbols and bars represent mean ± SD.](https://ash.silverchair-cdn.com/ash/content_public/journal/bloodadvances/3/20/10.1182_bloodadvances.2019000350/5/m_advancesadv2019000350f2.png?Expires=1766918754&Signature=aJgsqmQiiogOPkCP2HVc29zHV0ftaPi0qESScNq-3ha1ngiuhYUiOC~Jsc7vLd1z0dEux-NeHTlMkvjRTwFLTXH1TSkcxUSD8iWJRwhmr~DszfIe6~1lJBQES0kFx~NJHuNlntbxMVfETOwSeEgIIVwDD1me7SQpAL1gqa-gfj9~t65hozjjhJoeFdg~SFpLuqowMk3wCyd~0QFR6F61-eHsu5v~7hYHgDyFximU~uHELPtzR6-vKKfs6jb9dih5DA0Gt44oy~rjLpukC6CWaTLwUQods7d74lyTutuPHqbLExpHTi8inPzPEGhj7xsitsqXmEGNm-SVKPXeYma9Sw__&Key-Pair-Id=APKAIE5G5CRDK6RD3PGA)