Key Points
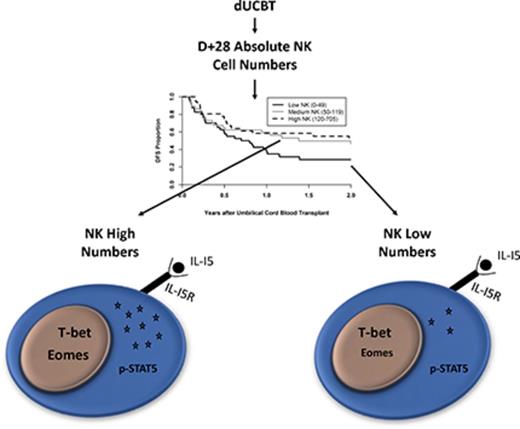
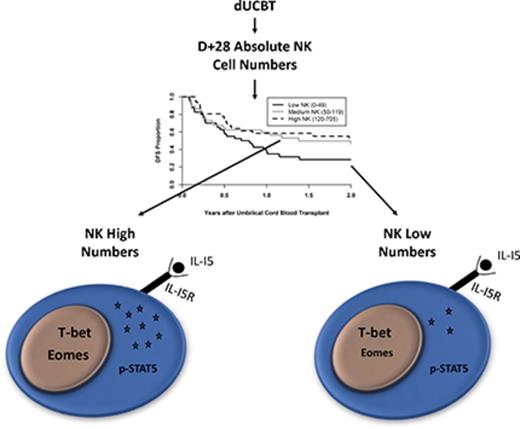
Low numbers of reconstituting NK cells at D+28 after dUCBT are associated with inferior DFS.
Patients with low NK cell numbers at D+28 have reduced phosphorylation of STAT5 upon IL-15 stimulation and less Eomes expression.
Abstract
Natural killer (NK) cell immune reconstitution after double umbilical cord blood transplantation (dUCBT) is rapid and thought to be involved in graft-versus-leukemia (GvL) reactions. To investigate the role of NK cell recovery on clinical outcomes, the absolute number of NK cells at day 28 after dUCBT was determined, and patients with low numbers of NK cells had inferior 2-year disease-free survival (hazard ratio 1.96; P = .04). A detailed developmental and functional analysis of the recovering NK cells was performed to link NK recovery and patient survival. The proportion of NK cells in each developmental stage was similar for patients with low, medium, and high day 28 NK cell numbers. As compared with healthy controls, patients posttransplant showed reduced NK functional responses upon K562 challenge (CD107a, interferon-γ, and tumor necrosis factor-α); however, there were no differences based on day 28 NK cell number. Patients with low NK numbers had 30% less STAT5 phosphorylation in response to exogenous interleukin-15 (IL-15) (P = .04) and decreased Eomes expression (P = .025) compared with patients with high NK numbers. Decreased STAT5 phosphorylation and Eomes expression may be indicative of reduced sensitivity to IL-15 in the low NK cell group. Incubation of patient samples with IL-15 superagonist (ALT803) increased cytotoxicity and cytokine production in all patient groups. Thus, clinical interventions, including administration of IL-15 early after transplantation, may increase NK cell number and function and, in turn, improve transplantation outcomes.
Introduction
Umbilical cord blood transplantation (UCBT) is an acceptable alternative to matched-unrelated donor bone marrow or peripheral blood hematopoietic stem cell transplantation (HSCT).1,2 For many adult patients, a single umbilical cord blood (UCB) unit has an insufficient number of cells for engraftment, and in these cases, we have shown that double UCBT (dUCBT) can lead to hematopoietic cell engraftment.3,4 Although effective for some patients, nonrelapse-related mortality (NRM) and relapses still occur, and thus, improvements are needed.4,5 Identification of patients at risk for a poor outcome could have significant impact as it might lead to novel interventions.
Natural killer (NK) cells are innate immune effectors that recognize malignant cells without prior recognition or priming. NK cells are the first lymphocytes to recover to normal numbers as early as 1 month after HSCT. In contrast, T cells take longer to recover (up to 1 year6-8 ). These patterns of immune reconstitution, and the widely held perception that graft-versus-leukemia (GVL) reactions occur during the first weeks to months after HSCT, support a central role for NK cells in GVL. Rapid lymphocyte recovery (days 15-42) is associated with improved disease-free survival (DFS), because of either reduced fungal infections,9 NRM,10,11 relapse,9,12 or overall survival.9,10,13 Given that NK cells account for a significant proportion of the lymphocytes that make up the absolute lymphocyte count (ALC) early after transplantation, a related study showed increased NK cell numbers at D+28 were associated with less relapse, lower acute graft-versus-host-disease (aGVHD), and improved survival after sibling transplantation.14 These results have not been validated nor have they been confirmed with other cell sources, including dUCBT.
NK cell differentiation is characterized by a series of developmental steps (or “stages”) that a progenitor cell takes during the acquisition of NK functionality.15-18 Stage I-III NK progenitors are present mainly in the bone marrow and secondary lymphoid tissues and are therefore not easily accessible to study post-HSCT. Stage IV, CD56bright NK cells are released from lymphoid tissues and enter peripheral blood, where they undergo terminal differentiation. During this process, CD56bright cells gradually become CD56dim cells, characterized by acquisition of CD16, killer immunoglobulin receptors (KIR), and eventually, CD57.19,20 Coupled with these phenotypic changes are functional changes, including a progressive loss of in vitro proliferative capacity and cytokine production (interferon-γ [IFN-γ], tumor necrosis factor-α [TNF-α]) and an acquisition of cytotoxicity.19-21 Although many studies have characterized the recovery of CD56bright and CD56dim populations after allo-HSCT, few have investigated the various NK subsets after HSCT and determined their association with clinical outcomes.22,23
Similarly, relatively few studies have examined the function of the reconstituting NK cells after HSCT. Most research shows diminished IFN-γ and TNF-α production, but intact degranulation (CD107a expression) after K562 exposure.8,23,24 In these studies, production of IFN-γ was restored to, or exceeded, normal levels after exogenous interleukin-12 (IL-12) and IL-18 stimulation.8,23 Few studies have examined the relationship between NK function and clinical outcomes, but 1 small study (n = 13) showed that at 1-month post-HSCT reduced degranulation was associated with higher relapse.23 It is unclear whether NK function is associated with superior clinical outcomes in dUCBT.
In this study, we investigated the relationship between absolute NK numbers at 28 days after dUCBT (D+28) and clinical outcomes. Patients were divided into 3 groups (tertiles) based on absolute NK count. We characterized NK maturation and multiple measures of NK function, including cytokine production, degranulation, proliferation, response to cytokine stimulation, downstream signaling, and the expression of key transcription factors. These data allowed us to correlate NK cell reconstitution with patient outcomes after dUCBT.
Methods
Patients and samples
One hundred eleven patients with hematopoietic malignancies underwent dUCBT between October 2010 and September 2014. Patients were conditioned with total body irradiation, cyclophosphamide, and fludarabine using either myeloablative or reduced intensity regimens as previously described.4,25 Graft-versus-host disease (GVHD) prophylaxis consisted of cyclosporine A (CSA) and mycophenolic acid mofetil or sirolimus and mycophenolic acid mofetil. The majority of patients had acute leukemia (acute myeloid leukemia [n = 42] and acute lymphoid leukemia [n = 23]). The rest had chronic leukemia (chronic myeloid leukemia [n = 1], chronic lymphoid leukemia [n = 6], myelodysplastic syndrome [n = 15], and myeloproliferative disease [n = 2]), lymphoma (non-Hodgkin lymphoma [n = 10] and Hodgkin lymphoma [n = 5]), or other malignancies (Table 1). Patients with primary graft failure were excluded. Recipient peripheral blood mononuclear cells (PBMCs) were collected at D+28 after transplant (n = 83). Serum samples were collected at day 7 and 28 after transplant. Samples were collected after informed consent using Institutional Review Board–approved protocols. The absolute NK cell count was calculated from the ALC at D+28 post-dUCBT. Before flow cytometric analysis, PBMCs were thawed and incubated overnight at 37°C in RPMI-1640 media without exogenous cytokines and supplemented with 10% fetal bovine serum, 100 U/mL penicillin, and 100 U/mL streptomycin.
NK phenotype analysis
All rested samples were stained with viability dye and surface antibodies for 30 minutes at 4°C. Then cells were washed and permeabilized using the FOXp3 transcription Factor Staining Set for staining with Ki67 (00-5523; eBioscience, San Diego, CA). The following mouse anti-human antibodies were used: CD3-PE-eFluor 610 (clone UCHT1), CD19-PE-eFluor 610 (clone 61D3), CD14-PE-eFluor 610 (clone HIB19), and CD57-eFluor 450 (clone TBO1) from eBioscience; CD56-BV605 (clone NCAM) and CD117-BV650 (clone 104D2) from Biolegend (San Diego, CA); NKG2A-APC (clone Z199) from Beckman Coulter (Indianapolis, IN); Near-IR LIVE/DEAD Fixable dead cell stain from Life Technologies (San Diego, CA); and Ki67-PE (clone B56) as part of Transcription Factor Binding set and cocktail of fluorescein isothiocyanate–conjugated KIR antibodies against NKB1 (clone DX9), CD158a (clone HP-3E4), and CD158b (CH-L) from BD Biosciences (San Jose, CA). All flow cytometry was collected on a LSR II flow cytometer (BD Biosciences) and analyzed using Flowjo v10 (Flowjo LLC, Ashland, OR).
Degranulation and cytokine production
PBMCs from patients (n = 69) and healthy controls (n = 4) were cocultured with K562 target cells at a 2:1 ratio for 4 hours in the presence of CD107a. Golgi Plug/Stop was added after 1 hour.26 Intracellular cytokine production was measured by IFN-γ and TNF-α. The following antibodies were used: CD107a-AF700 (clone H4A3; BD), Fixable Viability dye eF780 (eBioscience), CD56-PE (Beckman Coulter), the same antibodies as above for CD3, CD14, CD19, IFN-γ–fluorescein isothiocyanate (clone 4S.B3; Biolegend), and TNF-α-AF647 (clone Mab11; Biolegend). Recombinant human IL-12 (10 ng/mL) and recombinant human IL-18 (100 ng/mL), both from R&D, were added to 1 well of PBMCs and incubated overnight for maximal cytokine stimulation. Where stated, patient samples were cultured in media containing the IL-15 superagonist ALT803 (1 nM) overnight prior to degranulation assays.
Serum cytokines
Serum cytokine concentrations were measured at day 7 (D+7) and D+28 post-dUCBT using enzyme-linked immunosorbent assay (ELISA). IL-2 was measured using IL-2 Ready-SET-Go! ELISA (88-7025; eBiosciences) at D+7 (n = 67) and D+28 (n = 73). IL-15 was measured using IL-15 Ready-SET-Go! ELISA (88-7158; eBioscience) at D+7 (n = 69) and D+28 (n = 46). IL-12 was measured using the human IL-12 (p70) ELISA MAX Deluxe set (431704; Biolegend) at D+7 (n = 55) and D+28 (n = 38). IL-7 was measured using the IL-7 Duo-Set ELISA kit (DY207; R&D) at D+7 (n = 29) and D+28 (n = 27).
Functional analysis of phosphorylated STAT5
Thawed PBMCs were incubated with Fixable Viability Dye eFluor 520 (eBioscience) in phosphate-buffered saline for 15 minutes (n = 26). Cells were resuspended in RPMI-1640 buffer with 10% fetal bovine serum and treated as described27 using BD Phosflow Violet Fluorescent Cell Barcoding Kit (561571; BD Biosciences). Cells were stimulated with human IL-15 in a deep-well plate (CAB09320; Abgene/ThermoFisher) and then fixed for 10 minutes by adding an equal volume of warm Cytofix Fixation Buffer (BD). Cell pellets were permeabilized for 30 minutes on ice with cold Phosflow Perm Buffer III (558050; BD) and incubated as described in BD Barcoding Kit. After 2 washes, cells were stained with CD56-PE (clone N901; Beckman Coulter), CD3-PE-eFluor 610 (clone UCHT1; eBioscience), and STAT5 (pY694)-Alexa Fluor 647 (clone 47; BD) for 30 minutes at 4°C.
T-bet and Eomes expression
Rested PBMCs from patients (n = 25) and healthy controls were washed with phosphate-buffered saline and surface stained for 30 minutes at 4°C. Monoclonal antibodies used for surface staining were LIVE/DEAD Aqua fixable dead cell stain (Life Technologies), CD3-PerCP-Cy5.5 (clone HIT3a; BioLegend), and CD56-BV605 (clone NCAM16.2; BD Biosciences). Cells were then washed and incubated with BD Cytofix Fixation buffer for 20 minutes at 4°C. Once fixed, the cells were permeabilized in 1× Perm/Wash buffer (BD) for 20 minutes at room temperature and stained with T-bet-PE-Cy7 (BioLegend) and Eomes-PE (eBioscience). The cells were then washed and resuspended in 1× Perm/Wash buffer prior to analysis.
Statistical analysis
Patients were stratified into tertiles (low, medium, and high) based on NK number at D+28 to identify trends in clinical outcomes. Single variable analysis of NK number was performed for DFS using Kaplan-Meier estimates28 and the log-rank test, and for relapse, NRM, and grade 2-4 aGVHD using cumulative incidence29 and Gray’s test, accounting for competing risks.30 For the primary outcome of DFS, a multiple Cox regression model was fit, including prespecified factors for NK cell count (low, medium, high), disease type (acute myeloid leukemia or other), and conditioning and GVHD prophylaxis (myeloablative, reduced intensity with CSA, reduced intensity without CSA). Survival endpoints were analyzed using SAS version 9.3 (SAS Institute, Cary, NC). Comparisons of clinical characteristics were made using χ2 tests for categorical variables and Wilcoxon signed rank tests for continuous variables. All reported P values are 2 sided. Graphs were generated using Graphpad Prism software (La Jolla, CA). Results of statistical analysis are indicated as *P < .05, **P < .01, ***P < .001, or not significant for P > .05.
Results
NK number at D+28 post-dUCBT and patient demographics
Patients who underwent dUCBT for hematologic malignancies exhibited a wide range of circulating NK cells at D+28 (0-558 NK cells/mm3). These patients were evenly divided into 3 groups (tertiles) based on the absolute NK number at D+28: low (<50 NK cells/mm3), medium (50-120 NK cells/mm3), and high (>120 NK cells/mm3) groups. There were no significant differences between the 3 groups in demographic, pretransplant conditioning intensity, disease, or graft characteristics (Table 1).
Low NK numbers at D+28 are associated with inferior DFS
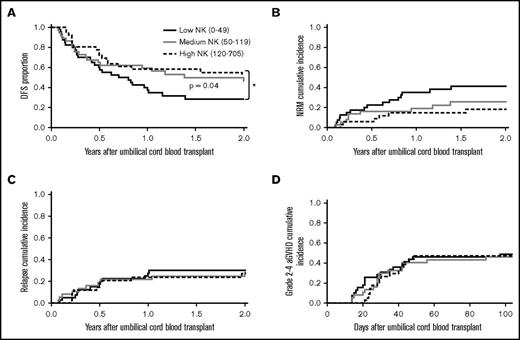
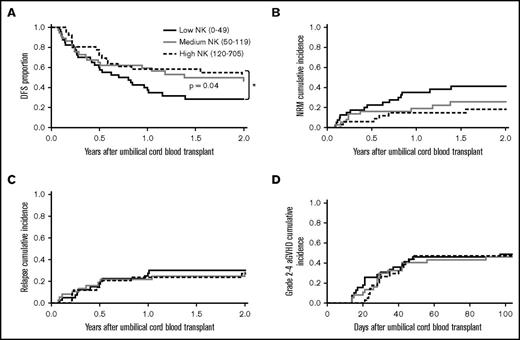
The 3 patient groups were next tested for clinical outcomes. Patients with the lowest numbers of NK cells at D+28 after dUCBT had almost a twofold decrease in DFS in multivariable analysis compared with patients with higher NK numbers (hazard ratio = 1.96, 95% confidence interval [CI]: 1.02-3.77; P = .04) (Figure 1A), with 2-year DFS for low, medium, and high groups at 28% (95% CI: 15% to 43%), 46% (29% to 62%), and 55% (37% to 70%). Patients in the low NK group had higher 2-year NRM (41% vs 26% vs 18% for low, medium, and high NK; P = .08; Figure 1B), but no difference in 2-year relapse (P = .94; Figure 1C) or grade II-IV aGVHD (P = .51; Figure 1D) as compared with patients with medium or high numbers of NK cells. Together, these data show a survival disadvantage for patients with low numbers of NK cells, mainly due to increased NRM.
Absolute numbers of NK cells at D+28 after dUCBT are associated with clinical outcomes. (A) 2-year DFS of low, medium, and high NK groups (28%, 46%, and 55%; *shows comparison of low NK vs high NK groups where P = .04). (B) 2-year NRM of low, medium, and high NK groups (41%, 26%, and 18%; P = .08). (C) 2-year relapse incidence in the low, medium, and high NK groups (30%, 28%, and 27%; P = .94). (D) 100-day grade II-IV acute GVHD in the low, medium, and high NK patients (49%, 46%, and 47%; P = .51).
Absolute numbers of NK cells at D+28 after dUCBT are associated with clinical outcomes. (A) 2-year DFS of low, medium, and high NK groups (28%, 46%, and 55%; *shows comparison of low NK vs high NK groups where P = .04). (B) 2-year NRM of low, medium, and high NK groups (41%, 26%, and 18%; P = .08). (C) 2-year relapse incidence in the low, medium, and high NK groups (30%, 28%, and 27%; P = .94). (D) 100-day grade II-IV acute GVHD in the low, medium, and high NK patients (49%, 46%, and 47%; P = .51).
NK numbers in each developmental stage are associated with overall NK cell number
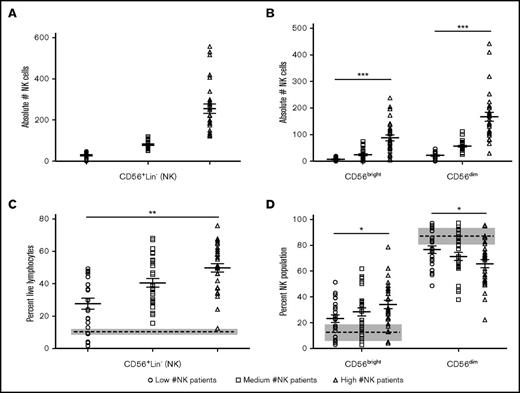
We next tested whether patients with low, intermediate, and high numbers of NK cells at D+28 (Figure 2A) had differing numbers or percentages of NK cells in the various differentiation stages using the flow cytometry gating strategy outlined in supplemental Figure 1. The absolute NK number at D+28 was positively correlated with both the absolute number of immature CD56bright NK cells (R = 0.85) and the mature CD56dim NK cells (R = 0.95) (Figure 2B). The absolute number of NK cells was also positively correlated with the percentage of CD56+Lin− NK cells (R = 0.57; Figure 2C) and CD56bright NK cells (R = 0.27; Figure 2D left), whereas negatively correlated with the CD56dim NK cell subpopulation (R = 0.28; Figure 2D right). In addition, the percentage of total NK cells and CD56bright NK cells was higher than healthy controls, whereas the percentage of CD56dim NK cells was lower than healthy controls, notated by the dashed line and gray box for standard error (Figure 2C-D).
Number of NK cells at D+28 after dUCB correlates with the number and percentage of CD56brightand CD56dimNK cells. (A) Absolute number of CD56+Lin− NK cells in each tertile. (B) Absolute number of CD56bright (R = 0.85, 95% CI: 0.77-0.90; P < .01) and CD56dim (R = 0.95, 95% CI: 0.92-0.97; P < .01) NK cells in each tertile as a function of the total NK cell population. (C) Proportion of CD56+Lin− NK cells in each tertile (R = 0.57, 95% CI: 0.40-0.70; P < .01). (D) Proportion of CD56bright (R = 0.27, 95% CI: 0.06-0.46; P = .01) and CD56dim (R = −0.28, 95% CI: −0.47–0.06; P = .01) NK cells in each tertile. Data represented as a data point for each patient with the mean as the solid middle line with standard error above and below. R = Spearman correlation coefficients. Healthy donor controls for panel B are represented by the dashed line (mean) and gray box (standard error). The absolute number of each population was calculated by multiplying the proportion of each NK differentiation stage by the absolute number of NK cells. *R = ±0.25-0.50; **R = ±0.50-0.8; ***R > ±0.8.
Number of NK cells at D+28 after dUCB correlates with the number and percentage of CD56brightand CD56dimNK cells. (A) Absolute number of CD56+Lin− NK cells in each tertile. (B) Absolute number of CD56bright (R = 0.85, 95% CI: 0.77-0.90; P < .01) and CD56dim (R = 0.95, 95% CI: 0.92-0.97; P < .01) NK cells in each tertile as a function of the total NK cell population. (C) Proportion of CD56+Lin− NK cells in each tertile (R = 0.57, 95% CI: 0.40-0.70; P < .01). (D) Proportion of CD56bright (R = 0.27, 95% CI: 0.06-0.46; P = .01) and CD56dim (R = −0.28, 95% CI: −0.47–0.06; P = .01) NK cells in each tertile. Data represented as a data point for each patient with the mean as the solid middle line with standard error above and below. R = Spearman correlation coefficients. Healthy donor controls for panel B are represented by the dashed line (mean) and gray box (standard error). The absolute number of each population was calculated by multiplying the proportion of each NK differentiation stage by the absolute number of NK cells. *R = ±0.25-0.50; **R = ±0.50-0.8; ***R > ±0.8.
Similar to CD56bright and CD56dim populations, the absolute number of NK cells at D+28 was positively correlated with the number of stage III, stage IV, stage V, and stage VI NK cells (correlation coefficient ranging from 0.77 to 0.95; Figure 3A-D). However, the percentage of each NK developmental stage was not different between the D+28 low, medium, and high patient groups (Figure 3E-H). Thus, although the absolute number of NK cells at D+28 was positively correlated with the number of NK cells in each developmental stage, the proportions were not different based on NK cell number at D+28.
Overall number of NK cells correlates with number but not the proportion of each NK developmental stage. (A) Absolute number of circulating CD56brightCD117+NKG2A− stage III NK cells. (B) Absolute number of circulating stage IV CD56brightCD117+ (left, R = 0.85, 95% CI: 0.77-0.90; P < .01) and CD56brightCD117− (right, R = 0.77, 95% CI: 0.66-0.85; P < .01) NK cells. (C) Absolute number circulating of CD56dimNKG2A+ stage V (left, R = 0.86, 95% CI: 0.80-0.91; P < .01), CD56dimKIR+ stage V (middle, R = 0.77, 95% CI: 0.66-0.84; P < .01), and CD56dimCD57− stage V (right, R = 0.77, 95% CI: 0.66-0.84; P < .01) NK cells. (D) Absolute number of circulating CD56dimCD57+ stage VI NK cells (R = 0.95, 95% CI: 0.92-0.97; P < .01). (E) Proportion of stage III NK cells. (F) Proportion of stage IV CD56bright CD117+ (left) and CD56brightCD117− (right) NK cells. (G) Proportion of NKG2A+ stage V (left), KIR+ stage V (middle), and CD56dimCD57− stage V (left) NK cells. (F) Proportion of CD56dimCD57+ stage VI NK cells. R = Spearman correlation coefficients. Data represented as a data point for each patient with the mean of the population as the solid middle line with standard error above and below. Healthy donor controls for panels E-H are represented by the mean (dashed line) and standard error (gray box). The absolute number of each population was calculated by multiplying the proportion of each NK differentiation stage by the absolute number of NK cells. *R = ±0.25-0.50; **R = ±0.50-0.8; ***R > ±0.8.
Overall number of NK cells correlates with number but not the proportion of each NK developmental stage. (A) Absolute number of circulating CD56brightCD117+NKG2A− stage III NK cells. (B) Absolute number of circulating stage IV CD56brightCD117+ (left, R = 0.85, 95% CI: 0.77-0.90; P < .01) and CD56brightCD117− (right, R = 0.77, 95% CI: 0.66-0.85; P < .01) NK cells. (C) Absolute number circulating of CD56dimNKG2A+ stage V (left, R = 0.86, 95% CI: 0.80-0.91; P < .01), CD56dimKIR+ stage V (middle, R = 0.77, 95% CI: 0.66-0.84; P < .01), and CD56dimCD57− stage V (right, R = 0.77, 95% CI: 0.66-0.84; P < .01) NK cells. (D) Absolute number of circulating CD56dimCD57+ stage VI NK cells (R = 0.95, 95% CI: 0.92-0.97; P < .01). (E) Proportion of stage III NK cells. (F) Proportion of stage IV CD56bright CD117+ (left) and CD56brightCD117− (right) NK cells. (G) Proportion of NKG2A+ stage V (left), KIR+ stage V (middle), and CD56dimCD57− stage V (left) NK cells. (F) Proportion of CD56dimCD57+ stage VI NK cells. R = Spearman correlation coefficients. Data represented as a data point for each patient with the mean of the population as the solid middle line with standard error above and below. Healthy donor controls for panels E-H are represented by the mean (dashed line) and standard error (gray box). The absolute number of each population was calculated by multiplying the proportion of each NK differentiation stage by the absolute number of NK cells. *R = ±0.25-0.50; **R = ±0.50-0.8; ***R > ±0.8.
NK cells exhibit impaired function regardless of NK cell number at D+28
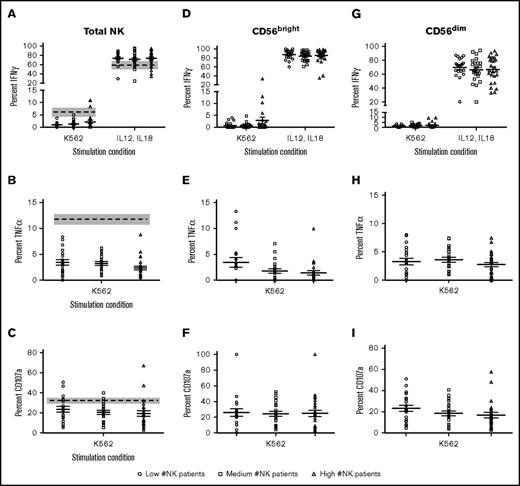
To investigate whether D+28 NK counts were associated with functionality, patient samples were cocultured with K562 cells and tested for degranulation (CD107a) and the production of IFN-γ and TNF-α. The average IFN-γ production after K562 incubation was <5%, similar to healthy controls. As a positive control, cells were stimulated with IL-12 and IL-18 overnight. A higher proportion of patient NK cells produced IFN-γ, compared with healthy controls (73% vs 59%; P < .01), consistent with a higher proportion of CD56bright cells in transplant recipients (Figure 4A). However, there was no difference in IFN-γ production between the low, medium, and high D+28 NK patient groups for either condition (Figure 4A). K562-induced TNF-α production and degranulation were also lower in dUCBT patients than controls (3 vs 12% and 21 vs 32%, both <0.05, respectively; Figure 4B-C). Again, there was no significant difference between patient groups based on these readouts (Figure 4B-C). The same trends were observed when the CD107a, IFN-γ, and TNF-α were analyzed in CD56dim and CD56bright subsets (Figure 4D-I). These findings indicate that K562-induced degranulation and cytokine production are reduced at D+28 after dUCBT as compared with healthy controls, but are not different between the 3 patient groups.
Target cell–induced function is impaired at D+28 after dUCBT for NK cell groups. PBMCs from healthy donor controls and patients at D+28 after dUCBT were cocultured with K562 target cells for 4 hours or IL-12/IL-18 overnight. Expression of CD107a, IFN-γ, and TNF-α was measured on CD56+Lin− gated NK cells. (A) Expression of IFN-γ after K562 coculture (left) or IL-12/IL-18 stimulation (right). (B) Expression of TNF-α after K562 coculture. (C) Expression of CD107a after K562 coculture. Data represented as a data point for each patient with the mean of the population as the solid middle line with standard error above and below. Healthy donor controls are represented by the mean (dashed line) and standard error (gray box). For samples shown in panels D-I, NK cells were gated on CD56bright and CD56dim populations based on MFI. Percentage expression of IFN-γ (D,G), TNF-α (E,H), and CD107a (F,I) is shown.
Target cell–induced function is impaired at D+28 after dUCBT for NK cell groups. PBMCs from healthy donor controls and patients at D+28 after dUCBT were cocultured with K562 target cells for 4 hours or IL-12/IL-18 overnight. Expression of CD107a, IFN-γ, and TNF-α was measured on CD56+Lin− gated NK cells. (A) Expression of IFN-γ after K562 coculture (left) or IL-12/IL-18 stimulation (right). (B) Expression of TNF-α after K562 coculture. (C) Expression of CD107a after K562 coculture. Data represented as a data point for each patient with the mean of the population as the solid middle line with standard error above and below. Healthy donor controls are represented by the mean (dashed line) and standard error (gray box). For samples shown in panels D-I, NK cells were gated on CD56bright and CD56dim populations based on MFI. Percentage expression of IFN-γ (D,G), TNF-α (E,H), and CD107a (F,I) is shown.
Patients with low numbers of NK cells are less responsive to exogenous IL-15
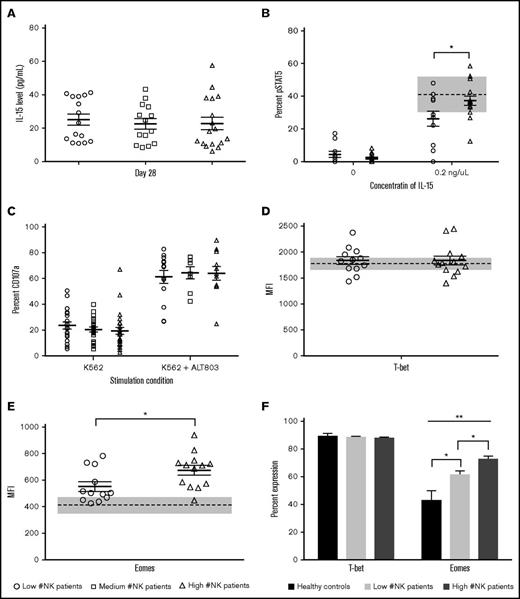
IL-15 is an essential cytokine for NK maturation and homeostasis.31 To investigate whether elevated serum IL-15 concentrations accounted for higher numbers of NK cells in some patients, we used ELISA to test serum at day 7 (D+7) and D+28 after dUCBT. Patients had similar concentrations of IL-15 at D+7 (data not shown) and D+28 (Figure 5A). We also analyzed serum concentrations of IL-2 and -12, and no difference between the 3 patient groups was noted (data not shown). Thus, differences in the above serum cytokines do not explain the differences in NK numbers.
Patients with low NK numbers at D+28 have impaired response to exogenous IL-15 and reduced Eomes expression. Serum or PBMCs from healthy donor controls and patients at D+28 after dUCBT were rested overnight. Expression of pSTAST5, T-bet, and Eomes was measured on CD56+Lin− gated NK cells. (A) D+28 IL-15 serum levels measured by ELISA in patients with low, medium, and high numbers of NK cells D+28 post-dUCBT. (B) Expression of pSTAT5 at baseline (left) or after 15 minutes of stimulation with 0.2 ng/μL IL-15 (right) in patients with low or high NK numbers D+28. (C) MFI of T-bet expression in patients with low or high NK numbers D+28. (D) MFI of Eomes expression in patients with low or high NK numbers D+28. (E) Percentage of T-bet (left) and Eomes (right) expression in healthy controls and patients with low or high NK numbers D+28. Scatter plot data represented as a data point for each patient with the mean of the population as the solid middle line and standard error above and below (A-D). Healthy donor controls are represented by the mean (dashed line) and standard error (gray box) where applicable. *P < .05; **P < .01.
Patients with low NK numbers at D+28 have impaired response to exogenous IL-15 and reduced Eomes expression. Serum or PBMCs from healthy donor controls and patients at D+28 after dUCBT were rested overnight. Expression of pSTAST5, T-bet, and Eomes was measured on CD56+Lin− gated NK cells. (A) D+28 IL-15 serum levels measured by ELISA in patients with low, medium, and high numbers of NK cells D+28 post-dUCBT. (B) Expression of pSTAT5 at baseline (left) or after 15 minutes of stimulation with 0.2 ng/μL IL-15 (right) in patients with low or high NK numbers D+28. (C) MFI of T-bet expression in patients with low or high NK numbers D+28. (D) MFI of Eomes expression in patients with low or high NK numbers D+28. (E) Percentage of T-bet (left) and Eomes (right) expression in healthy controls and patients with low or high NK numbers D+28. Scatter plot data represented as a data point for each patient with the mean of the population as the solid middle line and standard error above and below (A-D). Healthy donor controls are represented by the mean (dashed line) and standard error (gray box) where applicable. *P < .05; **P < .01.
After IL-15 stimulation, STAT5 is phosphorylated, which is essential for NK development, functional acquisition, and expansion.32 To investigate whether the patient groups differed in their responsiveness to exogenous IL-15, PBMCs were incubated with a low concentration (0.2 ng/mL) of IL-15 for 15 minutes and assessed for STAT5 phosphorylation. Patients with high numbers of NK cells at D+28 showed a significantly higher percentage of NK cells with pSTAT5 as compared with low NK patients (Figure 5B, 37% vs 26%; P = .04). Moreover, the high NK cell group had similar proportions of NK cells with pSTAT5 when compared with healthy controls. Thus, patients with low numbers of NK cells at D+28 are less responsive to IL-15 stimulation compared those with high NK numbers or controls. We tested whether we could overcome this defect by incubating patient-derived NK cells with the IL-15 superagonist ALT803 overnight. As shown in Figure 5C, NK cells from all patient groups became activated and equally degranulated following K562 coculture. NK cytokine production of IFN-γ and TNF-α also increased in all patient groups after the same conditions by three- to 20-fold (data not shown).
As STAT5 signaling drives NK proliferation, we also investigated the hypothesis that patients with lower numbers of NK cells would have decreased in vivo NK cell proliferation (Ki67). We observed an average of ∼60% proliferating NK cells (ranging from 8% to 93%) in all patient groups at D+28 as compared with an average of ∼7% for healthy control cells (P < .01). However, there was no significant difference between patient groups with low, medium, or high numbers of NK cells at D+28 (supplemental Figure 2A). As expected, we found the more immature NK cells to be more proliferative as compared with terminally differentiated cells; however, there were no differences in the D+28 low, medium, or high NK groups (supplemental Figure 2B-E).
Patients with low NK cells at D+28 have less Eomes
The Tbox transcription factors Eomesodermin (Eomes) and T-bet are necessary for NK maturation and acquisition of effector functions.33,34 We used intracellular flow cytometry to examine the median fluorescence intensity (MFI)35 and percentage of NK cells expressing T-bet and Eomes in a subset of patients. For T-bet, no differences in MFI or percentage expression were noted between patient groups and healthy controls (Figure 5D,F left). In contrast, patients with high numbers of NK cells at D+28 showed significantly more Eomes (by MFI) than patients with low NK numbers (Figure 5E, 675 vs 552; P = .025). There was also a significantly higher proportion of NK cells expressing Eomes in patients with high NK numbers at D+28 compared with patients with low NK numbers or healthy controls (Figure 5F, right; 72.5% vs 61.3% vs 42.8%; P < .01). Thus, patients with low NK numbers at D+28 after dUCBT have impaired NK Eomes expression.
Discussion
Our prior studies showed that high ALC early after dUCBT is associated with improved DFS.10 Considering that a significant proportion of the lymphocytes at D+28 are NK cells, we tested the hypothesis that NK number would be associated with DFS. Using a large cohort of dUCBT recipients, we grouped patients into tertiles based on the number of NK cells at D+28. Patients with low NK cell numbers at D+28 after dUCBT have inferior DFS, mainly due to increased NRM. We also investigated the NK phenotype and functional characteristics in the 3 groups. Our main findings are that the proportion of NK developmental intermediates was not different between the 3 groups. As well, the groups were similar in functionality (cytotoxicity and cytokine production). However, patients with low NK cells were less responsive to IL-15–induced STAT5 phosphorylation and had less Eomes compared with those with high numbers of NK cells at D+28 or healthy controls.
Despite analyzing the NK function (CD107a and INF-γ or TNF-α production) of a large, homogeneous cohort of dUCBT recipients at a single time point (D+28), none of these measures of NK function correlated with NK cell number at D+28 after transplant. Similar to prior research,23,26,36 we observed reduced IFN-γ production following K562 coincubation. Our findings are also in line with research showing NK cells at 1 month post-HSCT had impaired TNF-α production following K562 coincubation.23 In contrast to previous studies that examined NK function post-HSCT,23,26,36-38 we observed impaired degranulation (CD107a expression) after K562 coincubation. This impaired CD107a expression is likely explained by differences in study design, including overnight cytokine (IL-2) stimulation,37,38 differing effector-to-target ratios,23,36-38 small numbers of patients studied,26,37,38 use of samples at time points later than 1 month posttransplant,36,38 and/or the different cell source used for transplant.23,36,38 In that regard, it is possible that NK cells following dUCBT are somehow less functional than those derived from adult stem cell sources (bone marrow or peripheral blood); however, this seems unlikely because we have previously shown lower relapse rates following dUCBT compared with other adult stem cell sources.39
In chronic proliferative states, T cells can become terminally differentiated and “exhausted,” characterized by the acquisition of specific surface inhibitory receptors, hyporesponsiveness to stimulation, and ultimately, cell death.40 Two T-box transcription factors implicated in T-cell exhaustion (T-bet and Eomes) are essential for NK cell maturation and functional acquisition34 and are maintained at high levels in peripheral blood NK cells.35,41 T-bet and Eomes are key for IFN-γ production and cytotoxicity.34,41 Whether NK cells become exhausted and if so, what characterizes this is unclear. Our results showed that patients with low and high NK cell numbers had similar levels of T-bet. In contrast, patients with low NK cell numbers had significantly lower levels of Eomes than those with high NK cells at D+28. One study examined transcription factor expression and NK function at a median of 9 months after HSCT (ranging from 1 to 143 months) and found reduction in T-bet and Eomes expression. There was a correlation between less T-bet, a reduction in NK function, and more relapse.36 In contrast, we did not see a difference in T-bet or function in our patients, but all of our patients were at D+28, so expression of T-bet may change during immune recovery and downstream functional consequences may not yet be apparent. Although Eomes is downregulated during NK cell maturation,41 this early (D+28) time point studied argues against this as the reason we observed a reduction in Eomes.
Our findings of low Eomes in the patients with low NK cell numbers (and inferior outcomes) are similar to a study by Gill et al using adoptively transferred murine NK cells in a bone marrow transplant model. The NK cells were unable to clear malignant B cells and showed reduced Eomes expression. This observation was considered to be NK cell exhaustion and was overcome by forced Eomes expression, which led to a reduction in tumor burden.33 The importance of a reduction in Eomes is also further supported by Intlekofer and colleagues showing that the loss of a single Eomes allele lead to a downregulation of CD122, which is necessary for IL-15 signaling.42 Although T-cell exhaustion is well established, it is not entirely clear if NK cell exhaustion can be characterized by the same impairment in functional readouts or at what time point these would occur. Thus, our findings are consistent with prior studies that show an association between decreased Eomes expression and inferior outcomes33,34,36,42 and extend these observations by linking them with NK cell number early after dUCBT.
Here, we show that low numbers of NK cells at D+28 are associated with inferior DFS. In contrast to the work of Savani et al, we did not observe a reduction in the rates of relapse based on NK cell number.14 However, we did find that low NK number was associated with a trend toward increased NRM. These findings corroborate our prior studies, showing that low ALC was associated with increased NRM, but not relapse in separate UCB cohort.10 There was no unifying cause for NRM (infection, lung injury, etc) that might be associated with low NK cell number, likely due to the relatively small patient numbers. The reason for differing NK cell numbers at D+28 is unclear, but 1 possibility is differing numbers of NK cells in the graft, not routinely tested. If correct, this might influence UCB unit selection algorithms.
Despite a comprehensive phenotypic and functional analysis, we did not find a significant relationship between the absolute number of NK cells at D+28 after dUCBT and the proportions of NK cells in various differentiation stages or in their function, implying that NK maturation per se may not be associated with dUCBT outcomes. However, patients with low circulating NK cells at D+28 showed an impaired phosphorylation of STAT5 in response to exogenous IL-15. Interestingly, STAT5 signaling is implicated in CD8+ T-cell T-bet and Eomes expression, as well as NK persistence and homing.43 In addition, it has been shown that cytokine stimulation with IL-12, -15, and/or -18 also upregulate T-bet and Eomes in NK cells.41,44 These findings have important implications for the use of posttransplant cytokine therapy. We tested a new IL-15 superagonist45-49 and found that NK function (K562-induced IFN-γ, TNF-α, and CD107a expression) was increased in all patient groups. Thus, we plan to assess the safety and efficacy of this IL-15 superagonist (eg, ALT-803) to enhance NK cell numbers and function following HSCT. We hypothesize that enhanced activation of NK cells early after transplantation will overcome the defect in cytokine response and reduced Eomes in patients with low numbers of NK cells and lead to improved clinical outcomes post-HSCT.
The full-text version of this article contains a data supplement.
Acknowledgments
The authors acknowledge the sample procurement and cell-processing services from the Translational Therapy core supported by the Masonic Cancer Center. The authors thank the University Flow Cytometry Resource at the University of Minnesota for their support. They thank Michael Franklin and Michael Farrar for critically reading the manuscript. Finally, they thank the study participants and their families.
This work was supported by the University of Minnesota Hematology Research Training Grant (National Heart, Lung, and Blood Institute, National Institutes of Health grant 2T32HL007062) (R.J.B.), American Society for Blood and Marrow Transplantation career development award (R.J.B.), University of Minnesota Winefest Discovery Grant (R.J.B.), National Institute of Allergy and Infectious Diseases, National Institutes of Health (grant R01AI100879) (M.R.V.), National Cancer Institute, National Institutes of Health (grant P01 CA065493) (M.R.V., J.S.M., and S.C.).
Authorship
Contribution: R.J.B. designed, performed, and analyzed experiments and wrote the manuscript; R.W., H.W., G.C., and A.K. performed and analyzed experiments and helped in manuscript preparation; S.C., M.F., and J.S.M. contributed to interpretation of data and manuscript preparation; J.M.C. contributed to assay development, sample procurement, and manuscript preparation; R.S. performed statistical studies and helped in manuscript preparation; M.R.V. designed the study, analyzed results, wrote the manuscript, and oversaw all aspects of this work.
Conflict-of-interest disclosure: The authors declare no competing financial interests.
Correspondence: Michael R. Verneris, Children's Hospital Colorado, Center for Cancer and Blood Disorders, 13123 East 16th Ave, Box 115, Aurora, CO 80045; e-mail: michael.verneris@ucdenver.edu.

