Abstract
Notch receptors mediate cell-fate decisions through interaction with specific ligands during development. The biological role of a novel Notch ligand, Dll4, in mice was explored by reconstituting lethally irradiated mice with bone marrow (BM) cells transduced with Dll4 retroviral vector. White blood cell and lymphocyte counts in Dll4-overexpressing mice were reduced at the early stage of reconstitution but increased significantly at approximately 10 weeks after BM transplantation. BM, spleen, lymph nodes, and peripheral blood ofDll4-overexpressing mice contained predominantly CD4+CD8+ T cells and virtually lacked B cells. The Dll4-overexpressing mice eventually developed a lethal phenotype that was characterized by the progression of a T-cell lymphoproliferative disease (restricted to BM and lymphoid tissues) to transplantable monoclonal T-cell leukemia/lymphoma scattered to multiple organs. Results suggest that the interaction of Dll4with Notch1 may provide key signals for T-cell development.
Introduction
Notch activity affects the implementation of differentiation, proliferation, and apoptotic programs in vertebrate cell populations.1 Recent studies have suggested that Notch signaling plays an important role in the development of a variety of diseases. The association of Notch1 with human disease was first documented in a subset of T-cell acute lymphoblastic leukemia/lymphoma (T-ALL).2 The chromosomal translocation t(7;9) (q34;q34.3) joins the 3′ portion of Notch1, initially named translocation–associated Notch homology–1 (TAN-1), to the Jβ region of the T-cell receptor β-chain gene. This translocation results in overexpression of truncated Notch transcripts without the sequences encoding the extracellular domain of the Notch1 receptor, resulting in aberrant Notch1 proteins that constitutively activate the normal signaling pathway. When mice received transplanted bone marrow (BM) cells transduced with retrovirus encoding the truncated versions of Notch1 IC, 50% of the animals developed clonal T-cell leukemia.3 Elevated expression of the other members of the Notch family has been demonstrated in several neoplastic transformations in mice, such as activated Notch4/int-3–induced mouse mammary gland tumors,4-6 in disrupted neural tube development caused by overexpression of Notch3 IC,7 and in the association of feline leukemia virus with Notch2-induced thymic lymphoma.8
Recently, Shutter et al9 reported the cloning of a novel Notch ligand, Delta-like 4 (Dll4). Dll4 is expressed mainly in vascular endothelial cells, but it is also found in nonvascular cell types. Dll4 activates Notch1- and Notch4-signaling pathways, as demonstrated by coexpression of mNotch1 or mNotch4 with Dll4, resulting in induced ESR-1 and ESR-7 messenger RNA expression in the neural ectoderm ofXenopus embryos.9
In this study, we explored the biological role of Dll4 in vivo by overexpressing Dll4 in the hematopoietic system of adult mice using retroviral-mediated gene transfer. We generated recombinant retrovirus carrying the full-length Dll4complementary DNA (cDNA). Donor BM cells transduced withDll4 retrovirus were transplanted into lethally irradiated recipient mice. We characterized the in vivo effects resulting from overexpressing Dll4 in the reconstituted animals.
Materials and methods
Dll4 retrovirus
A full-length mouse Dll4 cDNA (2.1 kilobases) was cloned into the EcoRI and XhoI sites of MSCV 2.2,10 resulting in the plasmid pMSCV-Dll4. The DNA sequence of plasmid pMSCV-Dll4 was confirmed by sequencing. The Dll4 gene was under the transcriptional control of viral long terminal repeat (LTR) promoter (Figure 1A). Retroviruses carrying the parental vector MSCV2.2 and pMSCV-Dll4were transiently generated in BOSC 23 cells, as described previously.11 The titers of the transiently produced virus ranged from 1.2 to 6.0 × 10⁵ G418r colony forming units (CFUs) per milliliter, titrated on NIH3T3 cells, as described previously.12
Overexpression of
Dll4. Full-length murine Dll4 cDNA was inserted into the multiple cloning sites in MSCV2.2 (panel A), driven by LTR promoter. Restriction enzymes KpnI andSpeI are illustrated. TM indicates transmembrane region. Total RNA was isolated from 4 control and 5Dll4-overexpressing animals at 6 weeks after bone marrow transplantation (BMT) (panel B). Top panel was probed with32P-labeled Dll4 cDNA, and bottom panel was probed with 32P-labeled β-actin.
BM transduction and transplantation
We used 8- to 12-week-old female (C57BL/6J × DBA/2J) F1 (BDF1) in the current studies. BM cells harvested from mice 5 days after treatment with 5-flurouracil were used for viral transduction. The methods for BM transduction were described previously.12 After 4 rounds of transduction with fresh viral supernatant and growth factors at intervals of approximately 12 hours, BM cultures were further selected in media containing 0.4 mg/mL (active) G418 (Life Technologies, Gaithersburg, MD) for 48 hours. Total nonadherent and adherent cells were harvested and injected intravenously into γ-irradiated mice (11 Gy, Cs137, at a split dose of 2 × 5.5 Gy, 4 hours apart).
Analysis of DNA, RNA
High–molecular weight DNA was isolated from BM and spleen cells and digested with SpeI, with a single cut in the internal phosphoglycerate kinase (PGK) promoter for analyzing host-provirus DNA junctions or with KpnI (orAsp718) for excision of provirus at the LTR ends, and analyzed by Southern blot hybridization.13 Total RNA was isolated from spleen cells and analyzed by Northern blot hybridization as described.13
Fluorescence-activated cell sorter analysis
Cells collected from thymus, lymph nodes, spleen, peripheral blood (PB), and BM were stained by direct immunofluorescence double staining with anti-CD3 and anti-CD45R (B220), anti-CD4 and anti-CD8, and anti-TRCβ and anti–T-cell receptor (TCR) γ pairs of monoclonal antibodies (Pharmingen, San Diego, CA). Cells were analyzed by flow cytometry by means of a FACScan analyzer (Becton Dickinson, Lincoln, NY). Percentages of positively stained lymphocytes were defined by gating cells with reference to their forward and side light-scattering properties and by comparing their fluorescence intensity with that of cells stained with an isotype control pair of monoclonal antibodies.
Histological analysis
Standard histopatholgical analysis was performed.12Briefly, tissues were fixed by immersion in 10% zinc-buffered formalin, embedded in paraffin, and sectioned and stained with hematoxylin and eosin (H&E). For immunohistochemistry staining, tissue sections were deparaffinized and stained with rabbit polyclonal antibody (Dako, Carpinteria, CA) to mouse CD3 and rat monoclonal antibody (Pharmingen) to mouse CD45R/B220. A Vectastain ABC kit (Vector Laboratories, Burlingame, CA) was used with 3,3′-diaminobenzidine tetrahydrochloride (Dako) as chromogen, and Mayer hematoxylin according to the manufacturer's instructions.
RNAse protection assay and in situ hybridization
RNAse protection assay (RPA) was performed by means of the RPA II kit (Ambion, Austin, TX). Radiolabeled antisense RNA probes for bcl-2 (nucleotides 1846-2034 from Gb:M16506) bcl-XL(nucleotides 527-735 from L35049), and a 103-bp murine cyclophilin probe (Ambion) were hybridized to total RNA from each sample. Quantitation was performed with a phosphor imager and ImageQuant software (Molecular Dynamics, Sunnyvale, CA). In situ hybridization forDll4 and neo was performed with a33P-labeled antisense probe on paraffin sections as previously described.9 A P32-labeled sense strand was used as negative control for the in situ hybridization.
Results
Dll4-overexpressing mice
Dll4-overexpressing mice and control mice were generated by transplantation into lethally irradiated animals of BM cells that had been transduced with recombinant retrovirus containing either Dll4 (Figure 1A) or the parental vector, MSCV. In these studies, 6 independent experiments, resulting in 80 Dll4-overexpressing animals and 60 control animals, were performed. Lethally irradiated recipient mice received a transplant of 7.2 ± 2.3 × 10⁶ G418-selected cells. Northern analysis of total RNA prepared from BM and spleen cells of Dll4-overexpressing mice showed high levels of Dll4 expression (Figure 1B).
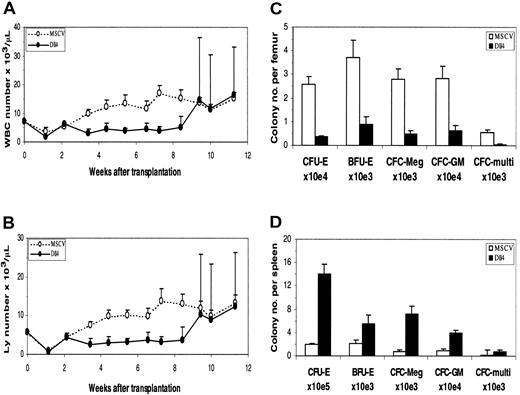
Results of PB analysis in transplant recipients are shown in Figure2. In the early phase of reconstitution, WBC (Figure 2A) and lymphocyte (Figure 2B) counts in theDll4-overexpressing mice were low compared with those of control mice. WBC and lymphocyte counts in someDll4-overexpressing mice started to increase at approximately 8 weeks after BMT, ranging from .026 to .28 × 109/L (26 to 280 × 103/μL) and .022 to .26 × 109/L (22 to 260 × 103/μL), respectively. All affected animals died within 2 weeks after the lymphocyte count elevation and exhibited decreased red blood cell counts and hematocrit (data not shown). At 16 weeks after BMT, 60% of the Dll4-overexpressing mice were dead.
Effects of
Dll4 overexpression on PB counts and colony formation. PB WBC (panel A) and lymphocyte (panel B) counts from control and Dll4-overexpressing animals, respectively. Data were pooled from 2 transplantation experiments. Twenty mice in each group received transplants. Results are mean ± SEM. WBC and lymphocyte counts in the last 3 data points show large error bars, reflecting that 2 of 20, 6 of 18, and 5 of 15Dll4-overexpressing mice had elevated WBC and lymphocyte counts. The effect of Dll4 overexpression on BM (panel C) and spleen (panel D) colony formation is shown. Mice were analyzed at 4 weeks after BMT. Results are mean ± SEM (n = 5).
The effects of Dll4 overexpression on hematopoietic precursors were evaluated in a colony assay. At 4 weeks after BMT, a 3-fold decrease of marrow-nucleated cell number was seen inDll4-overexpressing mice. The number of erythroid CFUs (CFU-Es), burst-forming units (BFU-Es), megakaryocyte colony-forming cells (CFC-Megs), granulocyte-macrophage CFCs (CFC-GMs), and multilineage CFCs per femur in Dll4-overexpressing mice decreased 7.2-, 4.1-, 5.7-, 4.6-, and 10.8-fold, respectively, compared with control mice (Figure 2C). At the same time, a 4-fold increase of splenic cellularity was observed in theDll4-overexpressing mice. The number of CFU-Es, BFU-Es, CFC-Megs, CFC-GMs, and multilineage CFCs per spleen increased 7.4-, 2.7-, 9.1-, 4.4-, and 4.4-fold, respectively (Figure 2D). At 8.5 weeks after BMT, the BM of Dll4-overexpressing animals had a 35% increase in cellularity and contained a large number of infiltrating T cells. Total CFCs were decreased 35-fold inDll4-overexpressing BM compared with controls, whereas splenic CFCs were increased 200-fold compared with controls. No significant difference was seen between the control andDll4-overexpressing mice in the ratios of erythroid, megakaryocytic, granulocyte/macrophage, and multilineage CFCs. These data demonstrate increased extramedullary hematopoiesis inDll4-overexpressing mice but no effect on the development of myeloid lineages.
Effects of Dll4 overexpression on lymphocyte development
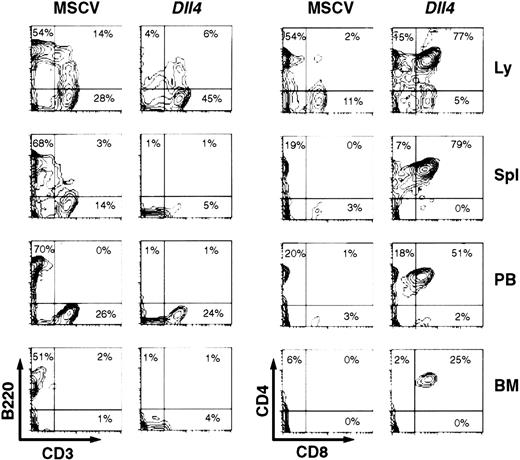
At 4 weeks after BMT, the lymph nodes, spleen, PB, and BM ofDll4-overexpressing mice showed few CD3−B220+ cells, but a considerable number of CD4+CD8+ cells (Figure3). Many of these CD4+CD8+ cells appeared to be CD3−(data not shown). Most of the CD4+CD8+ cells were TCRβ− (data not shown). The absolute number of B cells in the spleens (4.48 ± 2.07 × 10⁶; n = 5) and BM (0.13 ± 0.06 × 10⁶; n = 5) of the Dll4-overexpressing mice was lower (P < .01) than in the spleens (112.5 ± 7.7 × 10⁶) and BM (1.59 ± 0.13 × 10⁶) of control mice, reflecting the decrease in B-cell percentages and suggesting a block in B-cell development. At 16 weeks after BMT, all survivingDll4-overexpressing mice had a virtual lack of CD3−B220+ cells in the lymph nodes, spleen, PB, and BM (data not shown). The Dll4-overexpressing mice showed a marked increase in number of CD3+ and TCRβ+ cells, accompanied by variable changes in CD4 and/or CD8 expression. Of 6 Dll4-overexpressing mice analyzed, 4 mice showed an increase in CD4+CD8+cells, and 1 of these 4 had an additional increase in CD4−CD8+ cells. The other 2 mice showed an increase in CD4−CD8− cells. These results demonstrate that overexpression of Dll4 blocks the development of B cells and alters the development of T cells at various stages.
Flow cytometry analysis.
Two-parameter contour plots show CD3 versus B220 (left) and CD8 versus CD4 (right) expression in lymph node (Ly), spleen (Spl), PB, and BM. Three control and 5 Dll4-overexpressing mice were analyzed. This figure shows a representative control and aDll4-overexpressing animal at 4 weeks after BMT.
Dll4 overexpression induced transplantable T-cell leukemia/lymphoma
Histological analysis was performed on 15 control and 16Dll4-overexpressing BDF1 mice from 5 independent experiments at 4 to 19 weeks after BMT. TheDll4-overexpressing mice developed a phenotype characterized by progression of T-cell lymphoproliferative disease (restricted to BM and lymphoid tissues) to monoclonal T-cell leukemia/lymphoma involving multiple organs.
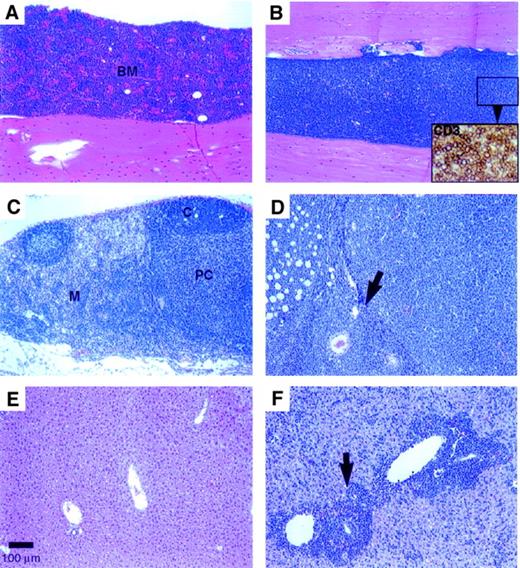
In the early lymphoproliferative disease (by 4 weeks after BMT), a 2- to 3-fold increase in the spleen weight was evident with no apparent changes in the thymus or liver weights compared with the vector control group. In more advanced disease (by 12 weeks after BMT), marked to massive enlargement of the spleen (with 2- to 34-fold increase in weight), liver (1.4- to 5.8-fold weight increase), and lymph nodes was evident with loss of body weight in the Dll4-transduced mice. The early lymphoproliferative disease was characterized by multifocal (at 4 weeks) to diffuse (at 12 weeks; Figure4B) infiltration of the BM by sheets of densely packed, monomorphic CD3+ T cells (Figure 4B, inset). The cytomorphology of these cells differed among individual animals: the infiltrates were predominantly medium lymphoblasts in some mice and medium to large polymorphous lymphocytes with a prominent “starry sky” macrophage pattern in other mice. The thymus appeared normal (2 of 5 mice) or infiltrated (3 of 5 mice) at 4 weeks after BMT, but had lobular to diffuse thymic atrophy (involution) by 12 weeks after BMT. In the early disease, the mesenteric lymph nodes were enlarged with conspicuous expansion of the medullary cords by CD3+ T cells accompanied by B-cell (follicular) hypoplasia and paracortical hypocellularity. In later stages, the lymph nodes and perinodal tissues were diffusely infiltrated by neoplastic T cells (Figure 4D). In the small intestine, the Peyer patches (gut-associated lymphoid tissue) were also enlarged and were composed of monomorphic T cells, which infiltrated the overlying intestinal mucosa and villi. The spleen had a prominent periarteriolar infiltrate of monomorphic CD3+ T cells extending into the red pulp, which also had extramedullary hematopoiesis.
Histopathology findings.
(A) Control animal recipient of BM cells transduced with parent MSCV vector; H&E stain (100 × magnification) (scale bar: 100 μm). (B)Dll4-overexpressing animal with a diffuse lymphoblastic infiltrate; H&E (10 ×). Inset: closeup of CD3+ T cells, ABC immunostain (400 ×). (C) Mesenteric lymph node from a control mouse showing normal cortical follicles, paracortical area, and medullary cords; H&E (100 ×). (D) Enlarged mesenteric lymph node from a Dll4-overexpressing mouse with diffuse lymphoblastic infiltration of the node (arrow denotes lymph node capsule) and perinodal adipose tissue; H&E (100 ×). (E) Liver from a control mouse with normal hepatic architecture; H&E (100 ×). (F) Enlarged liver from a Dll4-overexpressing mouse with lymphoblastic infiltration of the periportal areas (arrow) and sinusoids throughout the liver; H&E (100 ×). Animals were at 12 weeks after BMT.
In more advanced disease, Dll4-overexpressing mice had disseminated T-cell leukemia/lymphoma with enlargement, architectural effacement, and multifocal to diffuse infiltration of lymphoid and nonlymphoid organs and tissues, including the BM, lymph nodes (Figure4D), spleen, liver (Figure 4F), lung, heart, thymus, urogenital tract, and PB (frank leukemia). In some mice, the BM cavity had focal to diffuse myelofibrosis with new bone formation (fibro-osseous lesion) and scattered remnants of hematopoietic cells mixed with neoplastic lymphocytes. Similar neoplastic lymphoid infiltrates were also found surrounding vessels or in the interstitial tissues in the heart, kidneys, stomach, pancreas, lung, brain (leptomeninges and choroid plexus), thyroid, ovary, oviduct, uterus, cervix, and urinary bladder. The T-cell leukemia/lymphoma in the Dll4-overexpressing mice were morphologically heterogenous. Consistent with fluorescence-activated cell sorting (FACS) analysis results, these data suggest that overexpression of Dll4 results in the proliferation and transformation of T cells at different developmental stages.
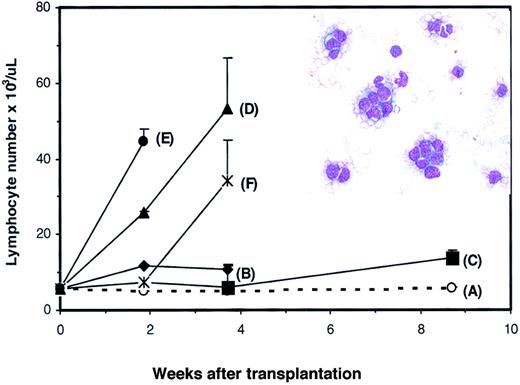
To confirm the development of T-cell transformation in theDll4-overexpressing mice, spleen cells were harvested from 5Dll4-overexpressing mice 17 weeks after BMT and injected into 50 secondary nonirradiated BDF1 mice. Each donor spleen was injected into 10 recipients, and each recipient received 2 × 10⁷ spleen cells. Four of 5 groups (Figure5B,D-F) developed acute lymphoma that was characterized by elevated WBC, lymphocytes, and lymphoblasts in PB (Figure 5, inset). All animals in groups (panels) B, D, E, and F died between 4 to 6 weeks after BMT. Seven of 10 mice in group C were alive at 9 weeks after BMT with elevated WBC and lymphocyte counts. When spleen cells from group C were further transplanted into tertiary normal BDF1 mice, elevation of WBC, lymphocytes, and lymphoblasts was observed at 3 to 4 weeks after transplantation (data not shown). Transplantation of spleen cells from the control group did not affect lymphocyte number in secondary recipients (Figure 5A). Histological analysis of the viable mice confirmed the development of aggressive lymphoma in multiple organs (data not shown).
PB lymphocyte counts in secondary transplant recipients.
Nonirradiated BDF1 mice received transplants of spleen cells from control (panel A) or Dll4-overexpressing (panels B-F) donors. Results are shown as mean ± SEM (n = 10). Inset shows representative blood smear of a recipient of spleen cells from aDll4-overexpressing animal.
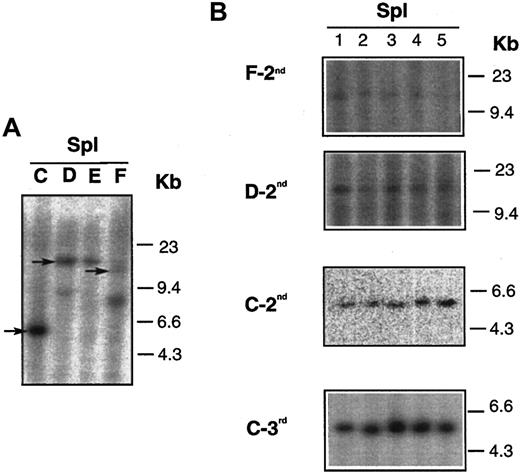
We also analyzed the lymphoma clonality in donor and recipient mice by proviral junction analysis. DNA was extracted from BM and spleens of donor mice and from secondary and tertiary transplant recipients. DNA samples were digested with SpeI, which has a single recognition site within the provirus (Figure 1A), and hybridized with 32P-labeled neo fragment.Dll4-overexpressing animals that were used as donors at 17 weeks after BMT had 1 or 2 virally marked clones (Figure6). The expansion of single clones (marked by arrows in panel A) was seen in the spleens of secondary (groups F-2nd, D-2nd, C-2nd) and tertiary (group C-3rd) transplant recipients (panel B). The same results were also seen in the BM of the secondary and tertiary transplant recipients (data not shown).
DNA analysis of mice who received serial transplants.
(A) Results of DNA isolated from spleens of 4Dll4-overexpressing donors (C,D,E,F). (B) Results of DNA isolated from spleens of secondary (F-2nd, D-2nd, and C-2nd, also shown in Figure 5) and tertiary (C-3rd) recipients. Arrows in panel A indicate that the same clones were seen in secondary and tertiary recipients, shown in panel B.
Expression of Dll4 in the thymus
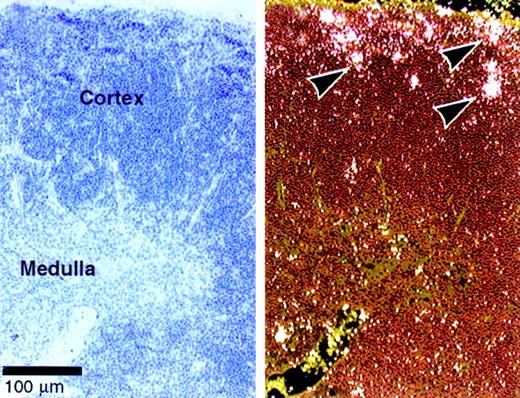
Dll4 is expressed predominantly in vascular endothelial cells.9 Our data suggest a role for Dll4 in T-cell development. We therefore examined whether Dll4 is expressed in the thymus of normal mice by in situ hybridization.Dll4 is expressed in normal cortical thymocytes, especially in the subcapsular region (Figure 7), where immature double-negative and double-positive thymocytes are located and where Notch1 and Notch3 are also highly expressed.14 Expression of Dll4 was also shown in the vascular endothelial cells as previously reported.9
Expression of
Dll4 in normal thymus. In situ hybridization was performed on thymus of 4-week-old BDF1 mice. The bright and dark field views are shown on the right and left panels, respectively. Arrows indicate the expression ofDll4 in the subcapsular thymocytes. Dll4 is also expressed in thymic vascular endothelial cells.9
Expression of Dll4 in lymphoma cells
To address whether all lymphoma cells express Dll4, we examined Dll4-overexpressing animals at 10.5 weeks after BMT. These animals were diagnosed with lymphoma by histopathological analysis. We performed imunohistochemistry staining using anti-CD3 antibodies and in situ hybridization using antisense neo andDll4 genes on adjacent liver and spleen sections. Massive infiltration with lymphoblastlike (lymphoma) cells were seen in both spleen and liver. Most of the lymphoblastlike cells were CD3+ (Figure 8A, mouse 21). Approximately one third of the lymphoma cells expressed high levels of neo RNA message (Figure 8B). Approximately one tenth of the lymphoma cells expressed high levels ofDll4 (Figure 8C). Most of the CD3+ cells expressed undetectable levels of neo or Dll4 RNA. Mouse 21 was repopulated with one major (Figure 8D, labeled a) and one minor clone (Figure 8D, labeled b). Similar results were obtained with other analyzed animals.
Expression of
Dll4 in lymphoma cells. Immunohistochemistry staining liver section from a Dll4-overexpressing animal (no. 21) with anti-CD3 antibody at 10.5 weeks after BMT (panel A). Results from in situ hybridization with antisense neo(panel B) and Dll4 (panel C) are shown in dark field view. Proviral junction analysis (panel D) of DNA from spleens of a normal mouse (−) and mouse no. 21 digested withSpeI shows that the animal contained one major (a) and one minor clone (b).
Discussion
Dll4 may play a role in the control of endothelial biology because it is highly expressed in embryonic and adult vascular endothelium.9 In our studies, we established a mouse model to explore the biological role of Dll4 in vivo by overexpressing the Dll4 cDNA in the hematopoietic system using retroviral-mediated gene transfer. We evaluated systematic effects in the Dll4-overexpressing mice but did not observe any significant endothelium-related phenotype. Instead, the phenotype in our animals closely mimics that reported by Pear et al3that is due to persistent activation of Notch1. We suggest thatDll4 is a natural ligand for Notch1 and plays an important role in T-cell development. This notion agrees with reports describing the effects of activation of Notch1 in a number of in vivo models. Constitutively activated Notch1 (TAN-1) was demonstrated to be responsible for the development of a subset of T-ALL in humans.2 Subsequently, it was shown that mice that received BM cells that were transduced with retrovirus encoding Notch1-IC developed clonal T-cell leukemia.3 When these animals were examined at an early stage of reconstitution, mice that overexpressed the Notch-IC produced immature, double-positive T cells in the BM and a blockage in early B-cell development, but myelopoiesis was not affected.15 Notch-IC–overexpressing animals eventually developed T-cell leukemia/lymphomas. Overexpression ofDll4 had little stimulatory effect on myeloid development, although Notch1 expression has been shown in murine hematopoietic precursor cells,16 cells in the monocyte/macrophage lineage,17 and human CD34+cells.18 19 Clearly, ectopic overexpression of Dll4suppresses hematopoiesis in the BM and also enhances extramedullary hematopoietic activities in the spleen and other organs. Such a shift of hematopoiesis from the BM to extramedullary sites was seen as early as 4 weeks after BMT. Whether suppression of hematopoiesis in BM is a direct effect of the action of Dll4on Notch1 and/or Notch4 or a secondary effect resulting from changes in the BM microenvironment is unclear.
Several studies have suggested that Notch1 influences the lineage decision of uncommitted T-cell precursors.20-22 That is, Notch1 activation favors the development of CD8 versus CD4 T cell and αβ versus γδ TCR usage and also modulates T-cell versus B-cell lineage commitment. In the Dll4-overexpressing mice, we showed small absolute and relative numbers of B220+ cells in the lymph nodes, BM, spleen, and PB, suggesting a block in B-cell development. We demonstrated that Dll4 overexpression resulted in accumulation of immature CD4+CD8+ T cells in BM, PB, lymph nodes, and spleen and reduction of CD4+CD8− in the lymph nodes but no significant changes in the CD4−CD8+ population at 4 weeks after BMT. We also observed predominant T-cell populations expressing CD4+CD8+, CD4−CD8+, or CD4−CD8− in individualDll4-overexpressing animals at 16 weeks after BMT. Our data suggest that Dll4 does not affect T-cell differentiation after the T-cell versus B-cell fate decision but instead alters the proliferative and/or apoptotic properties of developing T cells, leading to aggressive leukemia/lymphoma by constitutive activation of Notch1. The mechanism of overexpressing Dll4 to induce lymphoma in vivo needs further examination. We also generated mice overexpressing a secreted form of Dll4 (Dll4-Fc). The Dll4-Fc–overexpressing animals developed moderate T-cell proliferation, but none of the mice developed lymphoma during a 10-month follow-up (data not shown). These results suggest that membrane-bound Dll4 and/or cell-cell contact may be required for the development of lymphoma. The results from in situ hybridization in liver sections of Dll4-overexpressing mice (Figure 8) showed that most lymphoma cells did not express detectable levels ofDll4 RNA. It is possible that the lymphocytes expressing little or no Dll4 were stimulated and expanded by a small portion of cells that expressed high levels of Dll4 to progress to advanced lymphoma. By in situ hybridization, we have demonstrated that Dll4 is highly expressed in the subcapsular cortical region of the thymus, a region that contains immature thymocytes. Subcapsular thymocytes also express high levels of Notch1.14 We further determined bcl-2 and bcl-XL expression in the Dll4-overexpressing mice at 4, 6, and 18 weeks (16 weeks in primary animals plus 2 weeks in secondary nonirradiated recipients) using RNAase protection assay. The expression of bcl-2 was significantly down-regulated in all theDll4-overexpressing mice (data not shown). The expression of bcl-XL was slightly decreased at 4 and 6 weeks, but significantly reduced in the lymphoma cells (data not shown). These results suggest that Dll4 may also involve T-cell survival in vivo. Taken together, our studies extend the biological findings of Notch1 described previously15 22 and strongly suggest that the interaction of Dll4 specifically with Notch1 may influence normal T-cell development.
The authors are employees of Amgen Inc.
The publication costs of this article were defrayed in part by page charge payment. Therefore, and solely to indicate this fact, this article is hereby marked “advertisement” in accordance with 18 U.S.C. section 1734.
References
Author notes
Xiao-Qiang Yan, Amgen Inc 15-2-B, One Amgen Center Dr, Thousand Oaks, CA 91320; e-mail: xyan@amgen.com.



This feature is available to Subscribers Only
Sign In or Create an Account Close Modal