Acute myeloid leukemia (AML) is associated with aquired genetic defects that arise in early hematopoietic precursor cells. The incidence of AML increases with age and ranges from 0.7 to 3.9 cases per 100 000 between 0 and 60 years and from 6.7 to 19.2 cases per 100 000 above 60 years with a median of more than 70 years.1 The prognosis of patients with AML is age-dependent, with chemoresistance being observed more frequently with increasing age.2 This is supposed to be based on differences in the biology of AML in younger and older patients. Hence, 2 different mechanisms of genetic defects can be distinguished. Balanced chromosomal translocations lead to leukemia-specific fusion-transcripts without gain and loss of chromosomal material, whereas unbalanced chromosome abnormalities lead to multiple gains and losses of genetic material. The balanced translocations such as t(15;17), t(8;21), and inv(16)/t(16;16) are reported to be more frequent in younger patients, whereas in elderly patients unbalanced abnormalities mostly involving complete or partial losses of chromosomes 5 and 7 and, in particular, complex aberrations are detected more often.3-6 The validity of these data is hampered, however, by the fact that respective data are mainly obtained from patients that were entered into clinical trials and may therefore contain a selection bias that precludes a generalization to the whole AML population. This note of caution is emphasized by the fact that the proportion of patients that are entered into clinical trials decreases dramatically with increasing age and renders data on age-specific differences in cytogenetic subgroups questionable. Here we show that, on the basis of a population-based registration of cytogenetics in patients with a primary diagnosis of AML, the incidence of AML with balanced translocations increases slowly but continuously with age and that the incidence of AML with complex aberrant karyotypes increases exponentially with age.
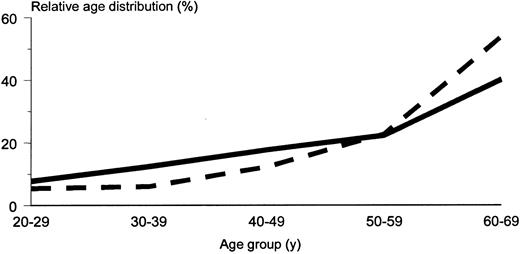
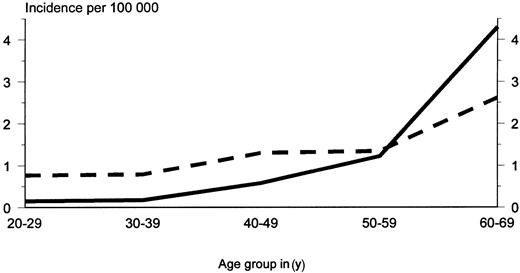
In order to obtain a better approximation of the real incidences of age-dependent differences in cytogenetically defined AML subgroups, 1566 adult patients aged 20 years to 69 years with de novo AML from 128 referring hospitals in Germany were analyzed from January 1997 to September 2000. Cytomorphologic, cytogenetic, and molecular genetic analyses were performed in all of these patients in parallel. The age-specific distribution of this cohort corresponds to the age-specific incidence of AML (Figure 1). The 4 most frequent balanced translocations were present in 193 patients (12.3%; t(15;17) in 4.0%, t(8;21) in 3.7%, inv(16)/t(16;16) in 3.8%, and t(11;V)(q23;?) involving the MLL gene in 0.8%). Complex aberrant karyotypes (at least 3 numeric or structural clonal abnormalities5) were present in 143 patients (9.1%). The age-specific incidences of these 4 groups were calculated on the basis of the distribution of the general population of Germany in 1998.7 In the group of patients with balanced translocations, this incidence ranges from 0.76 to 2.61 cases per 100 000 and shows a 3.4-fold increase with increasing age (P < .0001; Figure 2). In contrast, in the group of patients with complex aberrant karyotypes the incidence increases sharply with higher age (P < .0001; Figure 2). It is 0.15 cases per 100 000 at ages 20 to 29 years and reaches a 29-fold higher level of 4.30 cases per 100 000 at ages 60 to 69 years. The present data indicate that these 2 genetically defined subgroups of AML differ strikingly in their age-specific incidences. This suggests that 2 different mechanisms of malignant transformation are involved. In AML with complex aberrant karyotypes, these mechanisms might be more similar to those observed in solid tumors of the elderly, as their incidences also dramatically increase with age and multiple genetic hits aquired during life-time are necessary for their manifestation.8 9 Furthermore, this might imply that totally different treatment approaches are needed for these 2 genetically defined subgroups of AML.
Relative age distribution of AML patients in the current series and in the SEER data.
Solid line indicates current series; dashed line, SEER.
Relative age distribution of AML patients in the current series and in the SEER data.
Solid line indicates current series; dashed line, SEER.
Incidence of AML with balanced translocations compared with incidence of AML with complex aberrant karyotypes.
Dashed line indicates balanced translocations; solid line, complex aberrant karyotypes.
Incidence of AML with balanced translocations compared with incidence of AML with complex aberrant karyotypes.
Dashed line indicates balanced translocations; solid line, complex aberrant karyotypes.


This feature is available to Subscribers Only
Sign In or Create an Account Close Modal