Abstract
It is hypothesized that oxidative reactions of hemoglobin driven by reactive oxygen species in the vasculature lead to endothelial cell injury or death. Bovine aortic endothelial cells were incubated with diaspirin cross-linked hemoglobin (DBBF-Hb), developed as a hemoglobin-based oxygen carrier, and hydrogen peroxide (H2O2), generated by the glucose oxidase system. The low steady flux of H2O2 oxidizes the ferrous form of DBBF-Hb and drives the redox cycling of ferric and ferryl DBBF-Hb. Cells underwent rounding, swelling and detachment, and accumulated in the G2/M phase of the cell cycle. G2/M arrest preceded the onset of apoptosis as determined by increases in phosphatidylserine (PS) externalization and sub-G1 events. Redox cycling of unmodified hemoglobin also led to G2/M arrest and apoptosis. The rate and extent of DBBF-Hb oxidation correlated with the onset and extent of G2/M arrest and apoptosis and induced significant decreases in soluble reduced thiols. Earlier depletion of glutathione by pretreatment with buthionine sulfoximine rendered cells more susceptible to G2/M arrest and apoptosis. The caspase inhibitor, z-VAD-fmk, had no effect on the induction of G2/M arrest but completely inhibited the subsequent increases in PS externalization and sub-G1 events. Catalase inhibited DBBF-Hb oxidation, the loss of thiols, and the onset of G2/M arrest and apoptosis. These data support a causative role for the ferric–ferryl redox cycle in the development of endothelial cell injury.
Introduction
The release of hemoglobin or myoglobin from its cellular environment during certain pathologic conditions leads to hemoprotein-induced vascular damage or dysfunction.1-6Adverse microvascular effects of cell-free hemoglobin have also hindered the development of safe and efficacious hemoglobin-based oxygen carriers.7 These agents are chemically stabilized forms of hemoglobin designed to act as oxygen and volume replacement therapy in clinical settings such as emergency resuscitation and elective surgery.7-9 Although the molecular mechanisms of hemoprotein-mediated cytotoxicity are not completely understood, the interactions of heme (protein or nonprotein bound) with hydrogen peroxide (H2O2), organic peroxides (ROOH), peroxynitrite (ONOO−), and nitric oxide (NO) have been implicated.1-7
The reaction of hemoglobin with H2O2 or ROOH leads to a series of reduction-oxidation (redox) transitions between the ferrous, ferric, and ferryl states of the protein. The oxy and deoxy forms of ferrous hemoglobin (HbFe2+) and ferric hemoglobin (HbFe3+) can each react with H2O2 to produce ferryl hemoglobin (HbFe4+) (equations 1 and 2).10-12 In the case of HbFe3+, this reaction also generates a protein-based radical that can be detected by electron paramagnetic spectroscopy.12 HbFe4+ can, in turn, be reduced to HbFe3+ autocatalytically or after substrate oxidation.10-12 Low and continuous fluxes of H2O2 or ROOH can drive and sustain the transition between HbFe4+ and HbFe3+ (ie, redox cycling)12:
HbFe4+ can initiate lipid peroxidation and oxidize other biologic molecules.13-15 HbFe4+generated from the interaction of tert-butyl hydroperoxide and hemoglobin was cytotoxic to vascular smooth muscle cells.16 A causative role for the redox cycling of myoglobin has been implicated in rhabdomyolysis-induced renal failure and myocardial reperfusion injury.2,17-19 Another potential mechanism of hemoglobin toxicity involves the oxidative degradation and release of heme or iron, which can react with H2O2 to form the highly toxic hydroxyl radical through Fenton chemistry. However, the significance of this pathway has been debated because of the high oxidant concentrations required to release heme or iron from hemoglobin.20
Endothelial cells are especially susceptible to hemoglobin-induced toxicity because of their proximity to circulating blood. Enzymes such as xanthine oxidase, NADH–NADPH oxidase, and myeloperoxidase may play prominent roles in driving the oxidative reactions of hemoglobin in the vasculature.21 Increased oxidant production or antioxidant depletion associated with ischemia reperfusion, hemorrhagic shock, and septic shock may render the vasculature even more susceptible to hemoprotein-induced damage.22-26 These factors might have contributed to the microvascular events associated with the preclinical and clinical use of DCLHb (Baxter Healthcare, Deerfield, IL) and DBBF-Hb (Walter Reed Army Institute of Research, Washington, DC), the commercial and noncommercial analogues of diaspirin cross-linked hemoglobin, respectively.8,27-30 Extensive in vivo and in vitro research on DCLHb and DBBF-Hb continues to provide a useful basis for correlating the toxicity of hemoglobin-based oxygen carriers with the redox chemistry of hemoglobin.30
Previously, we showed that endothelial cells incubated with DBBF-Hb and bolus amounts of H2O2 underwent apoptosis, necrosis, or both.31 We also detected the ferryl form of DBBF-Hb in an endothelial cell model of hypoxia and reoxygenation, and its formation closely paralleled increases in lipid peroxidation.32,33 Recently, we demonstrated a direct correlation between the formation of DBBF-HbFe4+ by bolus H2O2 and the depletion of endothelial cell glutathione (GSH).34 Furthermore, we showed that prior depletion of cellular GSH may exacerbate the cytotoxicity of DBBF-Hb and bolus H2O2.34 However, the addition of high bolus amounts of oxidants by themselves causes apoptosis or necrosis; thus, it has been difficult to distinguish thetrue component of cytotoxicity mediated by hemoglobin redox reactions.34 Use of the glucose oxidase system to enzymatically generate H2O2 has been shown to better mimic the physiologic delivery of H2O2.35-37 Continuous generation of low levels of H2O2 can sustain the redox cycling of HbFe3+ and HbFe4+ and can allow the determination of hemoglobin-induced cytotoxicity without the confounding effects of bolus oxidant addition.
In the current study, we investigated the cytotoxicity of DBBF-Hb and glucose oxidase-generated H2O2 in cultured bovine aortic endothelial cells. We also examined the role of cellular thiols by depleting intracellular GSH with buthionine sulfoximine, mimicking the lack of antioxidant defenses associated with pathologic conditions. We found that the redox cycling of DBBF-Hb by low levels of enzymatically generated H2O2 induces G2/M cell cycle arrest, which is then followed by apoptosis of growth-arrested cells. These findings provide new insight into the mechanisms of hemoprotein-induced endothelial cell injury and may have direct implications on the safety evaluation of hemoglobin-based oxygen carriers.
Materials and methods
Materials
Endothelial cell growth medium (EGM) containing 5.6 mM glucose and fetal bovine serum (FBS) was obtained from Clonetics (San Diego, CA). Phosphate-buffered saline (PBS) and Hanks balanced salt solution (HBSS) containing 5.6 mM glucose were obtained from Life Technologies (Grand Island, NY). Glucose oxidase (GOX, type X-S derived fromAspergillus niger, 100 000-250 000 U/g solid), 5,5 dithio-bis (2-nitrobenzoic acid) (DTNB), propidium iodide (PI), 5-sulfosalicylic acid, DL-buthionine-[S, R]-sulfoximine (BSO), bovine liver catalase (catalog number C-1345), 3-(4,5-dimethylthiazol-2-yl)-2,5-diphenyltetrazolium bromide (MTT),O-dianisidine-dihydrochloride, and horseradish peroxidase (type 2) were obtained from Sigma Chemical (St Louis, MO). Caspase inhibitor, z-VAD-fmk (benzyloxycarbonyl-Val-Ala-Asp(OMe)-CH2F) was purchased from Enzyme Systems Products (Livermore, CA).
Hemoglobin solutions
DBBF-Hb, free of superoxide dismutase and catalase, was a kind gift from the Walter Reed Army Institute of Research (Washington, DC). Hemoglobin was purified from outdated human red blood cells and reacted with bis(3,5-dibromosalicyl)fumarate (DBBF) to intramolecularly cross-link the α-99 lysine residues.38This modification prevents disassociation into αβ dimers and significantly increases the circulation time of DBBF-Hb compared to unmodified hemoglobin. The characteristics of DBBF-Hb are similar to those of DCLHb, except that DBBF-Hb was formulated in Ringers acetate whereas DCLHb was formulated in Ringers lactate.8 DBBF-Hb was aliquoted and stored at −80°C. DBBF-HbFe3+ and its cyanide derivative (DBBF-HbFe3+CN) was prepared as previously described.39 Chromatographically purified human hemoglobin, free of superoxide dismutase and catalase, was a kind gift from Hemosol (Etobicoke, ON, Canada). Red blood cells were isolated from whole human blood by centrifugation, washed 3 times in sterile PBS, and resuspended in PBS at a hematocrit level of 50%.
Endothelial cell culture
Bovine aortic endothelial cells (BW-6002) were obtained from Clonetics. Cells were grown in EGM supplemented with 10 ng/mL human recombinant epidermal growth factor, 1 μg/mL hydrocortisone, 10 μg/mL bovine brain extract, 5% FBS, 50 μg/mL gentamicin, and 50 ng/mL amphotericin-B. Cells were maintained in 100-mm dishes at 37°C in a humidified atmosphere of 95% air and 5% CO2. For experiments, cells were plated in 6-well plates and reached confluence within 2 to 3 days. For harvesting, cells were washed with HEPES-buffered saline and incubated with 0.025% trypsin–0.01% EDTA for 5 minutes at 37°C. After cell detachment, trypsin-neutralizing agent was added and cells were centrifuged at 220g for 5 minutes at 4°C. Cell counts were obtained using a Coulter counter (Hialeah, FL). Experimental data were obtained from bovine aortic endothelial cells in the second to eighth passages.
Experimental cell treatments
Cells were grown in complete EGM for 24 hours before the medium was replaced with fresh complete EGM with or without 1 mM BSO. After 24 hours, normal or BSO-treated cells were washed with HBSS and incubated with 3 mL FBS-free supplemented medium or medium containing DBBF-Hb, GOX, or both. DBBF-Hb was added to wells just before the addition of GOX. For caspase inhibition experiments, z-VAD-fmk (40 μM) was added 90 minutes before treatment and then during the treatment period. Cell morphology was viewed by phase-contrast microscopy using an Olympus model CK2 inverted microscope equipped with an SLR 35-mm camera (Olympus America, Melville, NY).
Analysis of hemoglobin oxidation products
Spectral analysis of hemoglobin was performed using a Hewlett-Packard HP-8453 rapid scanning diode array spectrophotometer (Agilent Technologies, Rockville, MD). Total hemoglobin concentration and its different oxidation states were measured using the Winterbourn method.40 Ferryl hemoglobin level was also determined by measuring the sodium sulfide (Na2S)–induced formation of sulfhemoglobin.10 Samples were reacted with 2 mM Na2S, and the concentration of sulfhemoglobin was calculated using the extinction coefficient of 10.5 mM−1at 620 nm.
Hydrogen peroxide measurement
H2O2 was measured using a spectrophotometric assay based on the peroxidase-catalyzed oxidation ofO-dianisidine.35 GOX activity was measured in reaction mixtures containing GOX, 250 μM O-dianisidine, and 10 U/mL horseradish peroxidase in HBSS, pH 7.4, at 25°C. The absorbance increase at 460 nm was recorded for 15 minutes and was converted to μM H2O2/min using an H2O2 calibration curve prepared in HBSS. Extracellular H2O2 was measured by adding 950 μL culture samples to 1 mL cuvettes containingO-dianisidine and horseradish peroxidase. Absorbance was measured at 460 nm and was converted to concentration using an H2O2 calibration curve prepared in supplemented FBS-free medium.
Soluble reduced thiol determination
Soluble reduced thiols were measured using the DTNB colorimetric assay.34 Briefly, cells were washed with 2 mL HBSS, and 0.6 mL of 2% (wt/vol) 5-sulfosalicylic was added for solubilization and deproteinization. After centrifuging the samples for 5 minutes at 10 000g, 500-μL aliquots were mixed with 500 μL freshly prepared DTNB solution (0.3 M sodium phosphate, 10 mM EDTA, and 0.2 mM DTNB). After 5 minutes, the absorbance was measured at 412 nm. Calculations were based on the extinction coefficient of 13.4 mM−1 cm−1 derived from GSH standards.
Annexin-V–propidium iodide assay
Nonadherent and adherent cells, harvested by trypsinization, were pooled, washed twice in HBSS without calcium or magnesium, and resuspended in 1 mL assay buffer containing 10 mM HEPES/NaOH, 140 mM NaCl, 2.5 mM CaCl2, pH 7.4. Annexin V– fluorescein isothiocyanate (5 μL of 2 μg/mL; PharMingen, San Diego, CA) and PI (10 μL of 5 μg/mL) were added to a 100-μL aliquot (approximately 1 × 10⁵ cells) of this cell suspension. In most cases, the remainder of the cell suspension (0.9 mL) was immediately fixed in ethanol for later analysis of cell cycle (see below). After a 15-minute incubation in the dark at room temperature, stained cells were diluted with 350 μL assay buffer and analyzed using a FACScan flow cytometer (Becton Dickinson, San Jose, CA) and Cellquest analysis software. Data were collected from a minimum of 10 000 cells per sample. Stained cell populations were defined as: R1, viable or undamaged cells (annexin V−, PI−); R2, cells undergoing early apoptosis (annexin V+, PI−); and R3, necrotic or late apoptotic cells, (annexin V+, PI+).
DNA content measurement and cell cycle analysis
Nonadherent and adherent cells were washed with PBS and fixed with 2 mL ice-cold 70% ethanol for 30 minutes on ice or stored at −20°C until analysis. Fixed cells were centrifuged, washed with 10 mL PBS, and resuspended in 0.5 mL staining solution (0.1% Triton-X, 5 μg/mL PI, and 50 μg/mL RNAse). After 25 minutes in the dark at room temperature, samples were analyzed by flow cytometry. Data were collected from a minimum of 20 000 events per sample, and analysis was performed on gated populations excluding doublets, triplets, and quadruplets. Proportions of cells in the G1, S, and G2/M phases were quantified using the ModFit LT version 3 software (Verity Software House, Topsham, ME).
Statistical analysis
Data are represented as means ± SE for replicate experiments unless otherwise stated. Statistical analysis was performed using the unpaired 2-tailed Student t test with the SAS JMP (version 3.2) software (SAS Institute, Cary, NC).
Results
Redox cycling of DBBF-Hb by enzymatically generated H2O2
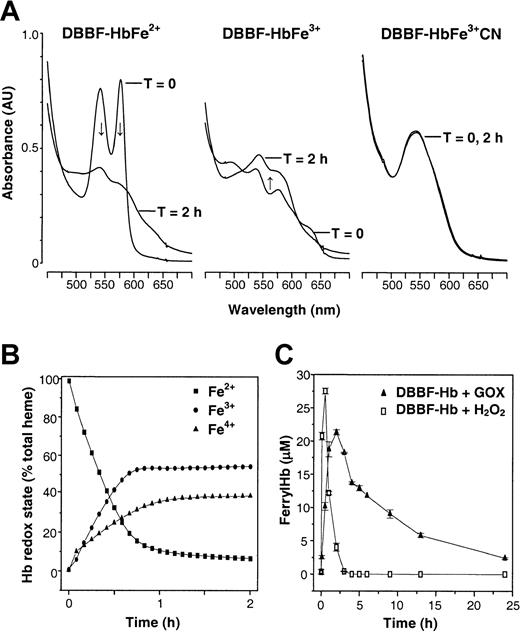
The reaction of DBBF-Hb with GOX-generated H2O2 could be monitored as changes in the visible spectrum of DBBF-Hb. Figure 1A shows the representative spectra of DBBF-HbFe2+ (the oxy form), DBBF-HbFe3+, or DBBF-HbFe3+CN before and 2 hours after the addition of GOX. In the case of DBBF-HbFe2+, the characteristic peaks at 541 and 577 nm disappeared gradually over the course of 2 hours. The resultant spectrum, with a shoulder at 580 nm and an absorbance increase in the 630-nm region, suggested a mixture of ferryl and ferric species. The addition of GOX to DBBF-HbFe3+ also produced a spectrum with peaks at 545 nm and a shoulder at 580 nm, indicating the formation of the ferryl species. In contrast, GOX produced few changes in the spectrum of DBBF-HbFe3+CN because cyanide prevents the interaction of H2O2 with the heme moieties of DBBF-Hb.
Oxidation of DBBF-Hb by low levels of enzymatically generated H2O2.
(A) Reaction mixtures were prepared containing 50 μM DBBF-HbFe2+, DBBF-HbFe3+, or DBBF-HbFe3+CN in HBSS, pH 7.4, 37°C. Representative visible spectra (450-700 nm) are shown before and 2 hours after the addition of 10 mU/mL GOX. After 2 hours, the spectra obtained with DBBF-HbFe2+ and DBBF-HbFe3+ were similar and reflected the formation of the Fe4+ intermediate. Arrows indicate the direction of change of the spectra. The characteristic spectrum of DBBF-HbFe3+CN was unchanged. (B) Time-dependent changes in the redox states after GOX addition to DBBF-HbFe2+. Visible absorbance spectra were collected every 5 minutes for 2 hours, and the oxidation states were calculated using the Winterbourn method. (C) Ferryl hemoglobin formation after the addition of 500 μM H2O2 or 10 mU/mL GOX to medium containing DBBF-Hb under culture conditions. Ferryl hemoglobin was measured using the sodium sulfide method as described in “Materials and methods.” Each point represents the mean ± SE for 4 to 5 samples.
Figure 1B shows the time-dependent fractional changes in the ferrous, ferryl, and ferric states after the addition of GOX to DBBF-HbFe2+. Before GOX was added, 98% of the total DBBF-Hb was in the ferrous state. The addition of GOX resulted in a slow oxidation of DBBF-HbFe2+ over the course of 60 minutes, accompanied by the formation of DBBF-HbFe4+ and DBBF-HbFe3+. The ferryl species produced during the initial 60 minutes was likely composed of the nonradical (equation 1) and radical (equation 2) forms of DBBF-HbFe4+, which are spectrophotometrically indistinguishable.10 In previous studies, we showed that the bolus addition of H2O2, in a molar ratio to heme ranging from 2.5 to 10, induces a rapid oxidation of DBBF-HbFe2+ to DBBF-HbFe4+, which then immediately begins to autoreduce to DBBF-HbFe3+.34 These redox transitions of DBBF-Hb lead to the rapid consumption of H2O2, and are consistent with the pseudoperoxidase activity of hemoglobin. In the current study, GOX was used to generate low fluxes of H2O2 to better sustain the cycling of ferric and ferryl species. Figure 1C shows the formation of ferryl hemoglobin after the addition of H2O2 (500 μM) or GOX (10 mU/mL) to medium containing DBBF-Hb. The results show that the peak levels of ferryl hemoglobin are approximately the same in both systems (ie, approximately 22 μM for GOX and 27 μM for bolus H2O2). However, the ferryl species clearly persists longer with the enzymatic system than with the bolus addition of H2O2.
Glucose oxidase treatment
The initial rates of H2O2 production by 2 and 10 mU/mL GOX in HBSS were 0.2 and 1.5 μM H2O2/min, respectively. Under culture conditions, extracellular H2O2 concentration was maintained at approximately 7 to 9 μM with 10 mU/mL GOX and 2 to 3 μM with 2 mU/mL GOX. Preliminary experiments were carried out to determine the cytotoxicity of GOX. We measured mitochondrial function using the MTT reduction assay33 and plasma membrane damage by flow cytometric analysis of PI uptake. Six-hour incubation with 2 and 10 mU/mL GOX decreased mitochondrial function by 5% and 20%, respectively, but there was no significant increase in PI uptake over the course of 24 hours. In contrast, 20 mU/mL GOX decreased mitochondrial function by 57% and induced significant plasma membrane damage after only 6 hours. In subsequent experiments, 2 and 10 mU/mL GOX were used to study the effects of DBBF-Hb redox cycling.
Morphologic examination of endothelial cells by phase-contrast microscopy
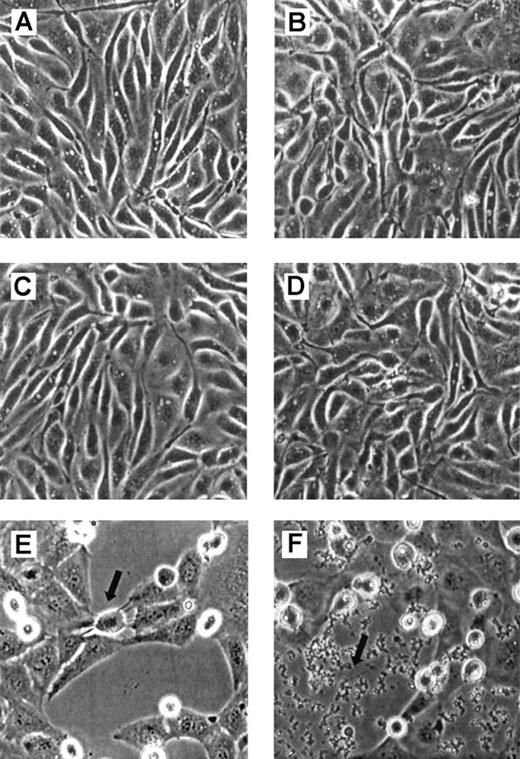
Endothelial cell morphology was assessed by phase-contrast microscopy after incubation with FBS-free medium alone or medium containing DBBF-Hb (50 μM), GOX (10 mU/mL), or both DBBF-Hb and GOX. Figure 2A-B shows the morphology of confluent endothelial cells incubated with FBS-free medium for 8 and 20 hours, respectively. These cells were morphologically indistinguishable from cells treated with GOX (Figure 2C-D) or DBBF-Hb alone. However, cells incubated with both DBBF-Hb and GOX showed signs of cytoplasmic swelling, rounding, and detachment from the monolayer (Figure 2E). Rounded cells contained condensed DNA structures with no detectable nuclear envelope, similar to cells undergoing mitosis. After a 20-hour incubation with DBBF-Hb and GOX, many detached rounded cells were still present but appeared smaller and were more irregularly shaped (Figure2F). Figure 2F also shows the accumulation of debris from dead cells or insoluble precipitates, possibly containing oxidized hemoglobin products.
Redox cycling of DBBF-Hb by glucose oxidase leads to morphologic changes in endothelial cells.
Endothelial cells were incubated with FBS-free medium alone (A, B), 10 mU/mL GOX (C, D) or 50 μM DBBF-Hb and 10 mU/mL GOX (E, F). Cells were viewed by phase-contrast microscopy and photographed (×20 objective). Photomicrographs were taken after 8 (left panels) and 20 (right panels) hours. (E) Detached cells out of the plane of focus appear bright. Arrow indicates a cell in the process of rounding and detaching. (F) Arrow points to cellular debris.
Redox cycling of DBBF-Hb induces G2/M cell cycle arrest and apoptosis
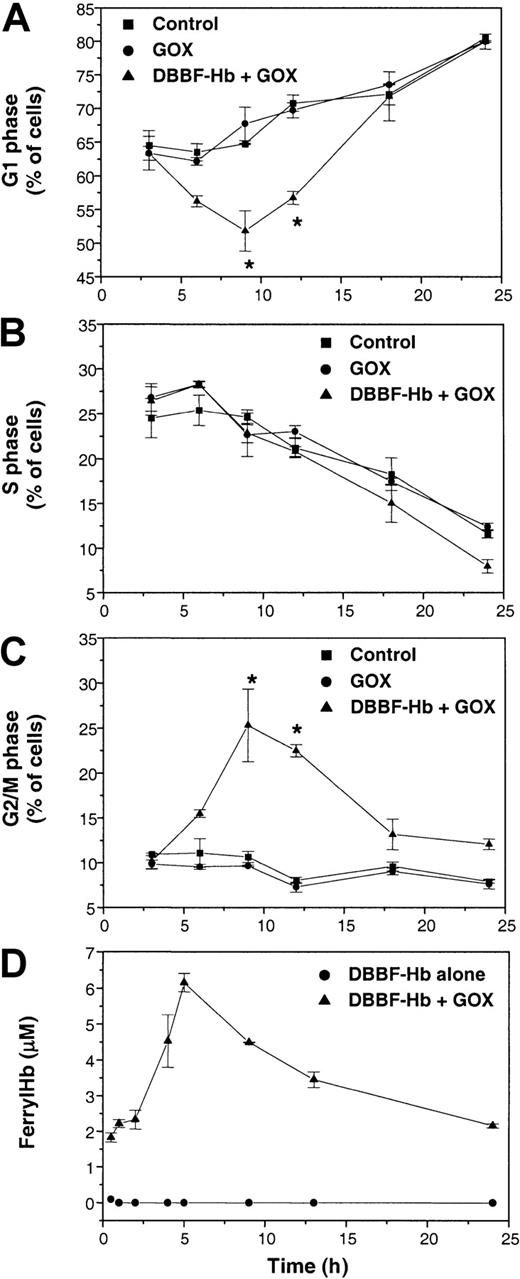
Figure 3 shows the proportion of cells in the G1, S, and G2/M phases of the cell cycle after incubation with FBS-free medium, GOX alone, or GOX and DBBF-Hb. GOX alone (2 mU/mL) had no effect on cell cycle progression compared to control. This was also the case with DBBF-Hb alone (5-200 μM) or 10 mU/mL GOX alone. However, the combination of DBBF-Hb and GOX produced a decrease in G1 cells from 63% ± 4% at 3 hours to 52% ± 6% at 9 hours (Figure 3A). The decrease in G1 cells was accompanied by a corresponding increase in G2/M cells from 10% ± 1% at 3 hours to 25% ± 4% at 9 hours (Figure 3C). During this period, no differences in the S-phase population were found among the different treatments (Figure 3B). These results suggest that a portion of cells treated with DBBF-Hb and GOX undergoes cell cycle arrest in the G2/M phase.
Redox cycling of DBBF-Hb induces cell cycle arrest in the G2/M phase.
Cells were incubated with FBS-free medium alone (control) or medium containing 2 mU/mL GOX with or without 50 μM DBBF-Hb. At each time interval, adherent and nonadherent cells were pooled, and fixed. DNA content was determined by flow cytometry after RNase digestion and PI staining. The fraction of cells in the (A) G1 phase, (B) S phase, and (C) G2/M phase of the cell cycle was calculated as described in “Materials and methods.” Each point represents the mean ± SE for 3 to 6 independent experiments. *P < .05 versus control. (D) Ferryl hemoglobin formation in medium containing DBBF-Hb with or without 2 mU/mL GOX. Ferryl hemoglobin was measured using the sodium sulfide method as described in “Materials and methods.” Each point represents the mean ± SE for 4 to 5 samples.
Figure 3A and C also show that the changes in G1 and G2/M are transient and that there is a return to control levels during the later stages of incubation. We investigated the possible correlation between this transient cell cycle arrest and the formation of ferryl hemoglobin. Figure 3D shows the formation of ferryl hemoglobin in medium containing DBBF-Hb with or without 2 mU/mL GOX. Ferryl hemoglobin was not detected in cultures with DBBF-Hb alone. In cultures containing DBBF-Hb and GOX, the levels of ferryl hemoglobin peaked at 5 hours and gradually declined over the remaining 24 hours. This pattern of ferryl hemoglobin formation correlated with the transient pattern of cell cycle arrest induced by GOX and DBBF-Hb, which further strengthened the link between the ferric–ferryl redox cycle and the induction of cell cycle arrest.
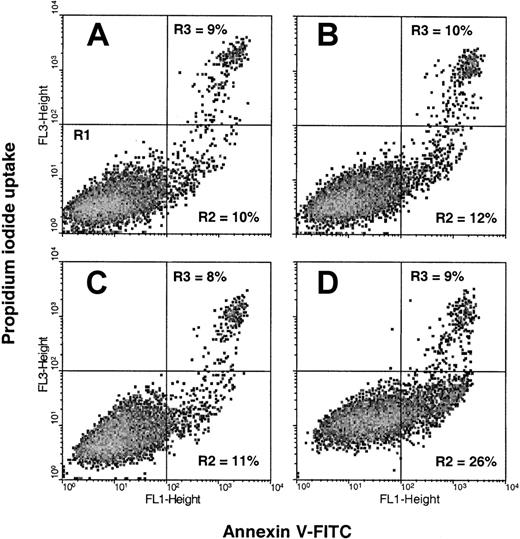
Because cell cycle arrest may be followed by apoptosis, we examined the possible relation between G2/M arrest and apoptosis. An early feature of cells undergoing apoptosis is the externalization of phosphatidylserine (PS) from the inner leaflet of the plasma membrane to the outer surface of the cell.41 We used flow cytometric analysis of the binding of fluorescence-labeled annexin V to externalized PS to quantify early apoptotic cells, and we measured PI uptake to assess cells in the later stages of apoptosis or cells that sustained direct plasma membrane damage. Figure4 shows the flow cytometric plots obtained using the annexin V–PI assay after an 18-hour incubation with medium alone or medium containing GOX (2 mU/mL), DBBF-Hb (50 μM), or both DBBF-Hb and GOX. The number of late apoptotic cells or directly damaged cells (R3) was similar in each group (8%-10%) and partly reflects the damage produced during the trypsin-harvesting procedure. DBBF-Hb or GOX alone did not increase the number of early apoptotic cells (R2) compared to control. In contrast, the number of early apoptotic cells increased to 26% after treatment with DBBF-Hb and GOX (Figure 4D).
Redox cycling of DBBF-Hb induces apoptosis.
Cells were incubated with (A) FBS-free medium alone or medium containing (B) 2 mU/mL GOX, (C) 50 μM DBBF-Hb, or (D) DBBF-Hb and GOX. After 18 hours, adherent and nonadherent cells were pooled and analyzed for PS externalization using the annexin V–PI assay (see “Materials and methods”). Each panel shows a typical flow cytometric plot of 10 000 cells per sample from a representative experiment. Early apoptotic cells (annexin V+, PI−) are shown in the lower right quadrant (R2), and late apoptotic–plasma membrane-damaged cells (annexin V +, PI+) are shown in the upper right quadrant (R3).
In another set of experiments, detached and adherent cells were collected separately after 15-hour treatment with DBBF-Hb (50 μM) and GOX (10 mU/mL). More than 90% of the detached cells were found to be early apoptotic (Annexin+/PI−), suggesting that most detached growth-arrested cells were committed to die by apoptosis. When detached cells were collected, washed, and resuspended in complete growth medium, none of them re-adhered or regained proliferative capacity. Microscopic examination of these detached cells in the subsequent 12 hours revealed dramatic changes in appearance that included shrinkage, denser cytoplasm, and accumulation of cellular debris or apoptotic bodies. Alternatively, microscopic examination of the adherent monolayers after 15-hour incubation with DBBF-Hb and GOX revealed that many of the remaining cells were able to proliferate when the treatment was replaced with complete growth medium.
Taken together, these results suggest that redox cycling of DBBF-Hb induces G2/M arrest and apoptosis in endothelial cells. The causative role of DBBF-Hb redox cycling is further supported by the fact that GOX added to DBBF-HbFe3+, which generates DBBF-HbFe4+ (Figure 1A), also produced growth arrest and apoptosis, whereas the addition of GOX to DBBF-HbFe3+CN did not induce these effects.
G2/M cell cycle arrest and apoptosis: unmodified hemoglobin versus DBBF-Hb
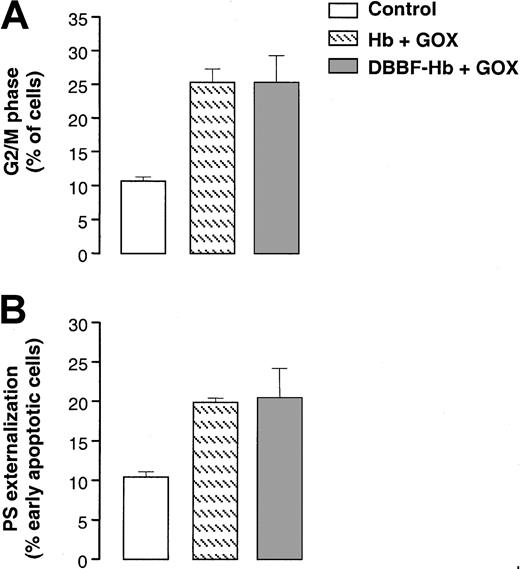
We compared cell cycle arrest and apoptosis induced by the redox cycling of DBBF-Hb with that induced by unmodified hemoglobin. Figure 5A shows that the accumulation of G2/M cells after a 9-hour incubation with 2 mU/mL GOX was similar between hemoglobin and DBBF-Hb. The degree of PS externalization after 18 hours was also similar between hemoglobin and DBBF-Hb (Figure 5B). Although hemoglobin induces similar effects in this cell culture system, it is likely that the extent or nature of these mechanisms would be different in vivo because of the greater half-life of DBBF-Hb. We also found that the addition of GOX to cocultures of red blood cells (0.5%) and endothelial cells did not lead to G2/M arrest or apoptosis, which further supports the involvement of the redox cycling ofcell-free hemoglobin in the induction of cell cycle arrest and apoptosis.
Redox cycling of unmodified hemoglobin induces G2/M arrest and apoptosis.
(A) The proportion of G2/M cells measured after a 9-hour incubation with medium alone or medium containing 2 mU/mL GOX and 50 μM DBBF-Hb or unmodified hemoglobin. Each value represents the mean ± SE of 3 to 5 independent experiments. (B) PS externalization measured after 18 hours for the same treatments as in panel A. Each value represents the mean ± SE of 3 to 5 independent experiments.
Role of intracellular thiol status in cell cycle arrest and phosphatidylserine externalization
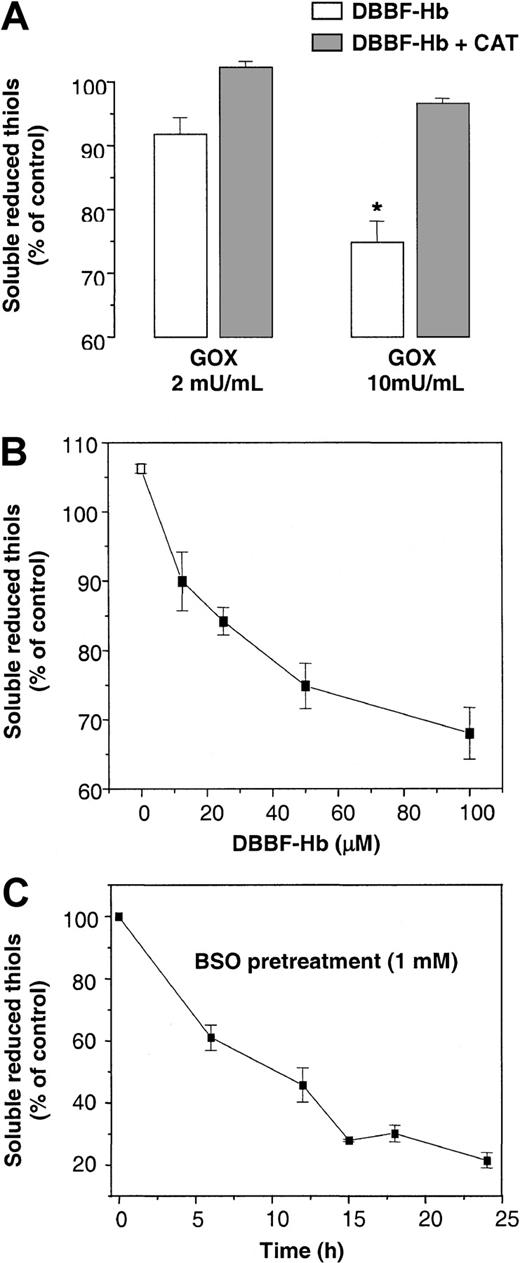
Figure 6 shows the effects of GOX and DBBF-Hb on the levels of soluble reduced thiols in endothelial cells. GSH represents the main reduced thiol measurable by this protocol because of its high intracellular concentration.34 DBBF-Hb alone had no effect on the level of soluble reduced thiols. After a 4-hour incubation, the combination of DBBF-Hb and 2 or 10 mU/mL GOX decreased the levels of soluble reduced thiols by 8% and 25%, respectively (Figure 6A). The inclusion of 100 U/mL catalase, a scavenger of H2O2, inhibited the loss of thiols induced by DBBF-Hb and GOX. Figure 6B shows that GOX alone induced a small but significant increase in thiol content, possibly because of the enhanced uptake of cystine.42 In the presence of GOX and DBBF-Hb, the decrease in thiol content was dependent on the concentration of DBBF-Hb (Figure 6B).
Redox cycling of DBBF-Hb alters intracellular thiol status.
(A) Soluble reduced thiols in endothelial cells were measured after a 4-hour incubation with 50 μM DBBF-Hb and GOX (2 or 10 mU/mL) in the presence or absence of 100 U/mL catalase. Values are reported as the means ± SE for 2 to 5 independent experiments performed in triplicate. *P < .05 versus control. (B) Soluble reduced thiols were measured after incubation with 10 mU/mL GOX and DBBF-Hb (0-100 μM). Values are reported as the means ± SE for 2 to 5 independent experiments performed in triplicate. (C) Time course for reduced thiol depletion in endothelial cells by BSO, an inhibitor of GSH synthesis. Cells were incubated in complete EGM medium with or without 1 mM BSO. Values were recorded as the percentage of control cells (medium alone) for each experiment and were reported as the means ± SE for 3 to 5 independent experiments performed in triplicate.
The loss of soluble thiols suggests a possible role for cellular thiols in protecting against the adverse oxidative effects of DBBF-Hb and GOX. To specifically study the role of GSH, we pretreated cells with BSO, an irreversible inhibitor of GSH production. BSO depletes 75% of reduced thiol content in endothelial cells after approximately 15 hours (Figure6C). BSO pretreatment had no effect on the viability, cell cycle progression, or PS externalization of endothelial cells.
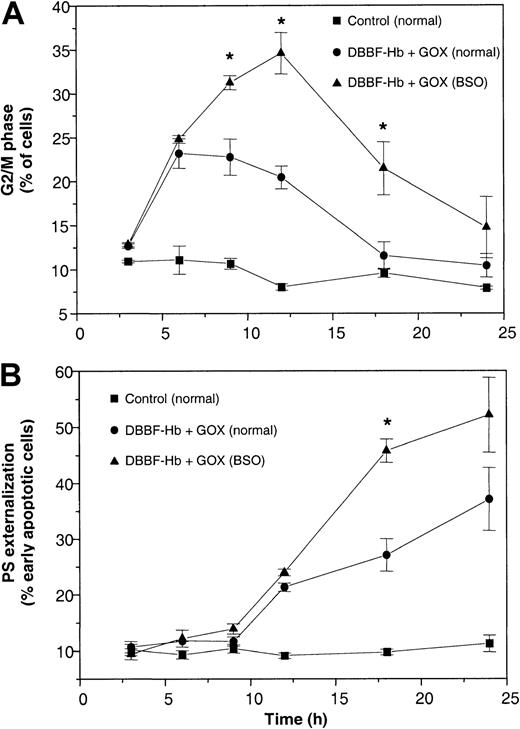
Figure 7 shows the time course for the induction of G2/M arrest and apoptosis in normal and BSO-pretreated cells incubated with DBBF-Hb and GOX (10 mU/mL). DBBF-Hb (5-200 μM) alone had no effect on DNA content or PS externalization with normal or GSH-depleted cells. Treatment with DBBF-Hb and GOX induced a similar increase in the G2/M cells during the first 6 hours in normal and GSH-depleted cells (Figure 7A). However, the maximum accumulation of G2/M cells at 12 hours was greater with GSH-depleted cells (34% ± 5%) than with normal cells (20% ± 2%). Figure 7B shows that DBBF-Hb and GOX also produced a greater accumulation of early apoptotic cells with GSH-depleted cells than with normal cells during the later stages of incubation. These data were further supported by microscopic examination that showed greater morphologic alterations in GSH-depleted cells than in normal cells. The time courses for G2/M arrest and PS externalization in normal and GSH-depleted cells clearly show that the accumulation of G2/M cells precedes the increase in PS externalization. The increase in PS externalization was also accompanied by an increase in sub-G1 events, an indirect measure of apoptosis.
Prior depletion of GSH exacerbates G2/M arrest and apoptosis.
Normal and BSO-pretreated cells were incubated with FBS-free medium alone or with medium containing 50 μM DBBF-Hb and 10 mU/mL GOX. At each time interval, adherent and nonadherent cells were pooled and analyzed for (A) DNA content and (B) PS externalization. No differences in DNA content or PS externalization were observed between media-treated normal and BSO cells. Values at each time point are reported as the mean ± SE of 3 to 6 independent experiments. *P < .05 versus DBBF-Hb and GOX in normal cells.
Catalase inhibits cell cycle arrest and apoptosis
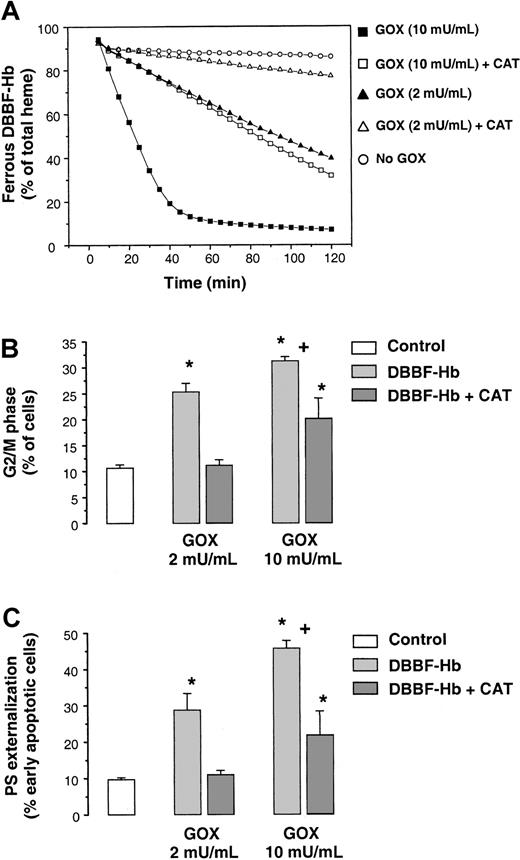
Figure 8A shows the effect of catalase on the oxidation of DBBF-HbFe2+ by GOX. The initial rate of DBBF-HbFe2+ oxidation produced by 10 mU/mL GOX in the presence of catalase was similar to that produced by 2 mU/mL GOX. In contrast, the rate of DBBF-HbFe2+ oxidation with 2 mU/mL GOX in the presence of catalase was close to that of DBBF-Hb alone. Higher catalase concentrations (400 U/mL) did not significantly increase inhibition. In this system, both DBBF-Hb and catalase competed for reaction with H2O2. With the lower flux of H2O2 (2 mU/mL GOX), the elimination of H2O2 by catalase was sufficient to prevent significant interaction of H2O2 with DBBF-Hb. However, with the higher flux of H2O2 (10 mU/mL GOX), catalase was less effective at preventing this interaction.
Catalase inhibits DBBF-Hb oxidation, G2/M arrest, and apoptosis.
(A) Reaction mixtures containing 50 μM DBBF-Hb, with or without 100 U/mL catalase, were incubated with or without GOX (2 or 10 mU/mL). Percentages of HbFe2+ were measured at 2-minute intervals for 2 hours using the Winterbourn equations. Representative tracings of 1 of 4 experiments are shown. (B) Proportion of G2/M cells measured after a 9-hour incubation with medium alone or 50 μM DBBF-Hb and GOX (2 or 10 mU/mL) in the presence or absence of 100 U/mL catalase. Each value represents the mean ± SE of 3 to 6 independent experiments. (C) PS externalization measured after 18 hours for the same treatments as in panel B. Each value represents the mean ± SE of 3 to 6 independent experiments. *P < .05 versus medium alone; +P < .05 versus 2 mU/mL GOX.
Figure 8B shows the accumulation of cells in the G2/M phase after a 9-hour incubation with DBBF-Hb and 2 or 10 mU/mL of GOX in the presence and absence of catalase. With 2 mU/mL GOX, catalase provided near complete inhibition of growth arrest. This inhibition corresponded with the absence of morphologic alterations and with the inhibition of DBBF-Hb oxidation shown in Figure 8A. With 10 mU/mL GOX, catalase inhibited the accumulation of G2/M cells, but to a lesser degree. Again, this is explained by the fact that catalase was less effective at inhibiting the redox cycling of DBBF-Hb in the presence of 10 mU/mL GOX (Figure 8A). We also found that catalase inhibited PS externalization in a pattern similar to that noted for cell cycle arrest. After an 18-hour incubation, the increase in the number of early apoptotic cells induced by DBBF-Hb and 2 mU/mL GOX was completely inhibited by catalase, whereas catalase provided less protection with 10 mU/mL GOX (Figure 8C). These results clearly suggest a close link between the redox cycling of DBBF-Hb and the onset and extent of cell cycle arrest and apoptosis.
Role of the caspase inhibition in cell cycle arrest and apoptosis
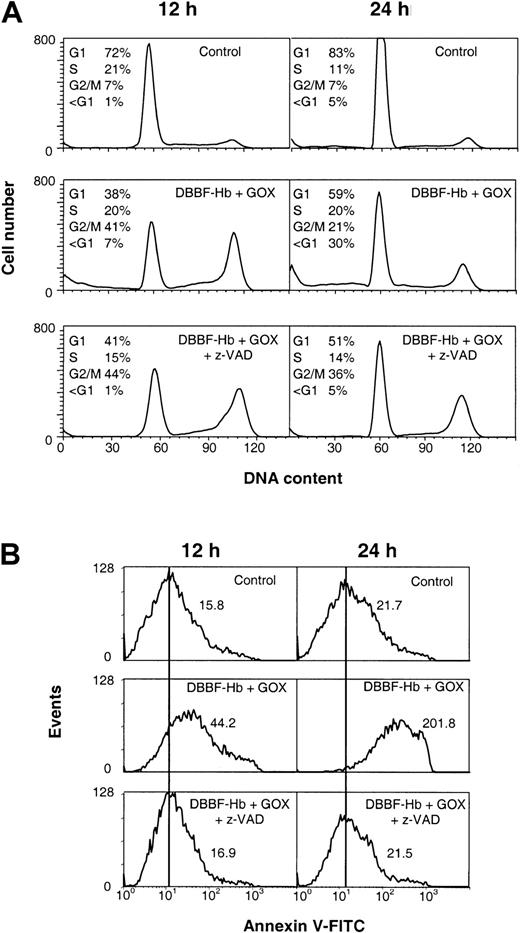
Caspases are a group of cysteine proteases involved in the execution of apoptosis.43 Experiments were performed with z-VAD-fmk, a broad-range caspase inhibitor, to further confirm the relation between cell cycle arrest and apoptosis in this system. Figure9 shows the effects of z-VAD-fmk on the cell cycle and PS externalization after 12- and 24-hour treatment with DBBF-Hb and 10 mU/mL GOX. Figure 9A shows that z-VAD-fmk did not prevent the accumulation of G2/M cells induced by DBBF-Hb and GOX at 12 or 24 hours. In fact, the fraction of G2/M cells at 24 hours was greater in the presence of z-VAD-fmk (36%) than in the presence of DBBF-Hb/GOX alone (21%), suggesting that z-VAD-fmk blocked growth-arrested cells from proceeding to apoptosis. Furthermore, z-VAD-fmk inhibited the accumulation of sub-G1 events at both time intervals, in contrast to DBBF-Hb and GOX alone. Moreover, z-VAD-fmk completely prevented the increase PS externalization at 12 and 24 hours (Figure 9B). These results support a sequence of events whereby the induction of G2/M arrest is followed by apoptotic death of growth-arrested cells.
Caspase inhibitor, z-VAD-fmk, does not suppress G2/M arrest but inhibits PS externalization.
BSO-pretreated cells were analyzed 12 and 24 hours after incubation with medium alone (control) or DBBF-Hb (50 μM) and GOX (10 mU/mL) with and without pretreatment with z-VAD-fmk. (A) DNA content histograms with calculated fractions of G1, S, and G2/M from a representative experiment are shown. The fraction of sub-G1 was calculated as a percentage of total gated events. (B) Typical histograms of annexin V staining of the PI-negative cell population (R1 + R2). Mean fluorescence of the gated cell population is shown for each panel.
Discussion
We have established a causative role for the redox cycling of DBBF-Hb in the inhibition of endothelial proliferation in the G2/M phase of the cell cycle, which is followed by apoptosis of arrested cells. We also found that cellular thiols (eg, GSH) play a significant role in modulating the extent of cell cycle arrest and apoptosis. These findings provide new insight into the mechanisms of hemoprotein-induced endothelial cell damage and may explain some of the microvascular effects of hemoglobin-based oxygen carriers.1,7,30 They may also be factors in the etiology of cerebral hemorrhage, myocardial injury, rhabdomyolysis, hemodialysis injury, crush syndrome, and air blast exposure.1-7 17-19
The bolus addition of high micromolar concentrations of H2O2 can induce apoptosis or necrosis in variety of cell types.34,44 Previously, we showed that apoptosis induced by bolus H2O2 was reduced in the presence of DBBF-Hb.34 The reaction of DBBF-HbFe2+ with bolus H2O2, which generates its ferryl form and rapidly autoreduces to DBBF-HbFe3+, does not lead to cell cycle arrest (F.D., unpublished data, August 2000). Therefore, in our previous studies, the bolus addition of oxidants did not sustain the redox cycling of ferryl–ferric hemoglobin and limited our ability to study the true cellular effects of hemoglobin redox reactions.
In the current study, GOX generates steady fluxes of H2O2, which may better mimic the physiological setting.35-37 In vivo, H2O2 is continuously produced and remains in a quasi-steady state.36 The steady state H2O2concentration in human plasma has been reported to be 10 to 100 nM, whereas some have reported levels as high as 5 to 35 μM.45 Two intravascular sources of H2O2 include NADPH oxidase of neutrophils and monocytes and circulating or membrane-bound xanthine oxidase of endothelial cells.21 45
The GOX system drives the redox cycling of DBBF-Hb and induces G2/M cell cycle arrest. The rate of DBBF-Hb oxidation correlated with GOX concentration, which in turn correlated with the onset time of G2/M arrest. The fact that growth arrest was induced after the addition of GOX to DBBF-HbFe3+, and not to DBBF-HbFe3+CN, further supports the causative role of the ferric–ferryl redox cycle. Although the underlying mechanism(s) are still unknown, the fact that extracellular catalase inhibits cell cycle arrest and the loss of thiols strongly suggests the involvement of an initial extracellular oxidative event that triggers the subsequent cellular responses.
Oxidative stress can induce a wide array of cellular responses ranging from growth stimulation, temporary arrest and adaptation, permanent arrest, apoptosis, and necrosis depending on its strength or duration.44 Cells can actively delay their proliferation after sensing DNA damage and can activate repair pathways that efficiently restore DNA integrity before division is resumed (ie, cell cycle checkpoints).46,47 Permanent growth arrest and apoptosis can occur after extensive DNA damage.44,46,47Our data, therefore, suggest that the redox cycling of DBBF-Hb may induce some form of direct or indirect DNA damage. Oxidants such as hydroxyl radical can induce significant DNA damage that includes single- and double-stranded DNA breaks, base and sugar modifications, and DNA–protein cross-links.44,46 Because of the high oxidant concentration needed to release heme or iron from hemoglobin,20 it is unlikely that the extracellular generation of hydroxyl radical mediated by free heme or iron plays a significant role in this system. The high reactivity of hydroxyl radical also implies that for damage to be induced, hydroxyl radical must be formed in proximity to DNA. However, the possibility remains that intracellular oxidative stress plays a role in the induction of cell cycle arrest.
The loss of reduced thiols induced by the redox cycling of DBBF-Hb may be the result of increased S-glutathiolation or S-thiolation of intracellular proteins. The role of S-glutathiolation in the regulation of stress signaling pathways has recently been reviewed.48Oxidative stress induces the formation of protein-mixed disulfides through the reaction of GSH and other thiols with cysteine residues. Because disulfide formation is reversible, critical cysteines may be protected from irreversible oxidation and loss of function.48,49 The combination of hemoprotein and peroxides is a more effective inducer of mixed-disulfide formation compared to H2O2 alone.49Alternatively, the loss of GSH may be the result of aggravated peroxidative stress induced by hemoprotein-mediated lipid peroxidation processes or the efflux of GSH from stressed cells.13,50In a model of glycerol-induced rhabdomyolysis, a condition characterized by massive muscle destruction and myoglobin release, the levels of GSH were decreased in rat kidneys within 6 hours of glycerol injection.51 Interestingly, it was recently shown that increased lipid peroxidation with the concurrent production of prostaglandin F2-isoprostanes occurs in animals with glycerol-induced rhabdomyolysis and in patients with rhabdomyolysis.17 52 These effects were linked to the redox cycling of myoglobin in kidneys driven by low levels of ROOH or H2O2 and not to free heme or iron-mediated events.
The increased susceptibility of GSH-depleted endothelial cells to G2/M arrest and apoptosis induced by DBBF-Hb redox cycling suggests that a GSH-dependent process may protect or help cells adapt to or recover from this stress. Clinically, this implies that patients with compromised vasculatures and poor antioxidant status (eg, diabetes, hypertension, myocardial infarction, acute ischemic stroke, and hemorrhagic shock) may be more susceptible to the adverse effects of hemoglobin-based oxygen carriers, as may be suggested in the clinical trials of DCLHb.27 29
Recently, it was reported that DCLHb induced necrotic lesions in animal hearts.28 These lesions were localized to highly vascularized regions of the heart and were observed 24 to 48 hours after infusion. Interestingly, we have observed that the redox cycling of DBBF-Hb also induced G2/M arrest and apoptosis in human coronary artery endothelial cells (F.D., unpublished data, August 2000). Although heme-mediated vascular injury and dysfunction have been ongoing concerns with the use of hemoglobin-based oxygen carriers, traditional measures of cytotoxicity (eg, LDH or liver enzyme tests) have mainly suggested mild toxicities.53 54 In this regard, it may be important to consider that G2/M-arrested cells maintain plasma membrane integrity and that arrested cells that become apoptotic would be cleared by phagocytes in vivo, minimizing the leakage of intracellular contents. Thus, the occurrence of G2/M arrest and apoptosis in vivo may elude some of the more traditional measures of cytotoxicity.
The increasing recognition that hemoglobin redox chemistry may limit the safety or efficacy of first-generation hemoglobin-based therapies has prompted the design of new strategies aimed at reducing the reactivity of hemoglobin with oxidants, limiting its binding of NO, or both. These modifications include alterations of the heme pocket to reduce NO reactivity and coadministration of antioxidants or antiferryl compounds to control heme-mediated side reactions.7 9
Acknowledgments
The opinions and assertions contained herein are the scientific views of the authors and are not to be construed as policy of the United States Food and Drug Administration.
F.D. is a recipient of a Fogarty International Fellowship from the National Institutes of Health.
The publication costs of this article were defrayed in part by page charge payment. Therefore, and solely to indicate this fact, this article is hereby marked “advertisement” in accordance with 18 U.S.C. section 1734.
References
Author notes
Abdu I. Alayash, Center for Biologics Evaluation and Research, Food and Drug Administration, Bldg 29, Rm 112, 8800 Rockville Pike, Bethesda, MD 20892; e-mail: alayash@cber.fda.gov.

This feature is available to Subscribers Only
Sign In or Create an Account Close Modal