

Abstract
Effective presentation of tumor antigens is fundamental to strategies aimed at enrolling the immune system in eradication of residual disease after conventional treatments. Myeloid malignancies provide a unique opportunity to derive dendritic cells (DCs), functioning antigen-presenting cells, from the malignant cells themselves. These may then co-express leukemic antigens together with appropriate secondary signals and be used to generate a specific, antileukemic immune response. In this study, blasts from 40 patients with acute myeloid leukemia (AML) were cultured with combinations of granulocyte-macrophage colony-stimulating factor, interleukin 4, and tumor necrosis factor α, and development to DCs was assessed. After culture, cells from 24 samples exhibited morphological and immunophenotypic features of DCs, including expression of major histocompatibility complex class II, CD1a, CD83, and CD86, and were potent stimulators in an allogeneic mixed lymphocyte reaction (MLR). Stimulation of autologous T-cell responses was assessed by the proliferative response of autologous T cells to the leukemic DCs and by demonstration of the induction of specific, autologous, antileukemic cytotoxicity. Of 17 samples, 11 were effective stimulators in the autologous MLR, and low, but consistent, autologous, antileukemic cytotoxicity was induced in 8 of 11 cases (mean, 27%; range, 17%-37%). This study indicates that cells with enhanced antigen-presenting ability can be generated from AML blasts, that these cells can effectively prime autologous cytotoxic T cells in vitro, and that they may be used as potential vaccines in the immunotherapy of AML.
Introduction
The major cause of treatment failure in acute myeloid leukemia (AML) is relapse of the disease. Relapse rates are considerably lower in patients who undergo allogeneic bone marrow transplantation (BMT). This is attributed to a graft-versus-leukemia effect mediated by the donor-derived immune system, principally T cells.1 This effect is now being harnessed in allogeneic transplantation by means of nonmyeloablative conditioning regimens, where the conditioning and the establishment of donor-recipient chimerism have the role principally of enabling immunotherapy against leukemic cells by infused donor lymphocyte populations.2As cure rates in AML approach plateau, studies of in vivo and ex vivo immune modulation are also being extended to the setting of autologous BMT and to patients not eligible for high-dose therapies.3Immune manipulations in the treatment of leukemia are not new. In the 1970s, pooled, irradiated allogeneic leukemic cells were given to patients with AML in first remission or after relapse and led to increased duration of remission in one study.4 Interleukin (IL) 2, which can augment immune activity through release of secondary cytokines such as interferon-γ, has also been used as an immune modulator in patients with AML after conventional treatment.2,3 Donor lymphocyte infusions (DLIs) following allogeneic BMT are now the mainstay of treatment for early relapse of chronic myeloid leukemia,5,6 but are considerably less successful in the treatment of relapse of AML. This may be because the exponential increase in malignant cells in relapsing AML outstrips any clinical response to DLI, or because AML blasts are poor antigen-presenting cells (APCs) and fail to induce a sustained antileukemic response.2 Additionally, the AML blasts themselves have been shown to inhibit T-cell proliferation and cytokine production through secretion of soluble factors.7Certainly, in order to induce immunity rather than tolerance, the APCs on which tumor antigens are presented are critical. Immunosurveillance directed against tumor antigens by host T cells may not always prevent the development of a primary malignancy, but some of these antigens may, nevertheless, subsequently function as tumor-rejection antigens if presented appropriately on APCs with the necessary costimulatory signals.
Dendritic cells (DCs) are the most potent APCs in the immune system and the only ones capable of sensitising naive, unprimed T cells.8,9 Importantly, they express high levels of major histocompatibility complex (MHC) class I and class II together with the additional secondary signals necessary to promote T-cell activation in the form of costimulatory molecules and cytokines. Thus, DCs are central to the initiation of primary, specific immune responses and are therefore important potential vectors for the induction of anticancer immunity.10 DCs are derived from a common myeloid/monocytic/DC precursor11 and can be cultured from CD34+ progenitors in the presence of granulocyte-macrophage colony- stimulating factor (GM-CSF) and tumor necrosis factor α (TNF-α),12 or from peripheral blood (PB) monocytes in the presence of GM-CSF, IL-4, and TNF-α.13-15 There are recent data suggesting that DCs can also be derived from more committed myeloid precursors and that reversal of the granulocyte maturation pathway can also yield candidate DCs in the presence of GM-CSF, IL-4, and TNF-α.16Myeloid malignancies therefore provide a unique opportunity to derive APCs from the malignant cells themselves, which may then combine expression of leukemic antigens with the presence of the necessary costimulatory signals and be used to generate a specific antileukemic immune response. DCs have been generated from AML blasts in vitro,17-20 but published data on the ability of these “leukemic DCs” to generate autologous cytotoxic T-cell responses is sparse.17 19
In this study, several combinations of GM-CSF, IL-4, and TNF-α were used in suspension cultures of AML blasts to generate leukemic DCs from a wide range of AML French-American-British (FAB) types. Morphological, immunophenotypic, and functional parameters were used to assess DC production and possible differences in DC potential, and the optimal cytokine conditions for different AML FAB types were studied. We investigated the ability of the generated leukemic DCs to stimulate proliferative and cytotoxic responses by autologous T cells; these data were used as markers of effective antigen presentation and cytotoxic T lymphocyte (CTL) generation by leukemic DCs.
Patients, materials, and methods
Patient samples
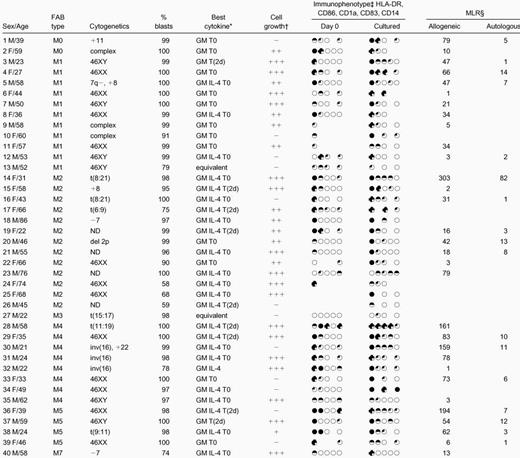
PB and bone marrow (BM) samples were from 40 patients with AML at presentation or relapse. Samples were taken with informed consent at the time of diagnostic tests. To obtain homogeneous blast populations, mononuclear cells (MNCs) from consecutive samples with high percentages of blasts were isolated by centrifugation of whole PB or BM over a Ficoll-Paque density gradient (Amersham Pharmacia Biotech, Little Chalfont, Buckinghamshire, United Kingdom). Cells were used immediately or cryopreserved in 90% fetal calf serum (FCS) (Applied Protein Products, West Midlands, United Kingdom), 10% dimethyl sulfoxide (Sigma Aldrich, Poole, United Kingdom). Patient details are given in Table 1.
Patient characteristics and culture data
 |
|
FAB indicates French-American-British; MLR, mixed lymphocyte reaction; GM, granulocyte-macrophage colony stimulating factor; IL, interleukin.
Cytokine combination giving best combination of morphological, phenotypic, and functional maturation for each sample. T0 = tumor necrosis factor α [TNF-α] from day 0, T(2d) = TNF-α added for the last 2 days of culture. Equivalent indicates no cytokine combination better than any other.
− Mature cell density < 0.25 × 10⁶ cells/mL; + mature cells 0.25-0.50 × 10⁶/mL; ++ mature cells 0.50-0.75 × 10⁶/mL; +++ mature cells > 0.75 × 10⁶/mL. (Initial blast cell density = 1 × 10⁶/mL).
Circles represent expression of HLA-DR, CD86, CD1a, CD83, and CD14, in that order, at the beginning and end of culture, after subtraction of controls, on the following: ○ <10%; 10%-25%; ◐ 26%-50%;51%-75%; ● >75% of cells.
Numbers represent fold greater proliferation of responders in presence of allogeneic or autologous stimulators than in presence of controls (responder to stimulator = 4:1).
Generation of leukemic DCs from AML blasts
Cryopreserved MNCs were thawed and washed in serum-free medium; fresh and cryopreserved cells were suspended at 1 × 10⁶ cells per milliliter in McCoys 5A medium (Life Technologies, Paisley, Scotland) supplemented with 10% to 15% heat-inactivated serum or plasma and cultured in 12-well plates (Falcon, Oxford, United Kingdom) with various combinations of cytokines. The majority of samples were cultured in 10% human blood group AB serum, and in initial experiments, this was compared with 15% FCS or 10% autologous plasma (with 20 U/mL preservative-free heparin [CP Pharmaceuticals, Wrexham, United Kingdom]). GM-CSF (Schering-Plough, Kenilworth, NJ) was used at 100 ng/mL, IL-4 (Sigma Aldrich) at 20 ng/mL, and TNF-α (Sigma) at 10 ng/mL. Samples were cultured for 7 to 14 days with GM-CSF, with or without IL-4 and with or without TNF-α. TNF-α was added at day 0 or 2 days before the end of the culture period. Samples were also cultured without cytokines and with each cytokine alone. All cultures, mixed lymphocyte reactions (MLRs), and cytotoxicity assays were maintained at 37°C in 5% CO2 and a humidified atmosphere. Cultured cells were observed by phase-contrast microscopy for evidence of increasing size and formation of clusters. At the end of culture, cell count was measured on an automated cell counter (Sysmex, Milton Keynes, United Kingdom). Cytocentrifuge preparations of unmanipulated and cultured blasts were stained with Giemsa. Review of these cytospin preparations allowed assessment of viability and maturation. Cells that had increased in size, acquired copious gray cytoplasm without cytoplasmic granules or vacuoles, and developed long cytoplasmic processes were defined as mature leukemic DCs morphologically (Figure1).

Cultured leukemic DCs.
These are from patient 38 and demonstrate increase in size, copious gray cytoplasm, and development of cytoplasmic processes (Giemsa staining, × 50).
Cultured leukemic DCs.
These are from patient 38 and demonstrate increase in size, copious gray cytoplasm, and development of cytoplasmic processes (Giemsa staining, × 50).
Immunophenotype of fresh and cultured AML blasts
Unmanipulated and cultured AML samples were stained with fluorescein isothiocyanate (FITC)–, phycoerythrin-, and peridinin chlorophyll protein (PerCP)–conjugated mouse monoclonal antibodies (mAbs) against CD1a, CD14, CD86 (Pharmingen, Oxford, United Kingdom), HLA-DR (Becton Dickinson, Oxford, United Kingdom), and CD83 (Coulter, Luton, United Kingdom), or with appropriate isotype-matched control mAbs. Cells were incubated with mAb for 30 minutes at 4°C, washed once in phosphate buffered saline (PBS), and resuspended in a small volume of PBS for analysis by means of a FACScan flow cytometer (Becton Dickinson) with CellQuest version 3.1 acquisition and analysis software (Becton Dickinson). Forward- and side-scatter gates were established to exclude cell debris and clumps prior to analysis for expression of each phenotypic marker.
Fluorescence in situ hybridization
To determine the leukemic origin of the DCs generated in culture, cells from patients with leukemias that exhibited trisomy 8 on diagnostic cytogenetic testing were examined by means of fluorescence in situ hybridization (FISH) before and after culture. Cells were treated with colcemid for 2 hours and then fixed in 3:1 methanol to acetic acid. Chromosome 8 was identified in both metaphase and interphase cells by means of an alpha satellite probe for chromosome 8 labeled with Texas red.
Allogeneic and autologous MLRs
Responder cells for the allogeneic MLRs were MNCs obtained by density centrifugation of PB from normal volunteers. Responder cells for the autologous MLRs were MNCs obtained by separation of thawed PB progenitor cell (PBPC) collections or fresh PB taken from patients in continuing morphological remission. Responders were plated at 1 × 10⁵ per well in McCoys 5A medium with 10% AB serum in 96-well U-bottomed plates (Falcon). Leukemic DCs were used as stimulator cells after being irradiated (30 Gy). Stimulators were added to responder cells, in triplicate wells, in a total volume of 200 μL. Stimulator-to-responder combinations were plated at as many possible different ratios (1:1024,1:256,1:64,1:16,1:4,1:1) as numbers of cultured cells allowed. Controls were uncultured AML blasts, blasts cultured in the absence of cytokines, and, for the autologous MLRs, allogeneic MNCs or leukemic DCs. All controls were irradiated. Lymphocyte proliferation was measured by means of3H-thymidine (ICN, Oxfordshire, United Kingdom) incorporation (37 kBq per well). 3H-thymidine was added for the last 18 hours of a 5-day culture. Proliferative responses more than 4-fold greater than controls were considered positive for both allogeneic and autologous MLRs. As a nonspecific measure of T-cell proliferation potential, some wells contained responders alone stimulated with phytohemagglutinin (PHA) 1%. The proliferative potentials of normal and remission T cells were assessed by comparison of the responses with PHA stimulation. Flow cytometric analysis using an FITC-conjugated mAb against CD3 (Becton Dickinson) was used to measure percentages of T cells in MNCs from normal PB and PBPC collections.
Stimulation of T cells from AML patients by autologous DCs
Autologous responder cells derived from thawed PBPC collections or fresh PB were suspended at 1 × 10⁶ cells per milliliter in McCoys 5A medium supplemented with 10% AB serum and IL-2 (Becton Dickinson), 20 U/mL. Washed, irradiated, autologous leukemic DCs derived from DC cultures with the optimum cytokine combination for each sample were added at responder-to-stimulator ratios of between 5:1 and 10:1. Further IL-2 was added every 3 to 4 days, and cultures were refed with media at day 7. Controls were (1) responder cells cultured with IL-2 but not primed with leukemic DCs and (2) normal allogeneic responders primed with leukemic DCs (positive control). Cytotoxicity assays were performed on day 14.
Cytotoxicity assays
Cytotoxicity assays were performed with lactate dehydrogenase (LDH)–release and flow cytometric methods. In the majority of cases, the LDH-release assay was associated with high background release of LDH by effectors and targets, which made identification of specific cytotoxicity very difficult. The data presented here, therefore, are those obtained from assays with the Live/Dead Cell Mediated Cytotoxicity Kit (Molecular Probes, Cambridge, United Kingdom), used in accordance with the manufacturer's recommendations. This assay has been validated against 51Cr-release assays for targeted, T-cell–mediated cellular cytotoxicity.21 22 Briefly, targets were autologous presentation or relapse AML blasts that were thawed, washed, and resuspended overnight in 50% FCS and 50% McCoys 5A medium. Prior to use, targets were centrifuged over a Ficoll-Paque density gradient to remove debris and dead cells. Targets were stained with 3,3′-dioctadecyloxacarbocyanine (DiOC18), a green fluorescent membrane dye (emission maximum 501 nm, visualized in the FL1 channel by flow cytometry) that is permanently incorporated into cell membranes, for 20 minutes in the dark at 37°C and then washed twice in Phenol Red free RPMI medium (Life Technologies) containing 5% FCS. Day-14 stimulated T-cell populations (“effectors”) were also centrifuged over a Ficoll-Paque density gradient and washed. We added 104 to 5 × 10⁵ effectors to polystyrene tubes (Falcon) with 104 stained targets (effector-to-target ratios, 1:1 to 50:1) and propidium iodide (3.75 mM solution, 1:500 final dilution) in a constant volume of medium. Propidium iodide is a nuclear dye that is excluded by intact plasma membranes, has an emission maximum of 617 nm, and is therefore visualized in the FL2 channel by flow cytometry. The tubes were gently centrifuged in order to bring targets and responders into close contact and were then incubated for 18 hours in the dark. At the end of this period, tubes were gently vortexed, and the samples were analyzed by flow cytometry. In a 2-parameter cytogram of logFL1 versus logFL2, dead targets, unable to exclude propidium iodide, stain both green and red and appear in the upper right quadrant. Live targets stain green only and appear in the lower right quadrant.
Statistical analyses
Results were analyzed by means of standard equations for the mean, SD, Student paired and unpaired t tests, and correlation coefficients.
Results
Cultures
The mean percentage of blasts in the initial populations was 93% ± 12% (mean ± SD); percentage viability was 99% ± 2%. After 7 to 14 days' culture, cell counts varied widely; overall, total density of viable cells at the end of culture was 1.19 ± 0.73 × 10⁶ cells per milliliter (initial cell density was 1 × 10⁶ cells per milliliter). For 25 of 40 samples, total cell numbers at the end of culture with at least one cytokine combination had increased, whereas total counts at the end of culture were fewer than 50% of initial cell numbers in 11 cases and fewer than 25% in 5 of these. In 29 cases, mature cell numbers exceeded 25% of the starting cell number; in 17 of these, they exceeded 50% (Figure 1). For each sample, numbers of mature cells after culture are given in Table 1. The effects of differences in length of culture, sera, source of cultured cells (fresh or cryopreserved), FAB type, and cytokine combination on total cell numbers and numbers of DCs are listed in Table2. Because the trend is that cultures longer than 9 days yield fewer cells and fewer mature cells than shorter cultures (Table 2), the majority of samples in this study were cultured for 7 to 8 days. Overall, the timing of the addition of TNF-α did not consistently affect development of leukemic DCs, although the results indicated that the “best” cytokine combinations for maturation of leukemic DCs differed between samples. The cytokine combinations that best combined evidence of morphological maturation with phenotypic and functional evidence of maturation for each sample are given in Table 1, and the leukemic DCs generated in these combinations were used in subsequent cytotoxicity assays.
Effect of varying culture conditions on growth and maturation of dendritic cells derived from acute myeloid leukemia blasts
| Comparison | No. experiments | Density of viable cells at end of culture (×106/mL) | Density of mature cells* at end of culture (×106/mL) | ||
|---|---|---|---|---|---|
| Mean ± SD | P value (Student t test) | Mean ± SD | P value (Student t test) | ||
| Length of culture | |||||
| ≤9 days | 33 | 1.23 ± 0.71 | P = .59 | 0.66 ± 0.41 | P = .14 |
| >9 days | 7 | 1.05 ± 0.79 | 0.45 ± 0.30 | ||
| Sera | |||||
| FCS versus AB/autologous | 4 | ||||
| FCS | 1.54 ± 1.53 | P = .37† | 0.45 ± 0.31 | P = .71† | |
| AB/autologous | 0.91 ± 0.44 | 0.37 ± 0.24 | |||
| AB versus autologous | 4 | ||||
| AB | 1.22 ± 0.40 | P = .24† | 0.52 ± 0.23 | P = .42† | |
| Autologous | 0.90 ± 0.52 | 0.39 ± 0.26 | |||
| Fresh/thawed samples‡ | |||||
| Fresh | 6 | 1.28 ± 0.32 | P = .10 | 0.75 ± 0.21 | P = .13 |
| Cryopreserved | 20 | 0.94 ± 0.68 | 0.54 ± 0.42 | ||
| FAB type | |||||
| M0/M1/M2 | 26 | 1.30 ± 0.74 | P = .17 | 0.66 ± 0.44 | P = .66 |
| M4/M5 | 12 | 0.96 ± 0.61 | 0.59 ± 0.46 | ||
| Cytokine combinations | |||||
| GM-CSF ± TNF-α | 38 | ||||
| with IL-4 | 0.80 ± 0.60 | P = .29 | 0.42 ± 0.38 | P = .35 | |
| without IL-4 | 0.89 ± 0.64 | 0.37 ± 0.36 | |||
| GM-CSF ± IL-4 | 40 | ||||
| with TNF-α d0/last 2d | 0.86 ± 0.64 | P = .50 | 0.43 ± 0.39 | P < .01 | |
| without TNF-α | 0.80 ± 0.55 | 0.29 ± 0.25 | |||
| GM-CSF ± IL-4 | 39 | ||||
| with TNF-α d0 | 0.88 ± 0.68 | P = .70 | 0.48 ± 0.43 | P = .10 | |
| with TNF-α last 2d | 0.84 ± 0.60 | 0.38 ± 0.34 | |||
| FAB types M4/M5 only | |||||
| GM-CSF, TNF-α d0 | 12 | 0.69 ± 0.56 | P = .08 | 0.32 ± 0.31 | P < .05 |
| GM-CSF, IL4, TNF-α d0 | 12 | 0.91 ± 0.55 | 0.52 ± 0.42 | ||
All cell-density numbers are cell densities after culture; initial blast cell density = 1 × 10⁶cells/mL.
FCS indicates fetal calf serum; FAB, French-American-British; AB, blood group AB serum; TNF, tumor necrosis factor; GM-CSF, granulocyte-macrophage colony stimulating factor; IL, interleukin.
Mature cells are cells defined as mature leukemic dendritic cells morphologically.
As multiple data were available for these experiments, they were analyzed by a repeated-measures analysis of variance (SPSS, statistical software package).
Only samples cultured for 7 to 8 days in AB serum were compared.
Fluorescence in situ hybridization
In our series of patients, only one showed a high number of trisomy-8–positive blasts in presentation or relapse material. FISH analysis performed on this patient (patient 5) demonstrated 79% of cells carrying trisomy 8 at day 0 and 55% after 9 days of culture (Figure 2).

FISH showing trisomy 8 in cultured cells from patient 5.
For this patient, 79% of cells carried trisomy 8 before culture; 55% carried trisomy 8 after culture.
FISH showing trisomy 8 in cultured cells from patient 5.
For this patient, 79% of cells carried trisomy 8 before culture; 55% carried trisomy 8 after culture.
Immunophenotype
The immunophenotype of the cultured blasts was compared with that of fresh, uncultured blasts or blasts cultured in the absence of cytokines (Figure 3, Table 1). Samples that combined high-level expression of MHC class II after culture and expression of at least one of CD86, CD1a, and CD83 with very low-level expression of CD14 (on fewer than 10% of cells) were defined as leukemic DCs immunophenotypically. At the end of the culture period, cells from 13 cases combined expression of MHC class II with expression of one other DC marker; cells from 15 cases expressed MHC class II and at least 2 other phenotypic markers of DCs. None of these expressed CD14 at the end of culture. Among these 28 cases, for blasts cultured with the cytokine combination shown in Table 1 in each case, 71% ± 21% of cells were positive for MHC class II; 24 cases expressed CD86 on 32% ± 16% of cells; 17 cases expressed CD1a on 28% ± 19% of cells; and 9 (of 10 tested) expressed CD83 on 24% ± 14% of cells. After culture, expression of CD14 was low overall and was further reduced in the presence of IL-4 (P < .00001). This difference was also significant for FAB types M4 and M5 considered alone; initial expression of CD14 on cells from M4/M5 AMLs was 24% ± 27%; expression of CD14 after culture in the absence of IL-4 was 16% ± 23% and, in the presence of IL-4, 12% ± 24% (P < .01). This is in addition to significantly greater morphological maturation of cells from M4/M5 AMLs in GM-CSF, IL-4, and TNF-α than in GM-CSF and TNF-α alone (Table 2).

Immunophenotype of cultured and uncultured AML blasts.
Filled and unfilled histograms indicate expression of the labeled mAb and of an appropriate isotype control. Numbers indicate percentage of positive cells after subtraction of controls (mean fluorescence intensity of positive cells). (A) The immunophenotype of day-0 and day-7 cells from patient 3 (cultured with GM-CSF with TNF-α added for the last 2 days). (B) The immunophenotype of day-0 and day-7 cells from patient 14 (cultured with GM-CSF, IL-4, and TNF-α all from day 0).
The percentages of expression of each of the phenotypic markers of DCs studied (MHC class II, CD86, CD1a, and CD83) were individually correlated with functional data from allogeneic and autologous MLRs and cytotoxicity assays.
Functional tests: MLRs
All allogeneic and autologous MLRs were performed at several stimulator-to-responder ratios; complete data from 2 experiments are illustrated in Figures 4 and5. Cultured cells that stimulated3H-thymidine uptake by normal allogeneic responders more than 4-fold the 3H-thymidine uptake in response to controls (unmanipulated AML blasts or blasts cultured without cytokines, each from the same patient as the cultured cells) at stimulator-to-responder ratios of 1:4 were defined as leukemic DCs functionally. Cultured cells from 31 samples were tested as stimulators in an allogeneic MLR in this study. Cells from 25 samples induced proliferation of normal, allogeneic T cells at least 4-fold greater than responses to controls (mean, 62-fold; range, 4-193) (Table 1). For 6 of the 31 samples tested, proliferative responses of normal allogeneic cells to stimulation by cultured cells were up to 4-fold greater than response to controls (mean, 2-fold; range, 1-3) and were therefore considered negative.

Allogeneic MLR.
Leukemic blasts from patient 36 cultured with various combinations of cytokines and tested as stimulators in an allogeneic MLR. Responders were normal PB MNCs. G = GM-CSF, I = IL-4, T = TNF-α, 0 = day 0, 5 = day 5 of culture. Data points plus error bars indicate mean ± SD for each ratio tested for each cytokine combination.

Autologous MLR.
Leukemic blasts from patient 29 cultured with various cytokine combinations and tested as stimulators in an autologous MLR. Responders in this experiment were autologous PBPC MNCs. Data points plus error bars indicate mean ± SD for each ratio.
Autologous MLR.
Leukemic blasts from patient 29 cultured with various cytokine combinations and tested as stimulators in an autologous MLR. Responders in this experiment were autologous PBPC MNCs. Data points plus error bars indicate mean ± SD for each ratio.
Remission material as a source of autologous responder cells for the autologous MLR and for cytotoxicity assays was available for 17 patients. Cultured leukemic DCs from 11 patients induced proliferation of these autologous responders more than 4-fold greater than response to controls (mean, 16-fold; range, 5-82), suggesting that the cultured cells were successfully presenting antigens. For the 6 other samples, proliferative responses of autologous cells to the leukemic DCs were up to 4-fold greater than responses to controls (mean, 2-fold; range less than 1-3).
Proliferative responses in the autologous MLRs, measured by3H-thymidine uptake, were much lower than those in the allogeneic MLRs. Although this difference may simply reflect differences in the numbers of T cells responding to foreign MHC molecules versus specific foreign epitopes in association with self-MHC,8 we also investigated differences between the responders for the allogeneic and the autologous MLRs. In this study, the majority of autologous responders were derived from cryopreserved material, the only source of autologous T cells in many patients who had subsequently relapsed, died, or undergone BMT. PHA responses of fresh MNCs from normal volunteers were 62 188 ± 25 008 (mean ± SD) cpm after 5 days; responses of thawed cells from AML patients were 28 450 ± 17 441 cpm; P = .002. However, there was no significant difference between PHA responses of fresh and thawed normal responders (data not shown); thus, this difference was not directly attributable to cryopreservation alone. The percentage of CD3+ cells in 12 normal PB samples and 15 remission PBPC samples was therefore measured by flow cytometry. No significant differences were found (percentage of CD3+ in normal PB versus AML PBPCs: 63% ± 8% versus 59% ± 17%;P = .51).
Functional tests: cytotoxicity assays
Figure 6 shows antileukemic cytotoxicity of T cells primed with leukemic DCs and IL-2 compared with those primed with IL-2 alone. Data are shown for an effector-to-target ratio of 50:1 in each case; induction of specific antileukemic cytotoxicity was defined as cytotoxicity by T cells primed with leukemic DCs greater than 1.5-fold that of T cells primed with IL-2 alone. Figure 7 shows data for patient 31 in more detail. The mean percentage of cytotoxicity for the positive experiments was 27% (range, 17%-37%). This assay was also associated with frequent problems with high spontaneous target death, which appeared to be partly due to the staining procedure and which prevented assessment of specific antileukemic cytotoxicity in 6 cases in which autologous T-cell/blast pairs were available.

Cytotoxicity of unprimed and primed effectors against unmanipulated autologous AML blasts.
Primed effectors were autologous T cells cultured with leukemic DCs and IL-2 for 14 days. Unprimed effectors were autologous T cells cultured with IL-2 only. Results represent cytotoxicity against autologous blast cells at an effector-to-target ratio of 50:1. Experiments in which primed effectors produced more than 1.5-fold greater killing of autologous blast cells than unprimed effectors were considered positive. indicates unprimed; ▩, primed.

Cytotoxicity assay, patient 33.
Cytotoxicity of primed and unprimed effectors against autologous blasts; data given for all experimental ratios. ⋄ indicates unprimed; ♦, primed.
Cytotoxicity assay, patient 33.
Cytotoxicity of primed and unprimed effectors against autologous blasts; data given for all experimental ratios. ⋄ indicates unprimed; ♦, primed.
When expression of phenotypic markers was correlated with activity in allogeneic MLRs, P values < .05 were found for the following: MHC class II, r = 0.40, P < .05; CD86, r = 0.57, P < .002; CD83, r = 0.72,P < .01. Expression of CD1a was not significantly correlated with functional activity; r = 0.27, P > .1. However, functional activity in autologous MLRs or in cytotoxicity assays was not significantly correlated with expression of each phenotypic marker; P > .05 for each comparison. Proliferative responses in allogeneic and autologous MLRs were well correlated for the 17 samples for which paired data were available, r = 0.80, P < .001. No significant relationships between functional activities in allogeneic or autologous MLRs and in cytotoxicity assays were detected.
Discussion
In this study, cells possessing the morphological, phenotypic, and allostimulatory properties of DCs have been generated from MNC populations from PB or BM of 24 of 40 patients with AML at presentation or relapse. In addition, stimulation of proliferative responses of autologous T cells was demonstrated in 11 of 17 cases, and induction of autologous antileukemic cytotoxicity in 8 of 11.
AML encompasses a biologically heterogeneous group of clonal disorders of myeloid precursors. To maximize the potential for development of DCs from the leukemic blasts, several cytokine combinations were investigated in this study. GM-CSF is a cytokine to which myeloid DCs are universally responsive, as are myeloid and macrophage progenitors. IL-4 suppresses macrophage and monocyte development from myelomonocytic precursors.23 The addition of TNF-α to DC cultures from normal PB MNCs halts antigen capture and leads to up-regulation of MHC and accessory molecules and T-cell stimulatory capacity.15,24 We have investigated development of DCs from primitive (M0/M1), maturing (M2), and myelomonocytic (M4/M5) leukemias. However, in 16 of 40 samples there was no evidence of generation of leukemic DCs; either the blasts did not survive in culture,5 there was no morphological or immunophenotypic evidence of maturation,6 or allostimulatory capacity was poor3 or not investigated because of an insufficient number of cells after culture.2 The wide variations in our ability to generate leukemic DCs from different samples persisted across FAB types. It was not possible to postulate any characteristic of an AML predictive of generation of cells with evidence of antigen-presenting capability from our data, in part owing to the relatively small numbers of samples studied in each subgroup.
The leukemic origin of the DCs generated is supported by data from the FISH analysis, indicating survival of cells carrying trisomy 8. In other cases, the leukemic origin of cultured cells was not proven formally.
In 19 of the 24 samples producing leukemic DCs, the cytokine combination that gave greatest evidence of morphological maturation to DCs also gave highest expression of relevant DC markers and greatest allostimulatory capacity. We went on to use these combinations to generate leukemic DCs for stimulation of autologous T-cell effectors for cytotoxicity assays.
In the allogeneic MLR, functional DCs are dramatically better stimulator cells than other APCs, such as monocytes or B cells,25 and should stimulate significant proliferation of allogeneic T cells at low DC–to–T-cell ratios. Leukemic DCs generated from the majority of samples in this study were effective stimulators in the allogeneic MLRs. Proliferative responses in the autologous MLRs indicated presentation of “foreign” antigens to autologous T cells by leukemic DCs. That these antigens represent extraneous proteins introduced during the experiment, or self-, nonleukemic antigens, cannot be formally excluded. However, stimulatory capacities in allogeneic and autologous MLRs were closely correlated (P < .001), and allostimulatory capacity was correlated with expression of 3 specific DC markers: MHC class II, CD86, and CD83 (P < .05 for each comparison).
It is not always possible to predict the clinical efficacy of an immunotherapeutic strategy from data generated from the in vitro assessment of the function of experimentally primed T cells. In particular, data from cytotoxicity assays are difficult to interpret and often poorly reproducible. These experiments are heavily reliant on the initial viability of thawed targets. In our experience, LDH-release and chromium-release assays have particular problems with high background release, which swamps experimentally induced cell death. Nonetheless, despite practical difficulties, we have demonstrated low but consistent stimulation of autologous killing of leukemic blasts by cytotoxic T cells through priming with leukemic DCs in 8 of 11 cases (mean cytotoxicity, 27%; range, 17%-37%), using a flow cytometric cytotoxicity assay. Other groups have demonstrated higher levels of specific cytotoxicity in fewer patients.17 19 However, our T cells did not undergo polyclonal stimulation with anti-CD3, and our targets were unmanipulated. In addition, positive and reliable cytotoxicity data do not exclude escape from cytotoxicity of the leukemic stem cell; an in vivo cytotoxic response to these cells would be fundamental to the eradication of minimal residual disease through immunotherapy. Here, data from autologous T-cell–proliferation assays have been used to support cytotoxicity data, and together these indicate that stimulation with autologous DCs derived from AML blasts can generate antileukemic T-cell responses. Useful future studies will include assays of inhibition of leukemic colony formation and, ultimately, clinical trials.
We have attempted to harness the power of professional APCs to take up, process, and present antigens to potential CTLs through the generation of functional DCs co-expressing leukemic antigens and costimulatory signals. This is of importance in targeting immunotherapeutic strategies in AML, where the biological heterogeneity of the disease means that specific tumor antigens, for example, products of translocations, can be used to generate CTL clones in only a fraction of individuals. In contrast, in tumors such as melanoma, single antigenic determinants have been used to prime CTL responses that are applicable to all patients.26
Cultured DCs derived from normal cells may present a whole range of antigens if primed with whole, apoptotic, or lysed tumor cells and can select the antigens most relevantly presented in association with their own MHC molecules. Immunization with multiple, unselected epitopes is possible. However, myeloid malignancies offer an additional benefit: the opportunity to generate potential DCs from the malignant cells themselves. The theoretical advantages of this strategy include the lack of an antigen-priming step requiring synchronization with the appropriate early stage of DC development, when antigen uptake is occurring.8-10,15 In addition, if pulsing DCs with an unselected range of epitopes derived from dead and dying cells, including self-antigens such as nuclear proteins, DNA, or RNA, is avoided, the theoretical possibility of inducing autoimmunity is presumably reduced. Finally, DCs are thought to principally package endogenous (eg, viral) antigens in association with MHC class I molecules and exogenous antigens in association with MHC class II molecules.7 27 Leukemic DCs may therefore be better able to directly prime cytotoxic T cells than DCs derived from normal precursors and primed with exogenous leukemic antigens.
In conclusion, our study confirms and extends evidence of the potential for induction of antigen-presenting function on AML blasts through culture with appropriate cytokines in a larger group of patients encompassing a wide range of FAB types. Furthermore, we show evidence of induction of specific, autologous T-cell stimulatory capacity through data from both proliferative and cytotoxicity assays. We believe that these data support the feasibility of using cultured AML blasts to present antigens to autologous T cells and their possible use in clinical trials.
J.A.A. is the Robert Whiteson Memorial Trust Fellow.
The publication costs of this article were defrayed in part by page charge payment. Therefore, and solely to indicate this fact, this article is hereby marked “advertisement” in accordance with 18 U.S.C. section 1734.

This feature is available to Subscribers Only
Sign In or Create an Account Close Modal