The dehydration of sickle red blood cells (RBCs) through the Ca-activated K channel depends on the parallel movement of Cl ions. To study whether Cl-conductance block might prevent dehydration of sickle RBCs, a novel Cl-conductance inhibitor (NS3623) was characterized in vitro using RBCs from healthy donors and sickle cell patients and in vivo using normal mice and a transgenic mouse model of sickle cell disease (SAD mice). In vitro, NS3623 reversibly blocked human RBC Cl-conductance (gCl) with an IC50 value of 210 nmol/L and a maximal block of 95%. In vivo, NS3623 inhibited RBC gCl after oral administration to normal mice (ED50 = 25 mg/kg). Although gCl, at a single dose of 100 mg/kg, was still 70% inhibited 5 hours after dosing, the inhibition disappeared after 24 hours. Repeated administration of 100 mg/kg twice a day for 10 days caused no adverse effects; therefore, this regimen was chosen as the highest dosing for the SAD mice. SAD mice were treated for 3 weeks with 2 daily administrations of 10, 35, and 100 mg/kg NS3623, respectively. The hematocrit increased, and the mean corpuscular hemoglobin concentration decreased in all groups with a concomitant increase in the intracellular cation content. A loss of the densest red cell population was observed in conjunction with a shift from a high proportion of sickled to well-hydrated discoid erythrocytes, with some echinocytes present at the highest dosage. These data indicate feasibility for the potential use of Cl-conductance blockers to treat human sickle cell disease.
Introduction
Red blood cell (RBC) dehydration is a key event in the pathogenesis of sickle cell disease (SS) because the rate of sickle hemoglobin (HbS) polymerization is a high-power function of the HbS concentration.1 The sickling process of normally hydrated cells is readily reversible on reoxygenation, but dehydrated cells form irreversibly sickled RBCs, which are highly susceptible to trapping in the postcapillary venules and are associated with microvascular obstructions.2-4 Two transport pathways have been identified as direct mediators of the dehydration of sickle cells—the Ca++-activated K-channel, known as the Gardós channel, and the KCl cotransporter.5,6 Activation of the Gardós channel by deoxygenation–sickling-induced Ca++-influx leads to K+ efflux, membrane hyperpolarization, and concomitant loss of anions through the conductive anion pathway and, thereby, to dehydration of the cells. It has been proposed that the changed anion gradient causes intracellular acidification through the Jacobs-Stuart cycle, which may activate the KCl cotransporter and further accelerate the dehydration process.7 8
Pharmacologic prevention of in vivo sickle cell dehydration has focused on blocking the Gardós channel with imidazole antimycotics such as clotrimazole, which ameliorates RBC dehydration both in a transgenic sickle cell mouse model (SAD mouse) and in patients.9,10 No clinically useful blockers of the KCl cotransporter exist, but dietary Mg2+ supplementation has been shown to inhibit KCl cotransport and to reduce dehydration in SAD mice and in patients.11-14
The role of the Cl conductance–exchange system in sickle cell dehydration had never been tested in vivo. Inhibition of the K+-efflux through activated Gardós channels by gCl blockers is well-established in vitro, and theoretically this mechanism may be as effective as blocking the K+-channel.15,16 It has been shown that in vitro loss of K+ from deoxygenated SS cells could be limited by application of the reversible anion conductance inhibitor, NS1652.17 This compound showed a high degree of RBC Cl-conductance inhibition in normal mice and had no toxic effects at high doses. However, the half-life in the plasma was too short (30 minutes) for the compound to be useful in vivo.
In this report we have used NS3623, a more long-lived member of the same class of compounds as NS1652, to investigate the long-term in vivo effects of RBC Cl-inhibition in normal mice and the transgenic SAD mouse.
Materials and methods
Drugs and chemicals
Valinomycin, CCCP (carbonylcyanide m-chlorophenylhydrazone), NaCl, KCl, ouabain, bumetanide, and Triton-X-100 (TX-100) were purchased from Sigma Chemical (St Louis, MO). NS3623 was synthesized at NeuroSearch (Copenhagen, Denmark).18 MgCl2, dimethyl sulfoxide, and n-butyl phthalate were purchased from Fisher Scientific (Springfield, NJ). Choline chloride was purchased from Calbiochem-Boehring (San Diego, CA). Bovine serum albumin, fraction V, was from Boehringer Mannheim (Mannheim, Germany). All inorganic salts were of analytical grade or higher. All solutions were prepared using double-distilled water. For in vitro studies all organic compounds were dissolved in dimethyl sulfoxide as stock solutions. We used either 5% Cremophore (pig-40–hydrogenated castor oil, CAS no. 61788/85/0) obtained from Basis Kemi A/S (Copenhagen, Denmark) or a mixture of Tween 20 (0.1%) and propylene glycol (1.9%) in water as vehicles for the in vivo studies.
Determination of RBC membrane potential
The CCCP method was used for determination of the membrane potential.19 RBCs were suspended (hematocrit 1.6% or 3.1%) in an unbuffered salt solution (154 mM NaCl and 2 mM KCl), and the membrane potential changes were reflected by a CCCP (20 μM)-mediated pH shift of the buffer-free extracellular phase, whereas the highly buffered intracellular pH remained constant. The membrane potential was calculated as Vm = 61.5 × (pHin − pHout), (mV) and membrane potential read-outs were taken as peak hyperpolarizations. The chloride conductance was calculated from the Huxley-Hodgkin formalism.17
Oxygen equilibrium curves, MADH, and met-hemoglobin
Oxygen saturation curves of RBC suspensions were determined with a Hemox Analyzer (TCS Scientific, New Hope, PA) in Hemox buffer, pH 7.4 at 37°C.20 The level of membrane-associated denatured hemoglobin (MADH) was determined by measuring the heme in the washed ghost fraction of hemolyzed erythrocytes.21 The presence of met-hemoglobin was measured spectrophotometrically at 630 nm.
In vitro receptor screening
The specificity of NS3623 was tested in standard binding assays for the following receptors: non-selective glutamate; strychnine-sensitive glycine; histamine H1; histamine H3; insulin; leukotriene B4; muscarinic M1; muscarinic M2; muscarinic M3; muscarinic M4; neuropeptide Y2; nicotinic acetylcholine central; opiate δ; opiate κ; opiate μ; phorbol ester; progesterone; purinergic P2X; purinergic P2Y; serotonin 5-HT1; serotonin 5-HT1A; serotonin 5-HT2; Sigma ς; Sigma nonselective; sodium channel, site 2; tachykinin NK1; testosterone; thromboxane A2; vascular endothelial growth factor; vasoactive intestinal peptide; nitric oxide synthase; phosphodiesterase PDE5; protease, calpain; protein kinase PKCα; protein kinase PKCβ; tyrosin kinase EGF receptor; protein kinase ERK1 serine/threonine kinase; calcineurin PP2B phosphatase; adenosine A1; adenosine A2A; adrenergic α1; adrenergic α2; adrenergic β1; adrenergic β2; angiotensin AT1; bradykinin B2; L-type Ca-channel; dopamine D1; dopamine D2L; dopamine D2 + 4; endothelin ETA; endothelin ETB; estrogen ERα; GABA A agonist site; GABA A chloride channel; galanin; glucocorticoid; glutamate kainate; glutamate NMDA agonist; glutamate NMDA phencyclidine. The assays were performed at PanLabs, Taiwan.
In vivo experiments
NS3623 was dissolved in Cremophore or a Tween 20–propylene glycol mixture at concentrations of 5 to 25 mg/mL. The results were not affected by the kind of vehicle used. For intravenous (IV) administration approximately 250 μL suspension (5 mg/mL) was injected slowly (30-60 seconds) into the tail vein. Oral (PO) administrations were made by gavage directly into the stomach.
Animals and experimental design
Animals.
Wistar rats (males) were obtained from Møllegård (Ejby, Denmark). NMRI mice (females) were obtained from Bomholtgård (Gl. Ry, Denmark).
Cl-conductance block.
Mice were killed at varied times after NS3623 administration. The collected blood was introduced into heparinized vials, and the RBCs were immediately packed by centrifugation and stored on ice until use. Before the measurement of membrane potentials, the cells were washed once in 1 vol ice-cold, buffer-free salt solution and quickly transferred to a prewarmed (37°C) experimental solution containing CCCP (final hematocrit, 3.1%) followed by the addition of valinomycin.17
Mouse model for sickle cell disease.
Transgenic Hbbsingle/single SAD1 (SAD) females and males between 3 and 6 months of age and weighing 25 to 30 g were used for this study.22,23 The SAD mice were divided into 3 groups dosed twice a day per os (PO) with NS3623 (potassium salt) in the following strengths: group 1 at 10 mg/kg, group 2 at 35 mg/kg, and group 3 at 100 mg/kg. After the establishment of control values, hematologic parameters were evaluated in the different mouse groups after 11 and 21 days of therapy. Blood sampling and vehicle administration has been shown not to affect the blood parameters measured in this study.24
Hematologic data and cation content
Two hundred microliters blood was drawn at specific time intervals from each ether-anesthetized mouse by retro-orbital venipuncture into heparinized microhematocrit tubes. It was used for Rb+ influx measurements, determination of RBC phthalate density distribution curves, cell morphology studies, determination of RBC cation content, and other hematologic parameters. The Hb concentration was determined by the spectroscopic measurement of the cyanmet derivative. The hematocrit was determined by centrifugation in a microhematocrit centrifuge. Cells were washed 3 times with PBS (330 mOsm). Density distribution curves and median RBC densities (D50) were obtained according to Danon and Marikovsky using phthalate esters in microhematocrit tubes6 23-25
Measurements of Ca++ activated Rb+influx in SAD mouse red cells
Whole blood (hematocrit range, 42.9%-51.3%; see Table1 for details) was incubated for 30 minutes at room temperature in the presence of 1 mM ouabain, 10 μM bumetanide, and 20 mM Tris-Mops, pH 7.4 (final concentrations in plasma obtained with appropriate dilution of concentrated stock solutions). The ionophore A23187 was added under stirring at 22°C to the mouse blood to a final concentration of 80 μM. After 6 minutes of incubation, RbCl was added to the cell suspension (time = 0) to a final concentration of 10 mM and incubated at 37°C. Aliquots were obtained after 0, 2, 3, and 5 minutes and transferred to 2 mL medium containing 150 mM NaCl and 15 mM EGTA, pH 7.4, at 4°C and washed 3 times at 4°C with the same solution, followed by lysis in 1.5 mL 0.02% Acationox. After centrifugation of the lysate for 10 minutes at 3000g, the Rb+ content was measured in the supernatant by atomic absorption spectrophotometry. The Rb+influx was calculated from Rb+ concentration in the supernatant at 2 and 5 minutes.9,12 13
Treatment of SAD mice with varied doses of NS3623: effects on hematocrit, MCHC, intracellular cation concentrations, and Gardós channel activity
| Dosing groups (mg/kg) . | Hematocrit (%) . | MCHC (g/dL) . | Na+ (mmol/kg Hb) . | K+ (mmol/kg Hb) . | Gardós channel (mmol/L cell/min) . | ||||||||||
|---|---|---|---|---|---|---|---|---|---|---|---|---|---|---|---|
| 10 . | 35 . | 100 . | 10 . | 35 . | 100 . | 10 . | 35 . | 100 . | 10 . | 35 . | 100 . | 10 . | 35 . | 100 . | |
| No. mice . | n = 5 . | n = 7 . | n = 6 . | n = 5 . | n = 7 . | n = 6 . | n = 5 . | n = 7 . | n = 6 . | n = 5 . | n = 7 . | n = 6 . | n = 5 . | n = 7 . | n = 6 . |
| Pretreatment | 44.2 ± 2.2 | 42.9 ± 3.8 | 44.3 ± 1.3 | 31.6 ± 1.3 | 34.3 ± 2.8 | 33.0 ± 1.0 | 36.4 ± 5.6 | 41.6 ± 3.0 | 35.7 ± 5.6 | 374.0 ± 11.1 | 382.7 ± 11.9 | 404.0 ± 66 | 12.8 ± 1.1 | 12.2 ± 1.9 | 10.0 ± 1.5 |
| 11-day treatment | 47.0 ± 1.0† | 46.3 ± 5.1 | 44.9 ± 2.8 | 29.3 ± 1.9* | 29.2 ± 4.4‡ | 32.3 ± 2.6 | 44.8 ± 7.2* | 49.0 ± 4.2‡ | 66.6 ± 18.8‡ | 399.6 ± 8.2‡ | 418.9 ± 12.0‡ | 438.0 ± 46 | 12.4 ± 2.6 | 10.1 ± 2.2‡ | 9.2 ± 1.1 |
| 21-day treatment | 49.2 ± 1.3‡ | 47.1 ± 2.6† | 51.3 ± 3.8‡ | 29.0 ± 1.4† | 28.1 ± 2.6‡ | 29.9 ± 1.7‡ | 45.8 ± 4.2† | 54.4 ± 7.7‡ | 54.9 ± 8.8‡ | 402.4 ± 7.5‡ | 418.8 ± 12.0‡ | 451.0 ± 35 | 13.5 ± 0.9 | 9.1 ± 2.7‡ | 4.5 ± 1.5‡ |
Numbers are means ± SD.
.10 > P > .05;
.05 > P> .01;
.01 > P.
Results
Human erythrocyte Cl-conductance block in vitro
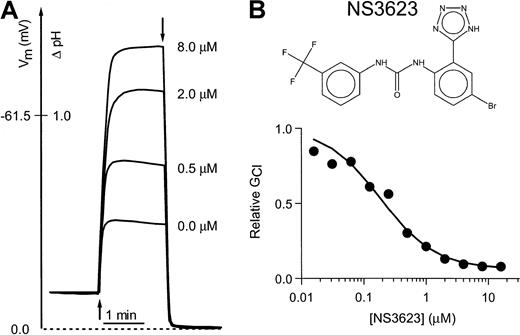
Figure 1 shows the chemical structure of NS3623 and typical recordings of valinomycin-induced hyperpolarizations in a suspension of normal human RBCs incubated with varied concentrations of NS3623 (Figure 1B). A control hyperpolarization to −32 mV was obtained. Increasing concentrations of NS3623 resulted in enhanced hyperpolarizations in response to the constant K+-conductance induced by valinomycin, indicating an increasing degree of Cl-conductance block. The membrane potential approached the theoretical K+-equilibrium potential in the limit of a high concentration of NS3623. The normalized conductance for chloride is plotted as a function of the NS3623 concentration in Figure1A. The solid curve represents the best fit to a Hill-type equation yielding a blocker affinity of 210 nM and an NS3623-insensitive fraction of the Cl-conductance of 5%. In comparison, the prototype compound in this chemical series, NS1652, blocked the Cl-conductance with an IC50 value of 620 nM and a similar insensitive fraction.17 As for NS1652, the action of NS3623 was reversible and blocked SO42−–Cl−exchange in parallel with the Cl-conductance, indicating strong interaction with the band 3 protein. No effects were found on the NEM-induced KCl cotransport or the Ca++-activated K+-conductance activated by the Ca++-ionophore A23187 (results not shown).
Inhibition of the human RBC Cl-conductance by NS3623.
(A) CCCP-mediated pH changes and the corresponding RBC membrane potentials (ordinate axis) recorded on incubation of human RBCs with a valinomycin concentration of 50 nM (addition at first arrow) and increasing concentrations of NS3623 (0, 0.5, 2.0, and 8.0 μM). Experiments were terminated by the addition of TX-100 (second arrow) to determine the intracellular pH, which corresponds to a membrane potential of 0 mV. Hematocrit, 1.6%, 37°C. (B) Chemical structure of NS3623 and normalized Cl-conductances versus the concentration of NS3623. The curve represents the best fit to a Hill-type equation.
In vitro effects on human SS cells
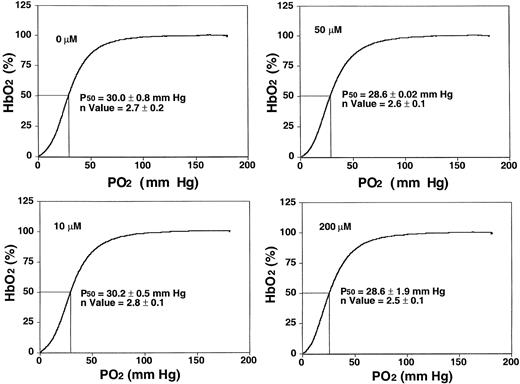
NS3623 blocked the gCl of human SS cells with the same potency and efficacy as for normal RBCs (results not shown). To test for adverse in vitro effects of NS3623, basic functional sickle RBC parameters were evaluated at higher concentrations (10-200 μM) than needed for maximal Cl-conductance block. Figure2 shows oxygen saturation curves and P50 values from standard oxygen binding studies with suspensions of sickle RBCs exposed to varied concentrations of NS3623. Normal sigmoid O2-binding curves were obtained at all concentrations (unchanged Hill coefficients). Slightly lower mean P50 values were found at concentrations greater than 50 μM, but the statistical significance is questionable. NS3623 caused no hemolysis of sickle cells. A dose-dependent change in RBC morphology favoring the echinocyte rather than the discoid form was observed in accordance with NS3623 being an anionic compound.26 In the same range of concentrations (24-hour incubation), NS3623 did not influence the amount of membrane-associated denatured hemoglobin in sickle cell ghosts, and it did not induce the formation of met-hemoglobin (data not shown).
Sickle RBC oxygen equilibrium curves in the presence of NS3623.
Human SS cells were incubated with NS3623 (0, 10, 50, and 200 μM). HbS-hemoglobin oxygen saturation (percentage, ordinate axis) was measured in intact cells as a function of oxygen partial pressure (abscissa axis). Hill coefficients and oxygen half-saturation mean pressures ± SDs (n = 4) are indicated on the individual curves.
In vivo effects of NS3623 on normal mouse RBCs
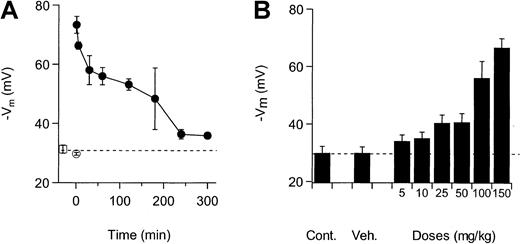
NS3623 blocked the Cl-conductance of mice RBCs in vitro with the same potency as the Cl-conductance of human RBCs (results not shown). To establish the functional properties of the compound in vivo, NS3623 was given to normal mice by IV and PO administration. Figure3A shows the valinomycin-induced hyperpo-larizations from mouse RBCs isolated at various times after IV injection of NS3623 (50 mg/kg). Membrane potentials of RBCs from uninjected animals were −31 mV, which did not significantly differ from the response of the RBCs from vehicle-injected animals (−30 mV). NS3623 injection increased the valinomycin-induced hyperpolarization to −73 mV in blood cells obtained 1 minute after injection, indicating an instantaneous high degree of in vivo Cl-conductance block. The hyperpolarizations induced at increasing time intervals after injections gradually returned to the control level, reflecting the declining plasma concentration of NS3623. To test the efficacy of the block after PO administration, NS3623 was given in single doses from 10 to 150 mg/kg. Figure 3B shows the valinomycin-induced RBC hyperpolarizations obtained 1 hour after administration and plotted against the doses of NS3623. An ED50-value of 25 mg/kg for the Cl-conductance block was calculated.
Inhibition of RBC Cl-conductance after IV and PO administration of NS3623 to normal mice.
Animals were killed and bled at various times after dosing, and the packed blood cells were transferred to buffer-free salt solutions containing CCCP for recording of valinomycin-induced hyperpolarizations. Each point is a mean of measurements on RBCs from 3 mice. Error bars represent SD. (A) Time dependence of the Cl-conductance block after IV administration (at t = 0) of NS3623 (50 mg/kg). (■) indicates uninjected; (○), vehicle-injected (t = 1 minute); and (●), NS3623-injected. (B) Dose-dependence (5-150 mg/kg) of the Cl-conductance block recorded 1 hour after PO administration of NS3623. The dashed line shows the hyperpolarization at normal chloride conductance (mean of control hyperpolarizations).
Evaluation of toxicology of NS3623 in normal mice and rats
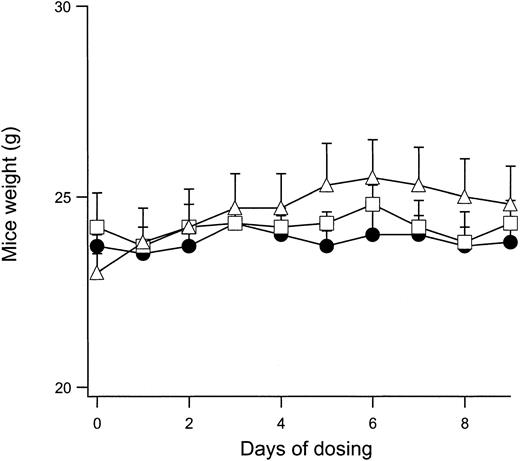
Because in vivo modulation of the normal mouse RBC Cl conductance is feasible with IV and PO administration of NS3623, it was important to show that mice can tolerate daily administrations of the compound without significant adverse effects. A sensitive index of general toxicology is the feeding behavior of the animal during compound administration. Figure 4 shows the change in body weight of normal mice given PO doses with 2 × 100 mg/kg per day for 9 days. The weight curves for vehicle-dosed animals are shown for comparison. No significant differences were observed between the groups. After the dosing period, all animals were killed. The erythrocyte gCl-block measured on days 1 and 9 were identical, indicating that NS3623 did not accumulate in the organism during the treatment. No signs of macroscopic organ damage were observed. In a separate series of experiments, normal mice were dosed in the range of 25 to 300 mg/kg (PO, single administrations), and plasma samples were analyzed for possible increased activity of the liver enzymes alanine aminotransferase, aspartate aminotransferase, alkaline phosphatase, and γ-glutamyl transferase and for increased creatinine and bilirubin levels. No effects on these toxicology markers were observed. However, a slight increase in the total bilirubin level was found after repeated administration to rats of doses above 100 mg/kg per day. Additionally, NS3623 was tested for acute cardiovascular side effects in rats. Blood pressure and heart rate were unaffected by IV and PO administrations of up to 100 mg/kg. In broad-scale in vitro screening, NS3623 exhibited no potency (IC50 ≥ 10 μM) in the 60 different receptor binding assays listed in “Materials and methods.”
Weight development of mice dosed with NS3623.
Curves show the daily weight of normal mice dosed orally with NS3623 (2 × 100 mg/kg per day) for 10 days. Mice dosed with vehicle (Cremophore) (●), NS3623 as free acid (■), or as potassium salt (▵). Each point represents the mean ± SD (6 animals per group).
Evaluation of dose administration in normal mice
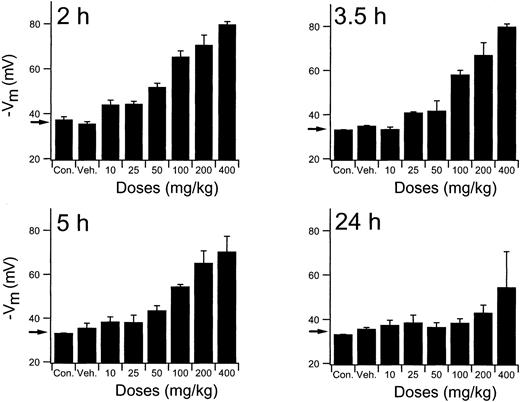
To establish the relevant dosing regimen for the efficacy studies, an extensive exploration of the RBC Cl-conductance dependency of times and doses was performed using normal mice. Results of the complete study are presented graphically in Figure5. Mice received single PO doses of NS3623 in the 10- to 400-mg/kg range and were killed at various times (2-24 hours) to obtain a comprehensive picture of the time dependence of the RBC Cl-conductance block. The valinomycin-induced RBC hyperpolarizations at the lower doses of NS3623 started to decline 3.5 hours after administration. At 5 hours the drug-enhanced hyperpolarizations were still highly significant, with doses greater than 50 mg/kg, whereas at 24 hours only the mice given the 400-mg/kg dose retained a slight block. At the highest doses, approximately 90% block of the chloride conductance was found ex vivo. A comparison of this value with the in vitro dose-response curve indicates a corresponding in vivo free concentration of NS3623 in the 10- to 20-μM range. In support of the pharmacodynamics shown in Figures 3 and 5, traditional pharmacokinetic measurements in rats were performed. After IV injection NS3623 distributed in a volume of 0.29 L/kg, and the elimination from plasma followed first-order kinetics with a half-life of 2.1 hours. The PO bioavailability of NS3623 was approximately 10%.
In vivo persistence of NS3623 induced gCl-block.
Inhibition of erythrocyte Cl-conductance by NS3623 at varied doses (10-400 mg/kg) and times (2-24 hours), as indicated on the individual curves, after PO administration of NS3623 to normal mice. Protocol as in Figure 3. Con, control mice; Veh, Cremophore. Individual columns represent hyperpolarizations of RBCs from 3 mice, mean ± SD. Arrows show the hyperpolarization at normal chloride conductance (mean of control hyperpolarizations).
Effect of NS3623 treatment on RBCs in a mouse model for sickle cell disease (SAD mice)
Based on the in vivo Cl-conductance blocking and toxicology studies, we carried out experiments using the SAD mouse, a model for sickle cell disease. The SAD mice were treated for 3 weeks with NS3623 in 2 daily PO administrations of 10, 35, and 100 mg/kg per day, respectively. The purpose was to compare the effect of a high-level Cl-conductance block throughout the treatment period (the highest dose) with a lower level of blockage (intermediate and lowest doses). Different hematologic parameters were evaluated at baseline, at day 11, and at day 21 of dosing. No changes in body weight were observed during the treatment period.
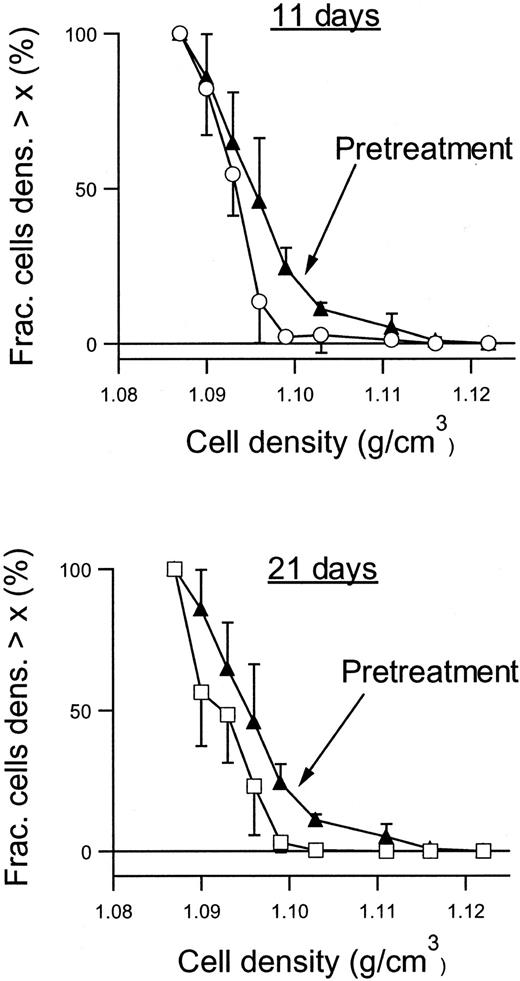
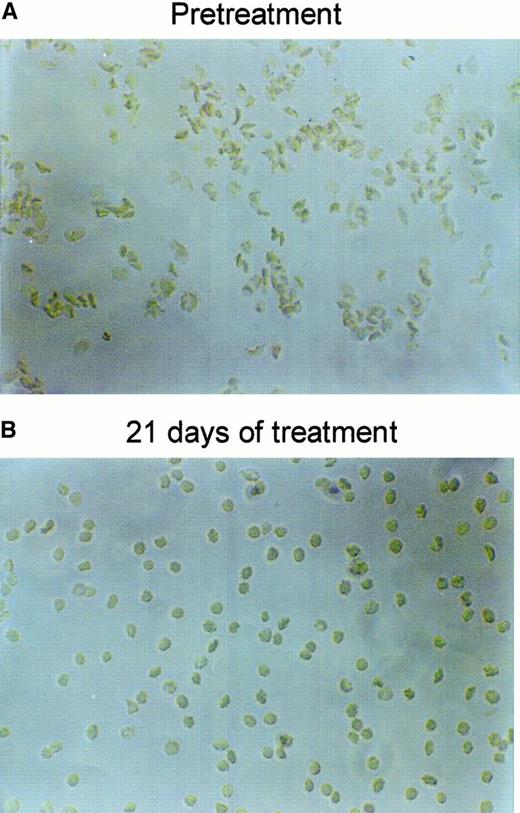
Figure 6 shows the RBC density profiles obtained before, after 11 days, and after 21 days of dosing with 2 × 100 mg/kg per day. At baseline, the SAD RBCs had a large proportion of dehydrated, dense RBCs, quantified as the fraction with densities above 1.1 g/cm3. After 11 days of treatment with NS3623, this fraction had essentially disappeared, and after 21 days the entire density profile was left-shifted. Table 1 shows the detailed changes in the hematologic parameters, intracellular Na+, and K+, and the Gardós channel-mediated Rb+ influx. The concentrations of total intracellular cations increased dose dependently during the treatment period. In all dosing groups, the hematocrit increased significantly with a concomitant decrease in mean cell hemoglobin concentration (MCHC), a swelling quantitatively accounted for by the assumption of isosmotic gain in intracellular cations. Rb+ influx was found to decrease gradually in the 35- and 100-mg/kg per day groups, whereas no effect was observed in the 10-mg/kg per day group. As shown in Figure7, 21 days of NS3623 administration resulted in a change in general erythrocyte morphology from predominantly sickled forms to a high proportion of well-hydrated, nonsickled forms. In accordance with the in vitro studies, echinocytes were present in the high-dose group, whereas discocytes clearly prevailed at the lower doses (results not shown). Withdrawal of NS3623 treatment for 1 month resulted in a reversion of the hematologic picture, demonstrating the reversibility of the therapy. These data indicate that NS3623 treatment improves the hydration status of the SAD erythrocyte (Figure 6, Table 1) and RBC morphology (Figure 7).
Density profiles of RBCs from NS3623-treated SAD mice.
Density profiles were obtained before (▴), after 11 days (○), and after 21 days (■) of PO administration of NS3623 (2 × 100 mg/kg per day). Curves are based on individual measurements from 6 mice. Error bars represent ±SD.
Density profiles of RBCs from NS3623-treated SAD mice.
Density profiles were obtained before (▴), after 11 days (○), and after 21 days (■) of PO administration of NS3623 (2 × 100 mg/kg per day). Curves are based on individual measurements from 6 mice. Error bars represent ±SD.
Changes in SAD mouse RBC morphology by NS3623.
Representative pictures of RBCs drawn from a SAD mouse and fixed in formalin, before (A) and after (B) 3 weeks of PO treatment with NS3623 (2 × 100 mg/kg per day).
Changes in SAD mouse RBC morphology by NS3623.
Representative pictures of RBCs drawn from a SAD mouse and fixed in formalin, before (A) and after (B) 3 weeks of PO treatment with NS3623 (2 × 100 mg/kg per day).
Discussion
We have investigated the effect of NS3623, a potent and reversible blocker of RBC Cl-conductance, on normal mice and a transgenic mouse model of sickle cell disease. In vitro effects obtained on human RBCs correspond to previous results from NS1652, with NS3623 showing a higher affinity for blocking Cl-conductance.17 For normal mice, an in vivo gCl block was obtainable after both IV and PO dosing of the compound, and the block persisted significantly longer than it had with NS1652. For single PO administrations, the ED50 dose for conductance inhibition was 25 mg/kg. The duration of the Cl-conductance block depended strongly on the dose. At 100 mg/kg the Cl-conductance was still 70% blocked after 5 hours, but it was normal after 24 hours. NS3623 showed little toxicity, and mice could be dosed orally with 2 × 100 mg/kg per day for 3 weeks without adverse effects.
Increased in vivo persistence, PO availability, and low toxicity enabled an in vivo gCl block to be maintained for prolonged periods and thus for the compound to be tested in the mouse sickle cell model, SAD. SAD mice were treated for 3 weeks with 2 daily administrations of NS3623 at doses of 10, 35, and 100 mg/kg, respectively. Significant reductions in the fraction of dehydrated, dense sickle cells were observed at all doses. Evidence of echinocytosis was observed only in the 100-mg/kg per day group, with discoid forms prevailing at the 10 and 35 mg/kg per day groups. RBC hydration was also markedly improved, as judged from increased hematocrit, decreased MCHC, and increased concentrations of erythrocyte Na+ and K+ content. The dense fraction of RBCs (D > 1.1 g/cm3) had disappeared after 11 days of treatment with 2 × 100 mg/kg per day, and the entire density distribution curve was left-shifted by the end of the treatment. Selective early loss of the densest cell fraction might have indicated immediate cessation of the recruitment of new cells to this population, which was then quickly removed by the normal sequestration and degradation mechanisms. Whether general left-shifting of the density distribution on continued treatment indicated gradual swelling of the less dehydrated, intermediate dense cell populations or population renewal remains to be established. Whatever the mechanism, block of the Cl-conductance affects both severely and moderately dehydrated RBCs.
Both the Ca++-activated K+ channel and the KCl cotransporter seem to be critically involved in the formation of the dense population of sickle RBCs. Their interrelation, however, is still unclear. It has been suggested that activation of the Gardós channel is the primary mechanism for the dehydration of mature erythrocytes. The cotransporter may represent an acid-induced amplification mechanism secondary to activation of the Gardós channel, which may explain the “fast-track” pathway directly from reticulocytes to irreversibly sickled cells.7,8 Apovo et al27 also found evidence for a sequential activation of the channel and the cotransporter under oxygenation–deoxygenation cycles. However, other studies have pointed out that the cotransporter and the channel may drive dehydration in parallel, resulting in intermediate and hyperdense fractions of sickle cells.28Using fast oxygenation–deoxygenation cycles, McGoron et al29 found evidence of Ca++-dependent dehydration of immature and mature RBCs.
Because K+ loss by the activation of the Gardós channel is electrogenic, it depends on a concomitant transport of anions through the conductive anion pathway; therefore, it is possible to prevent salt loss and dehydration by inhibition of the Cl-conductance.15,30 However, the efficacy of this mechanism depends strongly on the kinetics and the degree of activation of the Gardós channel. At high K+-channel, open-state probability, the Cl-conductance becomes rate limiting for salt loss, and gCl block is more effective than a corresponding block of the K-channel. At a very low degree of K-channel activation, Cl-conductance blockers can be expected to be less effective than K-channel blockers. However, a theoretical analysis has shown 2 conditions. First, provided the individual K-channel openings are long enough to recharge the erythrocyte membrane capacitance, Cl-blockers may still be effective. Second, in the limit of frequent, very short openings of the K-channel giving the same open-state probability as in the first condition, block of Cl-conductance has no influence on salt loss.16,17 Although no direct experimental evidence about the degree and kinetics of the in vivo sickle cell Gárdos channel activation exists, in vitro experiments conducted by Lew et al31 demonstrated that human SS RBCs exposed to deoxygenation pulses responded with the induction of a Ca++permeability stochastically distributed in the RBC population and with the near maximal activation of the Gardós channel in the affected cells. On resuspension of this fraction in isothiocyanate Ringer solutions, the red cells dehydrated rapidly in a Ca++-dependent manner, clearly indicating a relief of anion transport restriction mediated by fast exchange of the less permeant Cl-ion with the highly permeant isothiocyanate anion.
The results presented in this paper show that the treatment of SAD mice with NS3623 improves erythrocyte hydration and diminishes sickling, probably by lowering of the Cl-conductance, which limits salt and concomitant water loss mediated by the Gardós channel. In support of this view, both the steady state K+ content and the cellular volume were significantly increased during the treatment with NS3623. Concurrent with these changes, the treatment also raised the intracellular Na+ content. A mechanistic interpretation may be that the NS3623-enhanced hyperpolarizations of “activated cells” accelerate Na+ influx through the sickling-induced cation pathway.32 The gradual depression of the Gardós channel-mediated Rb+ influx (Table 1), which appears in parallel with the change in hydration and cation contents in the 35- and 100-mg/kg per day dosing groups, is unexplainable in terms of anion restriction. Most likely this phenomenon represents a slowly progressing and complex secondary adaptation to the Cl-conductance block, which has yet to be explained. One possibility is that the increased intracellular Na+ concentration increases the block of the Gardós channel. Patch-clamp and in vitro experiments with RBC suspensions have shown that intracellular Na+ causes a fast flickering, steeply voltage-dependent block of the Ca++-activated K+-channel (Stampe and Vestergaard-Bogind33 and unpublished results). Both the net gain in Na+ and a possible increased block of the Gardós channel adds to the stabilization of cellular volume and, consequently, to the in vivo antisickling effects of NS3623.
These experiments provide the first demonstration that an anion conductance blocker enhances sickle cell hydration in vivo. In addition, they provide the rationale for assessing this potential new therapeutic modality in patients with sickle cell disease.
We thank Inge Hüttel and Angela Siciliano for their expert technical assistance with the dosing of the animals. We also thank Dr Mauro Kampera for his help with the RBC pictures.
Supported in part by National Institutes of Health grants U24 HL 58930 and P60 HL 38632 and by The Mizuno Fund at the Children's Hospital of Philadelphia.
Part of this work was published in abstract form in Blood 1999;94(suppl 1):#2998.
The publication costs of this article were defrayed in part by page charge payment. Therefore, and solely to indicate this fact, this article is hereby marked “advertisement” in accordance with 18 U.S.C. section 1734.
References
Author notes
Palle Christophersen, NeuroSearch A/S, Pederstrupvej 93, DK 2750 Ballerup, Denmark.

This feature is available to Subscribers Only
Sign In or Create an Account Close Modal