Abstract
Dehydrated hereditary stomatocytosis (DHS) is a rare genetic disorder of red cell permeability to cations, leading to a well-compensated hemolytic anemia. DHS was shown previously to be associated in some families with a particular form of perinatal edema, which resolves in the weeks following birth and, in addition, with pseudohyperkalemia in one kindred. The latter condition was hitherto regarded as the separate entity, “familial pseudohyperkalemia.” DHS and familial pseudohyperkalemia are thought to stem from the same gene, mapping to 16q23-q24. This study screened 8 French and 2 American families with DHS. DHS appeared to be part of a pleiotropic syndrome in some families: DHS + perinatal edema, DHS + pseudohyperkalemia, or DHS + perinatal edema + pseudohyperkalemia. If adequately attended to, the perinatal edema resolved spontaneously after birth. Logistic regression showed that increased mean corpuscular volume and mean corpuscular hemoglobin concentration were the parameters best related to DHS. In patients in whom cation fluxes were investigated, the temperature dependence of the monovalent cation leak exhibited comparable curves. Specific recombination events consistently suggested that the responsible gene lies between markers D16S402 and D16S3037 (16q23-q24). The 95% confidence limits (Zmax ≥ 3.02) spanned almost the complete 9-cM interval between these 2 markers.
Introduction
Genetic disorders of the red cell membrane permeability to Na+ and K+ account for a number of rare hereditary hemolytic anemias, characterized by an increased passive leak of the monovalent cations Na+ and K+. The intraerythrocytic cation concentrations can be altered to various extents, as well as cell hydration and morphology.1 Hereditary dehydrated stomatocytosis (DHS) (OMIM 194380),2,3 or hereditary xerocytosis, usually appears as a well-compensated chronic hemolysis. Familial pseudohyperkalemia (OMIM 177720) is characterized by an increase of the K+ concentration in plasma when freshly drawn blood is allowed to stand at temperatures lower than 37°C. It is devoid of hematologic symptoms.4-9 DHS and pseudohyperkalemia have a dominant inheritance pattern.
Dehydrated hereditary stomatocytosis has long been regarded as a purely hematologic condition.2,3,10-17 The osmotic resistance is increased and the osmotic gradient ektacytometric curve shows a leftward shift.1,18,19 Splenectomy dramatically increases the thromboembolic risk.20 Recently, DHS was shown to be part of a broader syndrome (OMIM 603528) in some families where it was associated with a particular form of perinatal edema,21,22which will be designated PEDHS. Pseudohyperkalemia22 could also be present. Although DHS and pseudohyperkalemia are lifelong manifestations, PEDHSresolves within weeks or months after birth (if not before). We hypothesized22 that the present pleiotropic syndrome would stem from the same gene. That the genes presumably responsible for both DHS and familial pseudohyperkalemia were found to map to 16q23-qter23 24 supported the one-gene hypothesis.
In 10 families, we reassessed the hematologic presentation of DHS. We compiled the various combinations of symptoms within the pleiotropic syndrome and evaluated the phenotypical variations that occurred within some kindreds. The temperature dependence of the monovalent cation leak was found comparable under distinct clinical presentations. Specific recombination events consistently suggested that the responsible gene lay between markers D16S402 and D16S3037 (16q23-q24) in a 9-cM interval.
Patients, materials, and methods
Kindreds
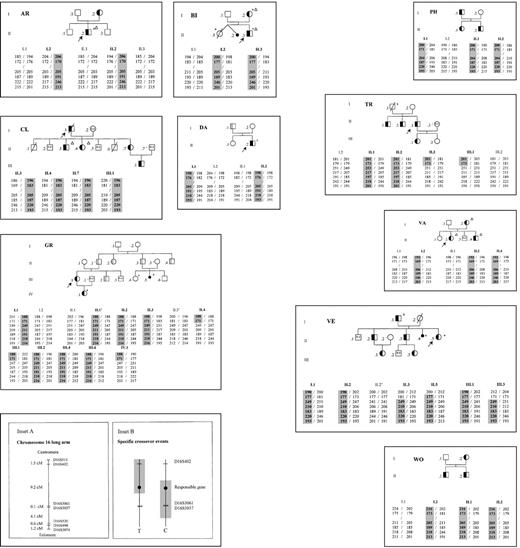
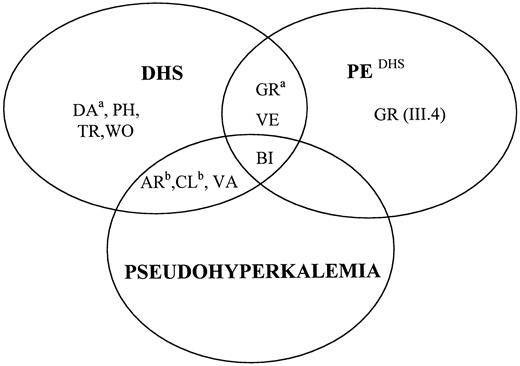
The genealogic trees of the 10 studied kindreds (8 French, 2 American) are presented in Figure1. There were respectively 4, 3, 2, and 1 families with DHS alone, DHS + pseudohyperkalemia, DHS + PEDHS, and all 3 manifestations (Figure2). None of these kindreds had been genetically studied before. Altogether, 37 patients and 18 unaffected members were investigated. Signed informed consent was obtained from all individuals investigated. Parents signed for minors.
Genealogic trees and microsatellite analysis.
Genealogic trees. The names of the families were given after the town where the diagnosis was first made or where one or several patients are living (AR, Arras; BI, Bicêtre; CL, Clichy; DA, Dax; GR, Grenoble; PH, Philadelphia, PA; TR, Troyes; VA, Vanves; VE, Vesoul; WO, Worcester, MA). Arrow indicates the proband; black, fully expressed hematologic picture; gray, weakly expressed hematologic picture (on the basis of red cell parameters and osmotic gradient ektacytometry); triangle, pseudohyperkalemia; asterisk, history of perinatal edema; S, splenectomized patient; small circle, stillborn baby with nonimmune hydrops fetalis; oblique bars, deceased persons; ne, nonexamined persons. Specific information on family GR is provided in the text. Microsatellite analysis. The shaded areas designate chromosomal segments assumed to carry the responsible gene. D16S3061 was tested when D16S3037 was not informative. In member II.4 of family GR, it could not be formally established whether the crossover event on the DHS chromosome had taken place between markers D16S402 and D16S3061 (the most likely possibility owing to the length of the interval, as indicated in the figure), or markers D16S3061 and D16S3037. Inset A shows assumed arrangement of markers and genetic distances between them on chromosome 16 (for references, see text). Inset B shows the occurrence of crossover events on either side of the responsible gene, assumed to lie in the D16S402-D16S3037 interval. Recombination events telomeric to the responsible gene, not reported before to our knowledge, left the gene on the centromeric subhaplotype side (D16S511-D16S402); those centromeric to the gene left it on the telomeric subhaplotype side (D16S3061-D16S303 7-D16S520-D16S498-D16S3074).
Diagram accounting for the various combinations of DHS (as a pure hematologic picture), pseudohyperkalemia, and PEDHS.
a indicates DHS with variable expression. bindicates pseudohyperkalemia with variable expression. Except for family BI, PEDHS was inconstant, as far as we could assess. Family WO was provisionally considered, by default, as devoid of pseudohyperkalemia (see text).
The classification of kindreds was established based on the maximum number of manifestations recorded (Figure 2). We are aware of the fact that we could underclassify some families for having missed, for example, the only member with pseudohyperkalemia in one kindred. PEDHS could be overlooked, had it been restricted to a mild edema and to the prenatal period, before ultrasound was available. No case of PEDHS could be found in 7 families. In each of the other 3 families, there was 1 stillborn fetus and 1 or 2 living members with antecedents of PEDHS.
Red cell indices and reticulocyte counts
Red cell indices and reticulocyte counts were measured in a H3 Blood Cell Counter (Bayer Diagnostics, Tarrytown, NY). Osmotic gradient ektacytometry25 was carried out as previously described.26 Logistic regression was performed with the Stata software (Stata Corporation, College Station, TX). The subjects were distributed in 2 groups (DHS and normal), based on their clinical and hematologic phenotypes. Red cell membrane proteins were analyzed, using sodium dodecyl sulfate-polyacrylamide gel electrophoresis (SDS-PAGE),27,28 with some modifications.29Usually, most if not all affected and unaffected members of each family were investigated in this respect.
Assessment of pseudohyperkalemia
Freshly drawn blood (lithium heparin tubes) was immediately placed in a water bath at 20° and 4°C for 6 hours (in duplicate).22 Aliquots, secured at t = 0 and t = 6 hours, were centrifuged (4°C, 2500 rpm, 10 minutes). The supernatant was again centrifuged (4°C, 5000 rpm, 7 minutes). Plasma potassium concentration was determined according to standard automatic procedures. Hemoglobinemia was measured spectrophotometrically followed by a double-derivative calculation to rule out any interference with bilirubin.30
Some families were seen in our department and blood incubations for kalemia determination were started on site. When field trips were necessary, whole blood incubations were performed locally. At the end of the incubations (as described above), the recovered plasma aliquots were temporarily secured at 4°C (4-8 hours) until they reached our department. Under such conditions, kalemia could undergo no further change because sera and erythrocytes had been separated. The 2 American families were not included in this protocol. Other methods (not shown) pleaded against pseudohyperkalemia in family PH. No tests were available as regards family WO.
Determination of intraerythrocytic cation concentrations and cation flux rates across the membrane
Blood samples (10 mL, citrate-phosphate-dextrose [CPD]-adenine tubes, 4°C) were shipped to London immediately after venisection. Intracellular electrolytes were measured as described.31 A travel control was included with samples from VE and VA. Travel controls showed a rise in [Na+] and a fall in [K+] of 3 to 5 mmol/L cells during overnight storage on ice in CPD (Chetty and Stewart, unpublished observations). Isotopic fluxes were determined using 86Rb+ as a tracer for K+ in a NaCl/MOPS/glucose solution, containing (concentration expressed in mmol/L): Na+, 145; K+, 5; Cl−, 150; MOPS-Na+, 15 (pH 7.4 at room temperature); glucose, 5; and ouabain and/or bumetanide, 0.1 each, if required (ouabain and bumetanide inhibit the Na+ pump and the Na+, K+cotransporter, respectively). The temperature dependence of the K+ leak (eg, the monovalent cation passive leak) was established by measurement of the ouabain + bumetanide-resistant86Rb+ influx as a function of temperature in the same solution.31
Microsatellite analysis
Analyses were performed using microsatellites slightly different from those used before23: D16S511, D16S402, D16S3061 (optional), D16S3037, D16S520, D16S498, and D16S3074. Their order from centromere to telomere and the genetic distances between them were derived from several online databases.32 In some cases, marker D16S3037 did not bring any information because family members were homozygotes. We then used marker D16S3061, centromeric yet close (0.1 cM) to marker D16S3037 (Figure 1, Inset A). We were not aware of other microsatellites in the D16S402-D16S3037 interval. The polymerase chain reaction (PCR) products were monitored in a ABI Prism 377 DNA Sequencer (Applied Biosystems, Foster City, CA). Results were processed through Genescan Software. The PCR was performed twice and fragment lengths measured on different gels.
Linkage analysis was performed on the basis of an autosomal dominant disease with a penetrance of 95%. This value was chosen in consideration of the 2 symptomless individuals (members I.1 and III.6 from family GR) thought to carry the DHS-associated haplotype (see below), and the 37 patients. Family BI was noninformative. The disease-gene frequency was set to 0.0012 as previously described,23 and the marker alleles frequencies were calculated from the parental allele repartition. Multipoint linkage was performed by use of the GENEHUNTER software package.33 The approximate 95% confidence limits for the maximum recombination fraction (θmax) at Zmaxwere calculated by the 1-lod-down method.34
Results
The hematologic picture
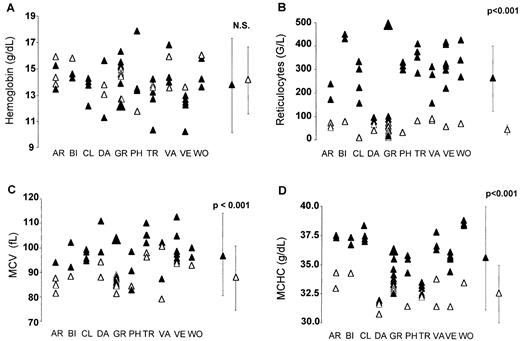
The term DHS will refer solely to the hematologic manifestations, including those evidenced by ektacytometry, and irrespective of the presence or absence of other manifestations. In general, hemoglobin was nonsignificantly diminished, whereas the reticulocytes were markedly increased, indicating a well-compensated anemia (Figure3). There was a definite tendency toward macrocytosis. The mean corpuscular hemoglobin concentration (MCHC) was significantly increased; however, hyperdense cells (MCHC > 41g/dL) failed to appear as significantly increased (threshold, 4%) (not shown). Logistic regression showed that MCHC and mean corpuscular volume (MCV) were the most significantly linked to DHS (odds ratios: 5.5 and 1.3, respectively, with P = .003 andP = .004, respectively). SDS-PAGE showed a normal profile in all the affected members who were investigated within each family (not shown).
Red cell parameters in DHS, whether nonhematologic manifestations were present or not.
The means between patients and controls were compared using the nonpaired Student test. ▴, patients; ▵, symptomless family members. (A) Hemoglobin was nonsignificantly decreased (P = .39). (B) Reticulocytes were significantly increased (P < .001). (C) MCV was significantly increased (P < .001). (D) MCHC was significantly increased (P < .001).
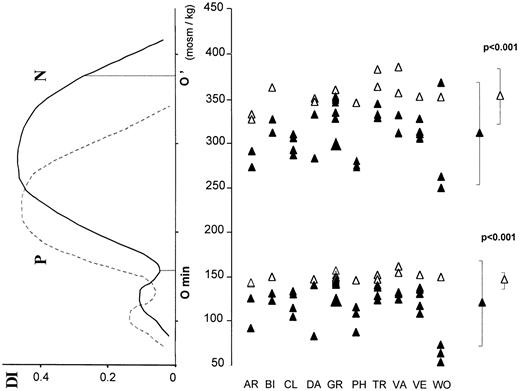
The osmotic gradient ektacytometric curve was shifted to the left (Figure 4). The deformability index remained within the normal range. The leftward displacement of the O′ point indicated cellular dehydration. The leftward displacement of Omin witnessed an increase of the red cell surface area/volume ratio. It appeared as the most consistent parameter in DHS.
Osmotic gradient ektacytometry.
The deformability index (DI) was measured for increasing osmolality of the red cells containing medium. Full line indicates control; dotted line, a patient whose curve was shifted leftward. The Ominpoint corresponds to the osmolality at which the red cells are maximally swollen. The O' point corresponds to the osmolality at which DI has half its maximal value.
Four affected patients underwent splenectomy as a treatment for their hemolytic disease. Long-term follow-up revealed the occurrence of thromboembolic complications in all of them. Patient II.2 from family AR, splenectomized at the age of 15, sustained a deep venous thrombosis at the age of 24. Patient II.2 from family DA, also splenectomized at the age of 15, developed a portal vein thrombosis 8 days later.35 Patient I.1 from family TR (who probably had DHS) died at the age of 32 of pulmonary thrombotic complications in the postsplenectomy period. Patient I.1 from family VE, splenectomized at the age of 44, suffered from recurrent episodes of superficial and deep venous thrombosis (once a year for 11 years and then less frequently), leading to severe venous ulceration in the lower limbs. These manifestations are consistent with the report by Stewart and coworkers20 and confirm that splenectomy is hazardous in DHS.
DHS as part of a pleiotropic syndrome; intrafamilial phenotypical variations in some kindreds
PEDHS has occurred in at least one living member of families BI, GR, and VE, and stillborn antecedents were present in each of these kindreds. Pseudohyperkalemia appeared in 4 of 8 tested families (families AR, BI,22 CL, and VA) (Figure 2). The presentation of the pleiotropic syndrome was not immutable within all kindreds. In some of them, we observed that any manifestation, the hematologic symptoms, PEDHS or pseudohyperkalemia, could vary on an intrafamilial basis, as detailed in the following.
The hematologic symptoms were missing or strongly reduced in some members even though they carried the DHS-associated haplotype. In family DA, member II.2 had conspicuously disturbed red cell parameters (and thrombotic antecedents), whereas only MCV, Omin, and O' were slightly altered in member I.1. In family GR, member III.1, the proband, had an unmistakable DHS. (Member IV.1 [unmistakable PEDHS] is not described here in detail.) Other members had strongly reduced hematologic symptoms yet they displayed, at the very least, a leftward shift of the Omin point at the ektacytometer. On the other hand, members I.1 and III.6 failed to even exhibit this feature. Member III.4 was in the same situation but, instead, she had had a perinatal edema (see above) offering a distinct facet of the pleiotropic syndrome.
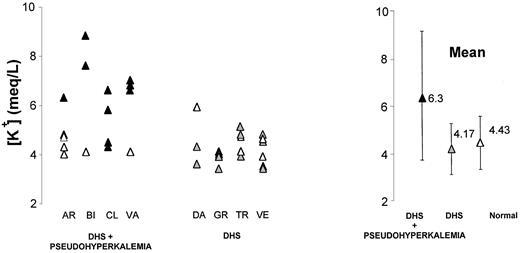
In families BI, the occurrence of PEDHS was constant, whereas it was inconstant in families GR and VE as far as we could document. Plasma K+ values (after 6 hours of incubation at 20°C) were above normal only in all DHS members from families BI and VA, but only in some within kindreds AR and CL (Figure5).
Pseudohyperkalemia in DHS.
Upon blood incubation (6 hours, 20°C), kalemia raised in all or only in some DHS members from families AR, BI, CL, and VA. Kalemia was raised in none of the DHS members from other kindreds. ▴, families DHS + pseudohyperkalemia; , families DHS alone; ▵, healthy members.
Pseudohyperkalemia in DHS.
Upon blood incubation (6 hours, 20°C), kalemia raised in all or only in some DHS members from families AR, BI, CL, and VA. Kalemia was raised in none of the DHS members from other kindreds. ▴, families DHS + pseudohyperkalemia; , families DHS alone; ▵, healthy members.
The cation leak
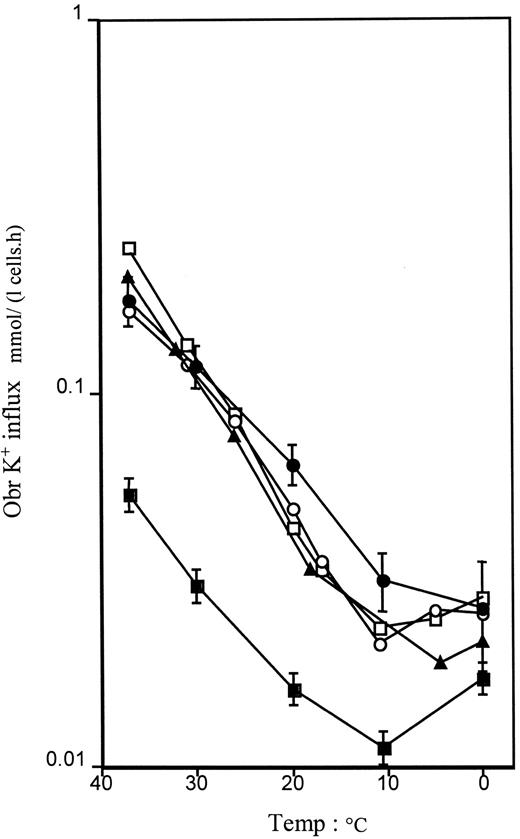
Measurements of intracellular Na+ and K+concentrations and of flux rates are shown in Table1. All values obtained were consistent with previously reported results for DHS.22 23 Individual GR III.1, however, showed normal intracellular Na+ and K+ concentrations, even after storage in the cold, but the isotopic flux rates showed a clearly increased ouabain + bumetanide-resistant K+ leak, and a strikingly elevated Na+, K+ pump rate at about 6 times normal, which can explain why the intracellular Na+ concentration was not high. In the temperature studies, all kindreds tested (CL, GR, VA, VE) showed increased fluxes at 37°C, and the temperature profiles fell within a narrow envelope that is essentially parallel to normal in these cases (Figure 6).
Intracellular Na+ and K+concentrations
| Donor . | Intracellular electrolytes (mmol/L cells) . | Isotopic K+ influx (5 mmol/L external [K+]) (mmol/L cells · h) . | |||
|---|---|---|---|---|---|
| [Na+] . | [K+] . | Na+, K+ pump ouabain-sensitive . | Na+, K+ cotransport bumetanide-sensitive . | Residual leak . | |
| CL II.7 | — | — | 3.360 | 0.690 | 0.139 |
| CL II.3* | — | — | 3.455 | 0.889 | 0.186 |
| CL III.1 | — | — | 3.049 | 0.318 | 0.201 |
| CL II.4* | — | — | 3.750 | 0.700 | 0.145 |
| Control | — | — | 2.070 | 0.510 | 0.066 |
| GR III.1 | 9.2 | 95.9 | 12.650 | 2.033 | 0.220 |
| VA II.2* | 21.1 | 77.8 | 3.081 | 2.233 | 0.144 |
| VE II.5† | 21.7 | 82.2 | 4.965 | 2.007 | 0.204 |
| Travel control | 15.1 | 96.9 | — | — | — |
| Normal | 5-11 | 85-105 | 1-2 | 0-1 | 0.06-0.10 |
Blood was always stored for at least 18 hours on ice prior to analysis. Intracellular electrolyte concentrations of family BI members, provided elsewhere,22 were consistent with values obtained in VA II.2 and VE II.5.
DHS + pseudohyperkalemia.
DHS + (personal) history of PEDHS.
The (ouabain + bumetanide-resistant) monovalent cation leak as a function of the temperature.
In family CL, the data reflect the mean ± SEM of 4 affected members (2 with DHS + pseudohyperkalemia, 2 with DHS alone). Data bear on single individuals in families GR (DHS alone), VA (DHS + pseudohyperkalemia), and VE (DHS + history of PEDHS). Normal represents the mean of 6 control laboratory volunteers. ●, family CL; ▪, six controls; ▴, family GR; ○, family VA; ■, family VE.
Microsatellite analysis
In the 10 investigated families, the location of the responsible gene was consistent with 16q23-q24 (Figure 1). Some crossover events repeatedly took place between microsatellites D16S402 and D16S3037. When some uncertainty remained about segregation of D16S3037, marker D16S3061, 0.1 cM centromeric to marker D16S3037, was used. For example, in family VE, one could not decide which of the 2 D16S3037 alleles (210 bp/210 bp) had been transmitted from the father (member I.1) to one of his sons (member II.3). Use of marker D16S3061 showed that it was subhaplotype D16S3061-D16S3037-D16S520-D16S498-D16S3074 (249-210-183-220-193 bp) that had been passed on en bloc.
In family GR, the fact that DHS had no penetrance in one member of the oldest generation (member I.1 or I.2) rendered difficult the interpretation of the haplotypes. Backing up from generation III (member III.1: overt DHS; member III.4: PEDHS) through generation II (DHS weakly expressed), a highly plausible haplotype pattern including crossover events was found. It implied that members I.1 and III.6 would carry the DHS-associated haplotype. These 2 extreme and puzzling cases led us to equal the penetrance of the condition to 95% in the study.
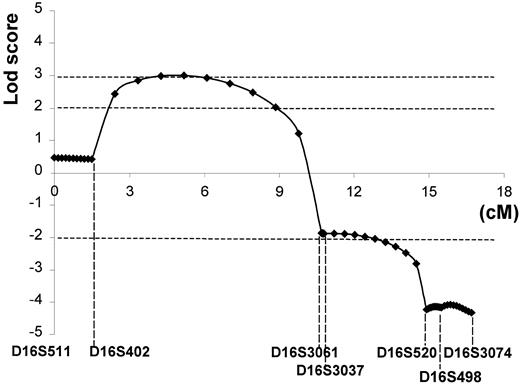
Crossover events occurring in the D16S402-D16S3037 (9-cM) interval appeared consistently either centromeric (family VE) or telomeric (families GR and TR) to the gene (Figure 1, Inset B). Significant lod scores (Zmax ≥ 3.02) were obtained between these 2 markers (Figure 7). The telomeric region was completely excluded from microsatellite D16S520. The 95% confidence limits spanned almost the complete 9-cM interval between markers D16S402-D16S3037.
Lod score.
The 95% confidence limits (Zmax ≥ 3.02) for the location of the responsible DHS locus spanned almost the complete 9-cM interval between markers D16S402-D16S3037 (16q23-q24).
Lod score.
The 95% confidence limits (Zmax ≥ 3.02) for the location of the responsible DHS locus spanned almost the complete 9-cM interval between markers D16S402-D16S3037 (16q23-q24).
Discussion
Spurred by initial observations by Entezami and colleagues21 and ourselves,22 the aims of this work were to (1) revisit the hematologic picture of DHS, (2) define how DHS was part of a broader syndrome including PEDHS or pseudohyperkalemia and assess the phenotypical variations observed within some kindreds, (3) evaluate the alteration of the cation leak, and (4) determine whether the responsible gene would in all kindreds map to 16q23-q24.23
The hematologic picture
We confirmed that red cell parameters can give a substantial hint at the diagnosis: well-compensated hyperhemolysis, high reticulocyte count, increased MCV and MCHC, but a variable increase in the percentage of hyperdense cells. Specifically, logistic regression showed that MCHC and MCV were the parameters most significantly linked to DHS. Osmotic gradient ektacytometry yielded the most consistent information through the leftward shift of Omin point. In the absence of available ektacytometry, increase in the osmotic resistance, measured on fresh blood, would be the best diagnostic test to detect DHS. The Omin point (osmolality at which the red cells are maximally swollen in ektacytometry) corresponds to the 50% hemolysis point in the fragility osmotic testing.
DHS as part of a pleiotropic syndrome; intrafamilial phenotypical variations in some kindreds
The presentation of the pleiotropic syndrome was not immutable within all kindreds. We observed that any manifestation, the hematologic symptoms, PEDHS and pseudohyperkalemia, could vary on an intrafamilial basis. The most compelling case was provided by family GR. Member III.1 presented with typical hematologic symptoms but no known history of PEDHS, and her cousin (member III.4) had had a plain history of PEDHS but displayed no hematologic manifestations.
PEDHS deserves special comments. It would be a mistake to infer a cause-to-effect relationship between fetal edema and fetal anemia (by analogy with immune hydrops fetalis that follows severe α-thalassemia, for instance). Rather, DHS and PEDHS share a relationship of coexistence with regard to the same genetic cause. Treating anemia in utero was of no use to cure the edema.21 The transient character of the edema, when present, remains to be accounted for.
Homogeneity of red cell cation abnormalities
All kindreds tested showed typical abnormalities of intracellular Na+ concentrations and flux rates, as defined for DHS,23 with the exception of family GR. Family GR showed near normal intracellular Na+ and K+concentrations, whereas the flux rates indicated a significant cation leak with a more than usually obvious increase in the Na+, K+ pump rate. The explanation for this is unclear. This illustrates that it is not possible to exclude the presence of “leaky red cells” on the basis of measurement of intracellular Na+ and K+ concentrations alone, without recourse to flux rate measurement as well. As for the temperature dependence of the cation leak, all members tested exhibited a comparable curve that was simply shifted up the y-axis compared to normal, as seen previously in an Irish family with DHS.23,36 Altogether, despite some variations, it appeared that the cation leak essentially showed similar patterns whatever the status of DHS, alone or part of a broader syndrome. This pattern is close also to that encountered in chromosome 16-related familial pseudohyperkalaemia.24 On the other hand, it clearly departed from that found in a variant form of hereditary stomatocytosis with pseudohyperkalemia.31
The genetic homogeneity
In all kindreds tested, mapping of the responsible gene was consistent with 16q23-q24. This supports the view that the DHS pleiotropic syndrome is a monogenic syndrome. Specific crossover events suggested that the responsible gene would lie between markers D16S402 and D16S3037 (or D16S3061 if tested). In previous studies, Carella and coworkers23 and Iolascon and colleagues24 used 2-point linkage analysis. The latter did not allow assessment of how likely was the presence of a gene over the whole interval between 2 particular markers. The crossover events exhibited by the Irish DHS family, referred to as family A,23 were comparable to those observed in family VE presented here. In the present study, using a multipoint linkage analysis, the 95% confidence limits (Zmax ≥ 3.02) spanned almost the complete 9-cM interval between markers D16S402 and D16S3037.
The kindreds do not share a common haplotype because they are unrelated in all likelihood. PEDHS was expressed in member II.5 from family VE (along with DHS) who carries telomeric subhaplotype (D16S402, D16S3061, D16S3037, D16S520, D16S498, and D16S3074). It was also expressed in member IV.1 (not detailed here) from family GR who carries the restricted centromeric subhaplotype (D16S511, D16S402). These 2 cases matched with a D16S402-D16S3037 interval location of the PEDHS locus, just as they do for DHS itself. Therefore, it is doubtful whether a second locus would come into play as for PEDHS.
This study agrees with the works by Innes and associates37that excluded a linkage of DHS with the α-adducin,β-adducin, and stomatin genes, and by Gallagher and Smith,38 ruling out a linkage with the hIK1gene, a Gardos channel candidate. A variant form of hereditary stomatocytosis was described31 and did not map to chromosome 16.39
In this work, a complete account of the DHS hematologic phenotype was provided in 10 families. DHS appeared to be part of a pleiotropic syndrome, including perinatal edema and pseudohyperkalemia in some kindreds. We further showed intrafamilial phenotypical variations in some kindreds. The monovalent cation passive leak displayed comparable patterns whatever the symptoms. Finally, specific recombination events and lod score calculations consistently suggested that the responsible gene would lie between markers D16S402 and D16S3037 in a 9-cM interval (16q23-q24) (Zmax ≤ 3.02). Gene identification is pending.
Acknowledgments
We are grateful to the investigated families for their kind cooperation. We thank Dr M. C. Chetty, Dr F. Clerget, Pr A. Spira, and Pr M. Vidaud for their critical advice, and also Ms. M. Dehan and Dr F. Baklouti for their careful reading of the manuscript.
Clinician and laboratory investigators having participated in the work: Dr C. Barro (Hôpital Michallon, Grenoble, France), Dr J.-P. Blondel (Laboratoire de Biologie Médicale, Arras, France), Drs B. Cantelou and F. Lifermann (Centre Hospitalier, Dax, France), Drs B. Coupe, P. Saladin, and P. Thierry (Centre Hospitalier Paul-Morel, Vesoul, France), Dr G. Dine (Centre Hospitalier, Troyes, France), and Dr R. A. Drachtman (Robert Wood Johnson University Hospital, NJ).
Supported by the Institut National de la Santé et de la Recherche Médicale (Unité 473), the Fonds d'Etudes et de Recherche du Corps Médical de l'Assistance Publique-Hôpitaux de Paris, the Délégation à la Recherche Clinique de l'Assistance Publique-Hôpitaux de Paris (CRC96082), the Fondation pour la Recherche Médicale, the Faculté de Médecine Paris-Sud (France), the Telethon Projects E-645 and E-743, the MURST, the Ministero Italiano delle Sanità (Italy), and by Action Research and the WELLCOME Trust (UK).
The publication costs of this article were defrayed in part by page charge payment. Therefore, and solely to indicate this fact, this article is hereby marked “advertisement” in accordance with 18 U.S.C. section 1734.
References
Author notes
Sabine Grootenboer, INSERM U 473, 84 rue du Général-Leclerc, 94276 Le Kremlin-Bicêtre, France; e-mail: delaunay@kb.inserm.fr.

This feature is available to Subscribers Only
Sign In or Create an Account Close Modal