Abstract
It is widely thought that expression of ABH antigens on platelets is insufficient to materially affect the survival of ABH-incompatible platelets in transfusion recipients, but anecdotal reports of poor survival of A and B mismatched platelets suggest that this is not always the case. The A and B antigen expression on platelets of 100 group A1 and group B blood donors was measured, and 7% and 4%, respectively, had platelets whose A and B antigen levels consistently exceeded the mean plus 2 SD. On the basis of flow cytometric and statistical analysis, donors whose platelets contained higher than normal levels of A antigen were subdivided into 2 groups, designated Type I and Type II (“high expressers”). Serum A1- and B-glycosyltransferase levels of A and B high expressers were significantly higher than those of group A1 and B individuals with normal expression. H antigen levels were low on the red cells of high expressers, indicating that the anomaly affects other cell lineages. Immunochemical studies demonstrated high levels of A antigen on various glycoproteins (GPs) from high-expresser platelets, especially GPIIb and PECAM (CD31). The A1 Type II high-expresser phenotype was inherited as an autosomal dominant trait in one family. The sequences of exons 5, 6, and 7 of the A1-transferase gene of one Type II A1 high expresser and exon 7 from 3 other genes were identical to the reported normal sequences. Further studies are needed to define the molecular basis for the high-expresser trait and to characterize its clinical implications.
Introduction
It has been known for many years that human platelets carry detectable quantities of A and B blood group antigens on their surface,1 but it is widely thought that the quantity of antigen expressed is too small to materially affect the survival of ABH-incompatible platelets in transfusion recipients. It is therefore a common practice to transfuse ABH-incompatible platelets when the need arises. However, occasional reports2-4 have described instances in which posttransfusion recovery from A- or B-incompatible platelets was extremely poor, but satisfactory increments were obtained when ABO compatibility was observed. Motivated by an experience of this type, Ogasawara et al4 recently studied the expression of A and B antigens on platelets of Japanese blood donors. They found that approximately 7% of these donors had platelets that carried significantly more A or B antigen than platelets from the majority of A- and B-positive subjects with normal antigen expression. This phenotype, designated “high expresser,” was found to be inherited as a dominant trait and was unrelated to secretor phenotype.4
In this report we show that a minority of Caucasians, like their Japanese counterparts, have platelets that carry significantly more A or B blood group antigen than platelets from A- and B-positive individuals with normal antigen expression. We present evidence that high expressers of the A1 antigen comprise at least 2 subgroups, describe immunochemical and genetic studies of the high-expresser trait, and speculate on its possible clinical significance.
Materials and methods
Antibodies
Polyclonal anti-A antibody was obtained from a healthy nontransfused blood group O male donor whose serum contained a high titer immunoglobulin G (IgG) anti-A,B antibody. We used the following monoclonal antibodies (mAbs): BRIC 145 anti-A, BGRL1 anti-B, and BRIC 198 anti-H (International Blood Group Reference Laboratory, Bristol, England); Th1 anti-Type 3 chain A (Dr Henrik Clausen, Dental Institute, Copenhagen, Denmark); AP2 anti-GPIIb/IIIa (Dr Thomas Kunicki, Scripps Institute, La Jolla, CA); AP3 anti-GPIIIa and MBC 78.2 anti-CD31 (PECAM-1) (Dr Peter Newman, Blood Research Institute, Milwaukee, WI); MBC142.11 anti-GPIb/IX (Dr Robert Montgomery, Blood Research Institute); MOPC-21, an irrelevant murine IgG mAb (Sigma Chemical, St Louis, MO); and MBC 131.4 anti-GPIV (CD36), MBC 132.1 anti-GPIIb, and MBC 143.1 anti-GPIa/IIa from our own laboratory.
Measurement of A, B, and H antigens on platelets and red blood cells
We sensitized 10 μL washed platelets (4 × 10⁷ platelets) isolated from ethylenediamine tetraacetic acid (EDTA) blood5 with 50 μL human group O plasma containing a high-titer IgG anti-A,B antibody. In preliminary studies, we found that this quantity of antibody was sufficient to saturate available A antigen sites, and histograms obtained with this human antibody did not differ significantly from those obtained with monoclonal probes specific for A and B antigens. After washing 3 times in PEB (phosphate-buffered isotonic saline containing 0.5% bovine serum albumin [BSA]), the platelet-bound IgG was analyzed by flow cytometry as previously described.5 6 Normal ABO-identical plasma and plasma containing an anti-P1A1 antibody were used in each assay as negative and positive controls, respectively. The ratio of the mean linear fluorescence obtained with test platelets to that obtained with platelets incubated with normal ABO-identical plasma was used as the index of A or B antigen levels on test platelets. The levels of H antigen on platelets and red blood cells (RBCs) were determined similarly by using the H-specific mAb BRIC 198.
Measurement of serum A1- and B-glycosyltransferase activities
A1- and B-glycosyltransferase levels in serum were assayed according to the method of Yabe et al7 except that an immunofluorescent endpoint, rather than agglutination, was used to measure A and B determinants. We incubated 5 μL papain-treated, washed group O substrate RBCs in a 50% suspension with 100 μL serum, 50 μL 1.6 mmol/L UDP-N-acetylgalactosamine (Sigma), and 25 μL 0.1 mol/L cacodylic acid (pH 6.0) containing 0.1 mol/L manganese dichloride (MnCl2). After incubation for 2 hours at 37°C, the RBCs were washed 3 times in PEB, and newly synthesized group A antigen was detected by flow cytometry using the A-specific mAb, BRIC 145, and fluorescein isothiocyanate (FITC)-labeled goat antimouse IgG (Jackson Immunoresearch Laboratories, West Grove, PA). In preliminary studies we found that these conditions were optimal for comparing A1-transferase activities in different serum samples, ie, the amount of synthesized A antigen was proportional to the amount of serum added. The B-glycosyltransferase activity was assayed in the same way except that UDP-D-galactose (Sigma) was used as the substrate, and monoclonal BGRL1 was used to detect B antigen.
Detection of A1 antigen on individual GPs by antigen capture enzyme-linked immunosorbent assay
A modification of the ACE (antigen capture enzyme-linked immunosorbent assay [ELISA]) assay8 was used to identify GPs carrying blood group A antigen. GP-specific mAbs were bound to the wells of microtiter plates (1 μg mAb per well) overnight at 4°C. The wells were treated with a blocking buffer containing 0.05 mol/L Tris-saline (tris[hydroxymethyl] aminomethane–saline), 0.08% Tween-20, and 1% BSA (pH 7.0). Platelets (50 μL at 2 × 10⁵ platelet equivalents per μL) solubilized in lysis buffer (0.05 mol/L Tris-saline, 1% Triton X-100, 2 mmol/L phenylmethylsulfonyl fluoride [PMSF], and 1 μg/mL aprotinin [pH 7.0]) were added to each well for 1 hour at room temperature to allow capture of GPs by immobilized mAbs. After washing, the wells were incubated for 1 hour with 50 μL of a 1:100 dilution of biotinylated monoclonal anti-A (BRIC 145) to saturate A antigen sites. After washing, bound mAb was quantified with alkaline phosphate (ATP)–labeled streptavidin using P nitrophenyl phosphate substrate (ZYMED, San Francisco, CA). The plated mAb (1 μg) exceeded the amount needed to saturate each microtiter well and to capture the most abundant platelet GP complex (GPIIb/IIIa) present in the quantity of platelet lysate added (equivalent to 107platelets).
Western blot analysis
The platelets were solubilized in lysis buffer and centrifuged at 16 000g for 30 minutes to remove insoluble material. A 10-μL aliquot (platelet equivalent, 5 × 10⁷ platelets per μL) of lysate was mixed with 3 μL sodium dodecyl sulfate (SDS) sample buffer (Pierce, Rockford, IL), boiled for 5 minutes at 100°C, and electrophoresed in a gradient (4%-12%) SDS-PAGE (polyacrylamide gel electrophoresis) under nonreducing conditions. The proteins were transferred (at 2 hours at 25 V) from gels to polyvinylidene difluoride (PVDF) membranes in 0.05 mol/L Tris-glycine buffer with 20% methanol using a Blot Module (NOVEX, San Diego, CA). After incubation overnight at 4°C in blocking buffer, the individual lanes were incubated with 10 mL mAb at a concentration of 1 μg/mL for 3 hours at room temperature. After washing with Tris-saline containing 0.08% Tween-20, the lanes were incubated in 10 mL blocking buffer containing a 1:18 000 dilution of horseradish peroxidase (HRP)–labeled F(ab′)2 fragment of goat antimouse IgG. After further washes, they were incubated for 1 minute in hydrogen peroxide (H2O2) and luminol enhancer (Pierce) and exposed to x-ray film.
Immunoprecipitation
The platelet GPs were immunoprecipitated from platelet lysates prepared from normal-expresser subjects of known blood group phenotypes as previously described,5 although with slight modifications. GP-specific mAbs were linked to CNBr-activated Sepharose 4B beads (Sigma) by a standard method.9 Then 100 μL antibody-coated beads were incubated with 100 μL detergent-solubilized platelets (platelet equivalent, 5 × 10⁶ platelets per μL) overnight at 4°C. The beads, containing captured GPs, were washed 4 times in lysis buffer, and the associated GPs were eluted by incubation for 5 minutes with 500 μL lysis buffer (pH 2.8). After centrifugation, the supernatant was neutralized with 5 N NaOH. The eluted GP was concentrated and subjected to SDS-PAGE and Western blotting as described above.
Statistical analysis
The Student t test for unpaired values was used to determine the significance of the differences between population means. To determine whether the platelets expressing higher amounts of blood group A1 or B antigens were a separate population or simply the high end of a normal distribution, a likelihood ratio test was performed. In this test it was assumed that under the null hypothesis, the values came from a single normal (Gaussian) distribution with unknown mean and variance. Under the alternative hypothesis, it was assumed that the values came from a population which was a mixture of 2 types of subjects, each normally distributed with distinct means and variances. In this model, using the expectation maximization (EM) algorithm, one can find maximum likelihood estimates of the mixing percentage, the 2 means, and the 2 variances.10The log likelihood is computed under both the null and the alternative hypothesis. The test statistic is twice the difference of these log likelihoods, which has a Chi-squared distribution with 3 degrees of freedom under the null hypothesis that the data came from a single normally distributed population.
Results
Platelets from some blood group A1 and B individuals of Caucasian ancestry carry higher than normal levels of A or B antigen
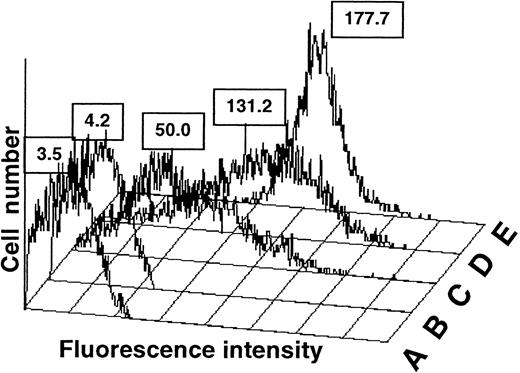
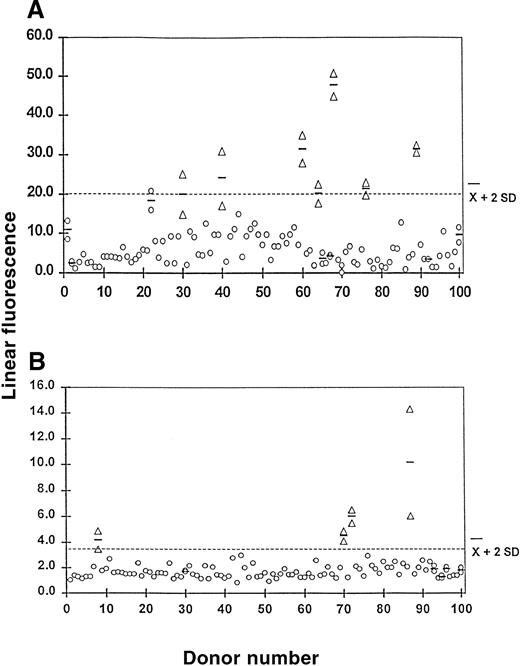
In confirmation of previous reports,3,11-13 we found that platelets from most A1 donors carry low levels of A antigen, and A antigen is not detectable or is only barely detectable on platelets from A2 donors by flow cytometry (Figure1C,B, respectively). However, higher levels of A antigen were detected on platelets of some A1donors (Figure 1D,E). To characterize this apparent anomaly, we measured A and B antigen expression on platelets from 100 group A1 donors and 100 group B donors of Caucasian ancestry who were randomly selected. As shown in Figure2, platelets from 7 of the group A1 donors (7%) and 4 of the group B donors (4%) had platelet A or B antigen levels that exceeded the mean plus 2 SD. Repeat measurements were made on platelets from each of these individuals and on 6 group A1 donors and 5 group B donors whose platelets carried lesser amounts of A1 or B. As shown in Figure 2, the repeat assays were comparable to the initial ones in each instance. Platelet A1 and B antigen levels determined with the mAbs BRIC 145 and BGRL1 were qualitatively and quantitatively similar to those obtained with human anti-A,B (data not shown). These findings indicate that platelets from at least 7% of group A1 and 4% of group B Caucasian individuals carry significantly more A and B antigen than platelets from the majority of normal A-positive and B-positive subjects. Following Ogasawara et al,4 we designated these individuals as high expressers of A or B. Each of the 11 high expressers were typed as Le(a−b+), according to the Lewis system, and were therefore a secretor of blood group antigens.
Fluorescence histograms of platelets treated with human anti-A,B.
In this assay, O platelets (A) could not be distinguished from A2 platelets (B). The platelets from most A1donors (C) gave a broad histogram that overlapped the histograms of group O and group A2 platelets. However, some A1 platelet preparations (D) gave a broad histogram similar in shape to that of normal-expresser A1 platelets, but shifted to the right, and (E) 2 of 100 donors gave a sharp peak consisting of platelets expressing much higher levels of A antigen. The histograms shown are referred to as Type I (D) and Type II (E) high expresser.
A1 and B antigen expression on platelets from 100 normal-expresser group A1 and group B blood donors determined by flow cytometry.
Values shown on the ordinate are the ratios of the mean fluorescent signal obtained with serum containing anti-A,B to that obtained with ABO-compatible serum used at the same dilution. The horizontal line indicates the mean for the total population plus 2 SD. Platelets with A1 (A) or B antigen (B) levels that exceeded the mean plus 2 SD (indicated by triangles) were tested a second time, and the results were averaged (horizontal bars). We retested 6 A1and 5 B platelet preparations with lower antigen values, and their averages are indicated by the horizontal bars. The platelets from 7 A1 and 4 B donors (indicated by triangles) expressed levels of the A1 or B antigen, which were consistently at least 2 SD above the mean for the total population.
Analysis of the histograms of the high-expresser group A platelets showed that 5 of the 7 histograms were similar in shape to those of the normal A1 platelets (Figure 1C), but they shifted toward higher values (Figure 1D). Platelets from the remaining 2 donors (Figure 2, donors 60 and 67) yielded a histogram with a sharp peak and a much higher value for mean A antigen expression (Figure 1E). These patterns were highly reproducible in repeat blood samples obtained several months apart from the same high-expresser and normal-expresser individuals. We will refer to the first group of high expressers as Type I and the second group as Type II. Platelets from each of the 4 group B high expressers gave a Type I pattern (data not shown).
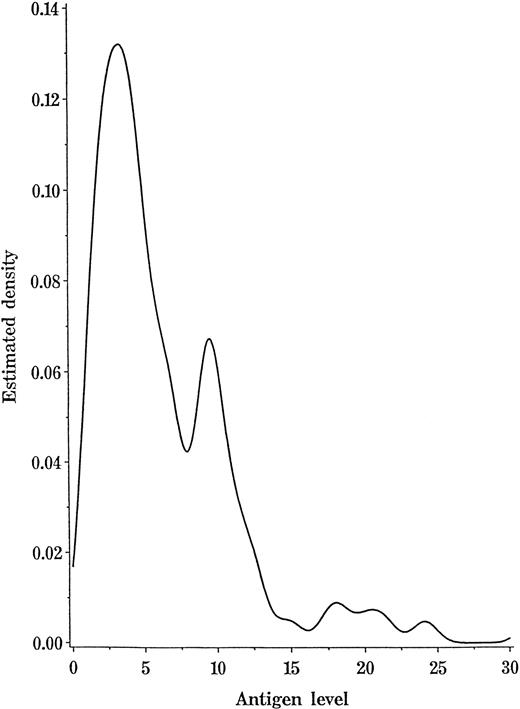
From both quantitative and qualitative standpoints, platelets from the 2 Type II high-expresser donors (Figure 1E) differed from those of other A1 individuals, but it was less clear whether Type I high expressers (Figure 1D) belonged to a separate subgroup. Accordingly, values for the mean expression of the A antigen on platelets from 98 A1 donors (excluding the 2 Type II high expressers) and each of the 100 group B donors were subjected to a likelihood ratio test using the EM Algorithm.14 The analysis for A1 expression favored the existence of 2 populations (P < .0001), one with a mean of 3.5 (SE = 0.32) and a 1.54 SD and the second with a mean of 10.2 (SE = 0.25) and a 5.81 SD (SE = 0.6). It was estimated that 54.7% (SE 8%) of the total was in the population with the smaller mean. With the B donors, the analysis also favored 2 populations (P < .0001), 1 with a mean of 1.7 (SE = 0.05) and a 0.45 SD (SE = 0.04) and another with a mean of 5.23 (SE = 0.04) and a 2.66 SD (SE = 0.83). The estimated proportion in the population with the smaller mean was 94.6% (SE = 0.028). Figure3 shows a kernel-smoothed histogram of the density function of the 98 values obtained with platelets from the group A1 donors. The existence of 2 populations is readily apparent.
Kernel-smoothed histogram of A antigen expression on platelets from 98 group A1 donors (excluding 2 Type II high expressers).
The area under the curve between the 2 values represents the probability of obtaining a value for the A antigen expression in that range.
Kernel-smoothed histogram of A antigen expression on platelets from 98 group A1 donors (excluding 2 Type II high expressers).
The area under the curve between the 2 values represents the probability of obtaining a value for the A antigen expression in that range.
Four additional Type II A1 donors were identified in studying unresolved cases of possible neonatal alloimmune thrombocytopenic purpura
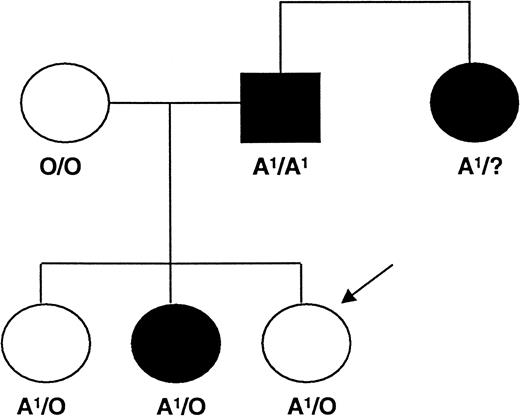
Identification of the Type II high-expresser A1phenotype led us to wonder whether the maternal anti-A antibody might be capable of causing inutero destruction of the platelets of a fetus with this anomaly. We therefore measured the A1 antigen on the platelets of 50 group A fathers of infants with suspected neonatal alloimmune thrombocytopenia born to blood group O or B mothers. In the mothers' serum, it was not possible to identify antibodies specific for recognized platelet-specific alloantigens. Two fathers were identified as Type II expressers of A1. In one family, it was not possible to determine the baby's ABO type. In the second family, the baby was designated blood group A1. Platelets obtained from this infant at 10 days of age had an A antigen distribution similar to that of an A1 individual with normal expression (Figure 1C). In the second family, the platelets were obtained from a paternal aunt and 3 children, each of whom was positive for blood group A1. The Type II high-expresser trait was identified in the paternal aunt and in 1 of the 2 older siblings, which is consistent with an autosomal dominant mode of inheritance (Figure 4). The sibling who was a Type II high expresser was not known to have been thrombocytopenic at birth.
Inheritance of the Type II high-expresser A1 platelet phenotype in one family.
This family was studied because of an apparent neonatal alloimmune thrombocytopenia in the third child, who is indicated by an arrow.
Inheritance of the Type II high-expresser A1 platelet phenotype in one family.
This family was studied because of an apparent neonatal alloimmune thrombocytopenia in the third child, who is indicated by an arrow.
Type I and Type II high-expresser phenotypes were associated with higher than normal levels of serum A1-transferase
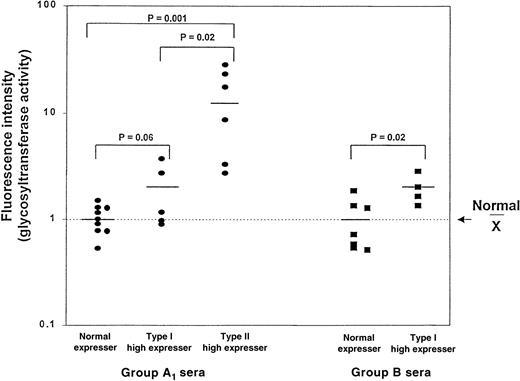
The A1-transferase activity was measured in serum from the 6 Type II high-expresser individuals identified among normal-expresser donors and in the 2 families described above, in 5 Type I high-expresser and 9 normal-expresser A1individuals. As shown in Figure 5, the average levels of A1-transferase in Type I and Type II high expressers were approximately 1.7 and 12.6 times higher, respectively, than levels of other A1 individuals. These differences were statistically significant (P = .001) only for the Type II donors (Figure 5). The average levels of B transferase in 4 Type I high expressers were 2.0 times higher than those in 7 normal-expresser group B individuals (P = .02).
A1- and B-glycosyltransferase levels in serum from normal and high expressers.
Serum was obtained from A1 and B normal expressers and Type I A1, Type II A1, and B high expressers. The values obtained with serum from the normal-expresser donors were normalized to a mean of 1.0, and the values obtained with serum from the high expressers was expressed relative to that mean. Note the use of a logarithmic scale on the ordinate.
RBCs and platelets of Type II high expressers of the A antigen could be distinguished from those of normal-expresser A1individuals by measuring levels of the H antigen
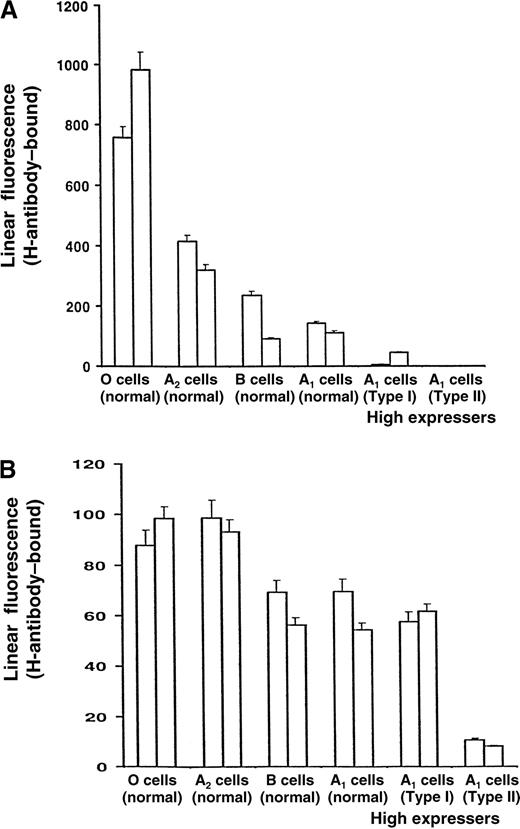
RBCs of normal-expresser A1 persons carry significant numbers of substrate H antigens not converted to A antigen by A1-transferase during RBC development. To determine whether the high-expresser anomaly affected RBCs as well as platelets, we measured the H substance on RBCs from high-expresser and other individuals using the H-specific mAb BRIC 198. As shown in Figure6, the number of H determinants, as expected, was highest on group O cells and was progressively lower on group A2 cells and normal-expresser group B and group A1 cells. However, A1 RBCs from Type I high expressers contained significantly less H than A1 cells from normal-expresser subjects, and the H antigen could not be detected on RBCs from the Type II A1 high expressers. The H antigen levels were about the same on platelets from Type I high expressers and normal-expresser A1 individuals, but they were extremely low on the platelets of Type II high expressers.
Levels of H antigen on erythrocytes and platelets from various donors.
The erythrocytes (A) and platelets (B) were taken from 2 donors from each of the following groups: group O, group A2, B and A1 normal expressers, and Type I and Type II A1high expressers.
Levels of H antigen on erythrocytes and platelets from various donors.
The erythrocytes (A) and platelets (B) were taken from 2 donors from each of the following groups: group O, group A2, B and A1 normal expressers, and Type I and Type II A1high expressers.
High levels of A1 on the platelets of high expressers could not be accounted for by greater than normal synthesis of Type 3 A chains
The Type 3 A chain structure is created by the addition of one or more A trisaccharides to the terminal N-acetyl galactosamine of a “conventional” A antigen.14 The qualitativedistinction between the A1 and A2subgroups, as opposed to the quantitative difference resulting from the lower activity of the A2-transferase, reflects in part the inability of the A2-transferase to convert a Type 3 H chain to a Type 3 A chain.14 We wondered whether the high A antigen levels on the platelets of Type I and/or Type II high expressers might result from an A-transferase with an exceptional ability to synthesize Type 3 A chains. As expected, the Type 3 A chain-specific mAb, Th1,14 bound readily to group A1 RBCs, but Th1 only bond in trace amounts to group A2 RBCs. However, it failed to bind to platelets from Type I or Type II high-expresser or normal-expresser A1individuals (data not shown), thereby indicating the absence of a detectable Type 3 A chain structure.
High levels of A antigen were found on various membrane GPs of platelets from Type I and Type II high expressers
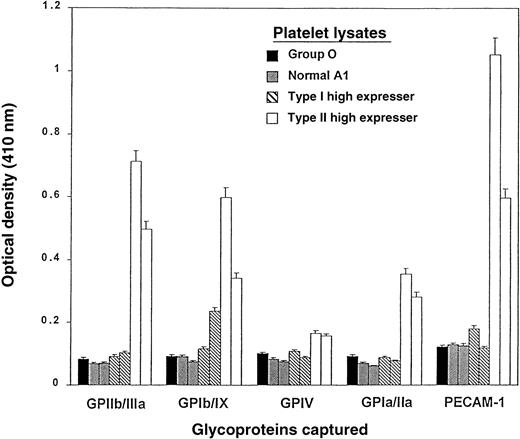
In platelets from 2 Type I high-expresser individuals studied by ACE, higher than normal levels of A antigen were detected on PECAM in one individual and on GPIb/IX in the other (Figure7). In platelets of 2 Type II high expressers, GPIa/IIa, IV, PECAM, Ib/IX, and IIb/IIIa all carried higher levels of A antigens than the same GPs from the other A1individuals. This assay was not sufficiently sensitive to distinguish normal-expresser A1 platelets from O platelets.
Levels of A1 antigen on GPs captured from platelet lysates prepared from various donors.
One donor was from group O (indicated by a ▪), and 2 donors were from each of the following groups: A1 normal expressers (▨); Type I high expressers of the A antigen (▧); and Type II high expressers of the A antigen (■). GPIIb/IIIa, GPIb/IX, GPIV, GPIa/IIa, and PECAM-1 (CD31) were captured from the lysates with GP-specific mAbs, and their A1 antigen content was determined with biotin-labeled monoclonal anti-A (BRIC 145). The results are expressed as O.D. measured at 410 nm. The brackets indicate 1 SD (triplicate determinations).
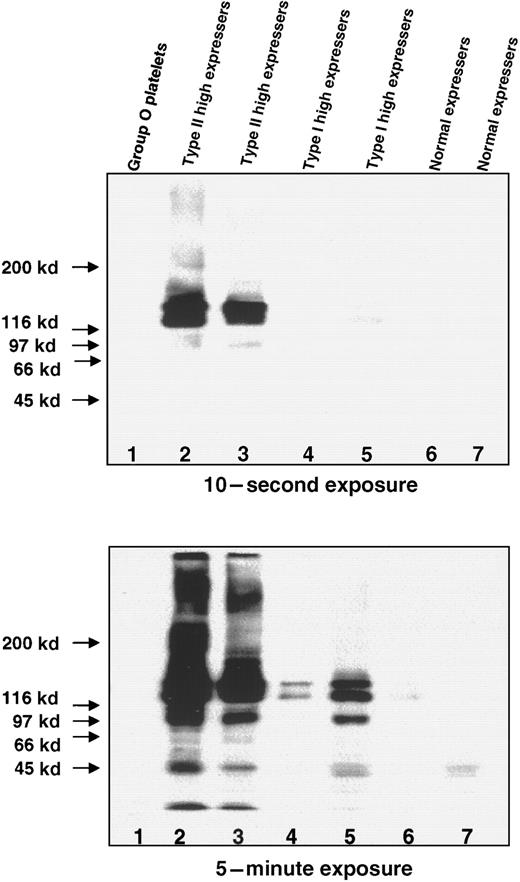
High levels of the A antigen were also detected on membrane GPs of high-expresser individuals by Western blotting. As shown in Figure8, bands with a MW of approximately 140 kd and 130 kd were prominent in platelets from 2 Type II high expressers, and weaker bands with the same mobility were detected in platelets of 2 Type I high expressers. Upon prolonged exposure, the bands of similar molecular weight were identified in 2 normal-expresser A1 individuals but not in the GP from the group O platelets.
Western blots of the A antigen on GPs in lysates prepared from group O platelets, normal expressers of A1, and Type I and Type II high expressers of A1.
The platelets were solubilized and separated on a 4%-12% gradient SDS-PAGE under nonreducing conditions. The blots were incubated with monoclonal anti-A (BRIC 145), and the bound antibody was detected with HRP-labeled antimouse IgG and chemiluminescence after 10 seconds (top) and 5 minutes (bottom). (Lane 1) Group O platelets. (Lanes 2 and 3) Type II high-expresser platelets with heavily stained bands of approximately 140 kd and 130 kd at 10-second exposure. (Lanes 4 and 5) Type I high-expresser platelets showing bands with similar mobilities at 5-minute exposure. (Lanes 6 and 7) Normal-expresser A1platelets.
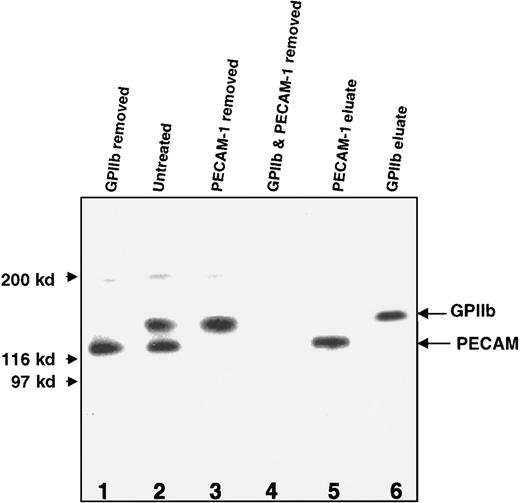
The 2 major carriers of the A antigen on platelets from 2 Type II high expressers were identified as GPIIb and PECAM. This was accomplished by showing that one of the bands was completely removed from a platelet lysate with Sepharose beads coated with anti-GPIIb mAb and that the other was removed by absorption with beads carrying anti-PECAM (Figure9).
Western blot (nonreduced) of A antigen on GPs in a lysate prepared from Type II A1 high-expresser platelets with and without absorption with mAbs MBC 132.1 and MBC 78.2.
(Lane 1) After absorption with MBC 132.1 (anti-GPIIb), the higher molecular weight band was removed. (Lane 2) Without absorption, 2 prominent bands with mobilities expected of GPIIb and PECAM were identified. (Lane 3) The lower molecular weight band was removed by absorption with MBC 78.2 (anti-PECAM). (Lane 4) Both bands were removed by combined absorption with the 2 mAbs. (Lanes 5 and 6) Recovery of the expected bands upon elution from the mAb-conjugated beads used for absorption in lanes 1 and 3. Similar results were obtained with platelets from a second Type II high expresser of A1(not shown).
Discussion
Unusually high expression of A and B antigens on platelets was found by Ogasawara et al4 in about 7% of the Japanese population who were positive for A1 or B. We defined “high expresser” as a donor whose platelet A or B antigen levels consistently exceeded the mean by plus 2 SD. Our study of 100 group A1 subjects and 100 group B Caucasian subjects led to the identification of 7 A1 (7%) and 4 B (4%) high expressers, which is similar to the reported incidence of this anomaly in the Japanese population. On the basis of histogram profiles, quantities of the A antigen carried on individual membrane GPs, serum A1-transferase levels, and statistical analysis, the high expressers of A1 were divided into 2 subgroups, designated Type I (average antigen expression about 3 times the normal expression) and Type II (average antigen expression about 7 times the normal expression). Although only 2 of 100 A1 individuals were classified as Type II, statistical analysis suggested that up to 44% of the remaining 98 individuals may belong to the Type I subgroup of high expressers. This is a higher percentage than might be estimated by visual inspection of the second peak in Figure 3. However, the standard deviation of the Type I high-expresser population was relatively large (5.81 SD vs mean of 10.2), thereby allowing for considerable overlap with the normal-expresser A1 population. Further studies are needed to define the 2 populations more precisely.
Analysis of the group B donors indicated that the Type I high expressers made up about 5% of the total. In one family, the Type II high-expresser A1 trait appeared to be inherited as an autosomal dominant trait. The inheritance pattern of the Type I trait has not yet been characterized. In preliminary studies of normal-expresser A1 platelets and Type I and Type II high-expresser A1 platelets, we compared the binding of mAbs specific for the A antigen and for the GPIIb/IIIa complex (expressed at a level of about 40 000 copies per platelet, using intact IgG as a probe).15 16 Evidence indicates the following approximate numbers of IgG binding sites on the 3 types of A1 platelets: normal expresser, 2100; Type I high expresser, 5400; and Type II high expresser, 16 000 (data not shown). Further studies using labeled monovalent probes of known specific activity are needed to define these figures more precisely.
In studies of immobilized platelet GPs from 2 Type II high expressers, we found that the A1 antigen was over-expressed on each of the 5 GPs and GP complexes studied (Figure 7). By Western blotting and immunoabsorption, GPIIb and PECAM were found to be the most prominent carriers of the A antigen in platelets of Type I and Type II high expressers (Figures 8 and 9). In Japanese high expressers of the B antigen, Ogasawara and coworkers4 concluded that GPIIb contributed most to surface expression of the antigen. Because they did not use PECAM-specific reagents and because PECAM and GPIIb have similar mobilities, some of the antigens they attributed to GPIIb may have been contributed by PECAM. In studies of the expression of A and B antigens on platelet GPs of normal-expresser A1 individuals using immunoprecipitation and Western blotting, small amounts of the A antigen have been identified on GPIb, GPIIa, GPIIb, and GPIIIa12,13; GPIV and GPV17; PECAM18; and the PI-linked GP CD109.19
We have not yet studied the extent to which glycolipids contribute to the Type I or II high-expresser phenotypes. Although earlier studies suggested that ABH antigens of platelets are derived mainly by passive transfer of glycolipids from plasma,20,21 it is now thought that the majority of platelet ABH is carried on membrane GPs,22 as is also true of RBCs.23-25Nonetheless, some ABH antigens appear to be passively acquired by platelets from plasma in the form of glycolipids.11,20Ogasawara et al4 did not find a correlation between the secretor status and the high-expresser trait in the Japanese population, suggesting that passive absorption of A and B antigens from plasma does not contribute importantly to the high-expresser phenotype. Each of the 11 high expressers we studied was a secretor of blood group antigens, but this number was too small to ascribe significance to this association.
Further studies are required to determine the mechanism(s) whereby platelet GPs of high expressers acquire larger than normal quantities of A and B antigen. A possible clue is provided by the finding that serum levels of A1- and B-transferases were relatively high in both types of high expressers, particularly Type II (Figure 5). Glycosylation reactions leading to ABH antigen synthesis are initiated in the lumen of the endoplasmic reticulum, and maturation of the carbohydrate chains continues in the Golgi.26 27 While it is possible that A1- or B-transferases found in serum contribute to platelet A or B antigen expression, there are no reports of soluble transferases having this activity in vivo. This is not surprising in light of the fact that the substrate sugars normally added in the Golgi are not likely to be available in serum. Rather, high levels of transferase in the serum of high expressers probably reflect the shedding of the enzyme that is present at abnormally high levels in developing megakaryocytes, and judging from measurements of the H antigen on RBCs (Figure 6), other hematopoietic tissues as well.
Alternatively, a mutation leading to one or more amino acid substitutions in the mature protein could lead to a gain of function, as has been described for the B transferase in persons with the B (A) red cell phenotype.28 Exons 5, 6, and 7 of the A1-transferase gene are the sites of all reported mutations leading to amino acid substitutions that affect the function of the synthesized protein.28-34 Most of these have been found in exon 7, which codes for the catalytic domain. We sequenced exon 7 of the A1-transferase gene in 4 Type II high expressers of the A antigen and also exons 5 and 6 in one of these individuals, and they were all identical to the reported normal A1 sequences. Although additional studies are needed, this finding raises the possibility that the A1-transferase gene is normal in sequence, but it is over-expressed in persons with high levels of A or B antigen on their platelets. In this regard, it will be of future interest to examine the regulatory domains of the A1- and B-transferase gene promoters and to look for possible polymorphisms in the 3′-untranslated region that might affect RNA stability.
The possible clinical significance of the high-expresser phenomenon deserves attention from several standpoints. This anomaly has potential importance in platelet transfusion therapy. Ogasawara et al4 found that platelets from group B high expressers failed to survive when transfused to a group O subject. In earlier studies, Duquesnoy and coworkers35 found that the recovery of human leukocyte antigen (HLA)–matched platelets from group A donors transfused to group O recipients was about 77% of that achieved with group O platelets transfused to the same patient population. However, recoveries varied widely from one group A donor to another.35 The recognition that platelets from A2 donors carry virtually no A antigen3 13 and that platelets from A1 donors differ widely in respect to the A antigen expression (Figure 2) provides a potential explanation for the variable behavior of group A platelets transfused to group O recipients.
Heal and her coworkers36-38 have suggested that transfusion of plasma across the ABH barrier can lead to the generation of immune complexes consisting of anti-A or anti-B bound to plasma GPs or glycolipids bearing A or B determinants. In addition, these can bind to and affect the survival of both transfused platelets and platelets of the transfusion recipient.36-38 If the high-expresser trait affects plasma GPs and/or plasma glycolipids, formation of immune complexes might be exaggerated following the transfusion of platelets (and plasma) to or from a high expresser across the ABH barrier. Whether the high-expresser phenomenon extends to plasma proteins or glycolipids therefore deserves investigation. The fact that GPIIIa, GPIa/IIa, GPIV, PECAM, and possibly GPIb are constitutively expressed in tissues other than megakaryocytes and platelets, eg, in endothelium, could also have implications for organ transplantation, especially the transplantation of bone marrow and stem cells, where ABH compatibility between donor and recipient is not routinely observed.
Studies are also indicated to determine whether the high-expresser trait, expressed in a fetus born to a woman whose plasma contains anti-A or anti-B reactive with the fetal platelets, is a risk factor for neonatal alloimmune thrombocytopenia (NATP). Our finding shows that among a group of fathers in unresolved NATP cases, 2 were Type II high expressers of A antigen. This is intriguing but inconclusive because the propositus in one case could not be typed, and the other had platelets that carried normal amounts of A1 antigen when tested at about 2 weeks of age. To our knowledge, A and B antigen expression on platelets of the newborn has never been studied. The strength of ABH antigens on RBCs of the newborn ranges between 10%23 and 30%39 of adult values, leaving open the possibility that normal levels of A1 antigen observed on platelets of the single infant evaluated were significant.
Acknowledgments
We are grateful to Drs Henrik Clausen, Thomas J. Kunicki, Peter J. Newman, and Robert R. Montgomery for their gifts of important reagents; to Dr Diana Beardsley (Yale University, New Haven, CT) for referral of one of the suspect NATP cases; and to the Document and Graphic Services Department of The Blood Center of Southeastern Wisconsin (Milwaukee, WI) for help in preparing this manuscript.
Supported by grant 95-8 from the National Blood Foundation of the American Association of Blood Banks and grant HL-13629 from the National Heart, Lung, and Blood Institute, Bethesda, MD.
Corresponding author:Brian R. Curtis, The Blood Center of Southeastern Wisconsin, 638 North 18th Street, Milwaukee, WI 53233; e-mail: brcurtis@bcsew.edu.
The publication costs of this article were defrayed in part by page charge payment. Therefore, and solely to indicate this fact, this article is hereby marked “advertisement” in accordance with 18 U.S.C. section 1734.

This feature is available to Subscribers Only
Sign In or Create an Account Close Modal