Abstract
Expression of the p45 subunit of transcription factor NF-E2 is restricted to selected blood cell lineages, including megakaryocytes and developing erythrocytes. Mice lacking p45 NF-E2 show profound thrombocytopenia, resulting from a late arrest in megakaryocyte differentiation, and a number of red blood cell defects, including anisocytosis and hypochromia. Here we report results of studies aimed to explore the pathophysiology of these abnormalities. Mice lacking NF-E2 produce very few platelet-like particles that display highly disorganized ultrastructure and respond poorly to platelet agonists, features consistent with the usually lethal hemorrhage in these animals. Thrombocytopenia was evident during fetal life and was not corrected by splenectomy in adults. Surprisingly, fetal NF-E2–deficient megakaryocyte progenitors showed reduced proliferation potential in vitro. Thus, NF-E2 is required for regulated megakaryocyte growth as well as for differentiation into platelets. All the erythroid abnormalities were reproduced in lethally irradiated wild-type recipients of hematopoietic cells derived from NF-E2-null fetuses. Whole blood from mice lacking p45 NF-E2 showed numerous small red blood cell fragments; however, survival of intact erythrocytes in vivo was indistinguishable from control mice. Considered together, these observations indicate a requirement for NF-E2 in generating normal erythrocytes. Despite impressive splenomegaly at baseline, mice lacking p45 NF-E2 survived splenectomy, which resulted in increased reticulocyte numbers. This reveals considerable erythroid reserve within extra-splenic sites of hematopoiesis and suggests a role for the spleen in clearing abnormal erythrocytes. Our findings address distinct aspects of the requirements for NF-E2 in blood cell homeostasis and establish its roles in proper differentiation of megakaryocytes and erythrocytes.
VARIOUS ASPECTS of hematopoiesis are regulated by distinct mechanisms. At the cellular level, differentiation of uncommitted or multipotential progenitors appears to depend largely on the function of transcription factors.1The acquisition and maintenance of cell-specific phenotypes is also largely under transcriptional control,2 while expansion of individual cell lineages is regulated by growth factors with overlapping specificity.3 At the level of the organism, there are additional layers of regulation whose cellular correlates are less well understood, and many questions remain about the mechanisms that operate to maintain the sizes and compositions of the different cellular compartments within hematopoietic organs. These aspects of physiology are often best studied in animal models of disease.
The basic-leucine zipper (bZip) transcription factor NF-E2 was originally identified as the protein that binds to critical enhancer elements within the β-globin locus control region (LCR). The NF-E2 heterodimer is comprised of widely expressed and heterogeneous 18- to 20-kD subunits and a hematopoietic-specific p45 subunit whose expression is restricted to erythroid cells, megakaryocytes, and mast cells.4-6 Absence of p45 NF-E2 in mice results in mild, albeit consistent, red blood cell (RBC) abnormalities, including hypochromia, anisocytosis, and reticulocytosis.7 More remarkable in these mice is the profound thrombocytopenia that results from an arrest in late megakaryocyte maturation and leads to high perinatal mortality.8 Other features of these knockout mice that may represent primary or secondary effects of the absence of NF-E2 include dramatic megakaryocytosis, splenomegaly, and altered bone marrow cellularity.7 8 These pathologic consequences of the absence of a single transcription factor raise important questions about erythrocyte, megakaryocyte, and platelet regulation and make p45 NF-E2 knockout mice an excellent model for studying blood cell homeostasis in vivo.
Here we address several pathophysiologic aspects of megakaryocyte and erythroid cell homeostasis in mice lacking NF-E2. We show that NF-E2–deficient megakaryocytic progenitors display an attenuated proliferative response to the c-Mpl ligand in vitro; this is particularly surprising in light of the megakaryocytosis observed in all hematopoietic tissues of adult p45 NF-E2−/−mice. Second, we describe ultrastructural and activation characteristics of the highly abnormal platelet-like particles produced by the defective megakaryocytes, as well as some characteristics of small RBC fragments that likely reflect defective erythropoiesis. Finally, we explore the possibility of hemolysis and the significance of splenomegaly in the knockout mice. Taken together, our findings improve the understanding of the complex hematopoietic consequences of the absence of a single lineage-restricted transcription factor, NF-E2.
MATERIALS AND METHODS
Mouse studies.
p45 NF-E2 knockout mice were generated and interbred as described previously.8 Animal health and experimental conditions were approved and maintained according to institutional guidelines at the Dana-Farber Cancer Institute, Veterans Administration Medical Center (San Francisco, CA), and University of Oklahoma Health Sciences Center.
Hematopoietic colony assays.
Methylcellulose colony assays of mouse E14.5 fetal liver cells were performed in the presence of recombinant human Tpo in MethoCult 3230 (Stem Cell Technologies, Vancouver, BC, Canada), as described previously.9,10 For cell counts, 100 colonies were harvested individually under microscopic observation, pooled, cytocentrifuged onto glass slides, and stained with May-Grünwald-Giemsa stain; the cells were then counted manually. Soft-agar cultures of spleen and bone marrow cells were established as described previously,11 with the following modifications: 20% horse serum was used instead of fetal calf serum and the concentration of pokeweed mitogen spleen cell conditioned medium in the culture was 10%.
Reverse transcription polymerase chain reaction (RT-PCR).
RT-PCR was performed as described previously.8 Total RNA isolated from cultured cells was reverse transcribed with oligo(dT) primers and used as the template for PCR reactions using previously reported primer pairs to detect c-Mpl and hypoxanthine phosphoribosyl transferase (HPRT) transcripts. Trace α-[32P]dCTP was included in the reactions for detection of the amplified products. For these experiments, megakaryocytes were either cultured in suspension as described previously12 and purified by 2 passages over a 1-step albumin gradient, exactly as described previously,13or megakaryocyte colonies were picked individually under an inverted bright-field microscope and 50 to 200 colonies were pooled for RNA isolation.
Splenectomy, blood cell counts, and RBC survival studies.
Splenectomy was performed under general anesthesia with methoxyflurane vapor (Pitman-Moore, Mundelein, IL). Blood samples were obtained from the retroorbital venous plexus using EDTA-coated glass capillary tubes (Drummond Scientific Co, Broomall, PA). Platelets were counted as described previously,14 with an electronic particle counter (Model ZH; Coulter Electronics, Hialeah, FL), hematocrits were determined by centrifugation of double oxalate microcapillary tubes (Drummond Scientific Co), and total white blood cells were counted using an electronic particle counter (Model ZBI; Coulter Electronics). Reticulocytes were counted either manually on smears of cells stained with New Methylene Blue (1,000 cells/slide) or by flow cytometry after staining with thiazole orange (10,000 events), using a FACScan (Becton Dickinson, San Jose, CA).
RBC volume and hemoglobin content were measured and plotted using a Technicon H1 instrument (Technicon Instruments, Tarrytown, CA) and software designed to study blood from laboratory animals. Mouse fetal blood was harvested by cardiac puncture using EDTA-coated glass capillary tubes, diluted in Unopette buffer (Becton Dickinson, Franklin Lakes, NJ), and platelet counts determined by manual counting under phase contrast microscopy.
RBC survival was measured by a modification of the recently described technique for murine platelet survival using the fluorochrome 5-chloro-methylfluorescein diacetate (CMFDA), which labels cells internally.15 Briefly, donor blood was obtained by cardiac puncture and platelet-rich plasma (PRP) was generated and removed. RBCs were then pelleted by centrifugation at 1,300g for 10 minutes, resuspended (5 × 10⁵/μL) in buffered saline glucose citrate (BSGC; 1.6 mmol/L KH2PO4, 8.6 mmol/L Na2HPO4, 0.12 mol/L NaCl, 0.9 mmol/L Na2EDTA, 13.6 mmol/L Na citrate, 11.1 mmol/L glucose, pH 7.3), and incubated in 7.5 to 9 μmol/L CMFDA for 45 minutes in the dark at room temperature. After pelleting the cells, 1 to 2 × 10⁹ RBCs were injected intravenously into recipient mice. Blood samples were obtained from these animals at various times up to 30 days and analyzed by flow cytometry for the percentage of labeled RBCs. RBC survival curves were constructed by plotting the circulating labeled cells as a percent of the initial number of circulating RBCs at 2 hours.
Flow cytometric analysis of platelet activation.
0.1 mL blood was obtained from the retroorbital venous plexus as above, expelled into 1 mL BSGC, and centrifuged at 100g for 5 minutes. PRP was removed and the platelets were pelleted by centrifugation at 800g for 15 minutes. After resuspension in 200 μL BSGC, 100 μL of the platelets was added to a tube containing 850 μL BSGC, 4 μg fluorescein isothiocyanate (FITC)-conjugated monoclonal antibody (MoAb) RB40 (rat anti-mouse P-selectin; Pharmingen, San Diego, CA) and 4 μg biotin-conjugated 2D5 (an MoAb made by J.-P.P. and S.A.B. that reacts only with platelets in mouse blood, as verified by comparison with the platelet-specific MoAb 4A5,16 and recognizes fixed cells). Next, 50 μL of bovine thrombin (Sigma Chemicals, St Louis, MO; 5 U/mL), phorbol myristate acetate (Sigma; 2 × 10⁻⁶ mol/L), or BSGC was added to each tube and the platelets incubated at 37°C for 10 minutes. The reaction was stopped and platelets fixed by addition of 1 mL 0.6% formaldehyde at room temperature for 20 minutes. Cells were washed in BSGC containing 0.1% bovine serum albumin (BSA) (BSGC-BSA), incubated in 0.2 mL BSGC-BSA containing 3 μL streptavidin-Tricolor (Caltag Laboratories, Burlingame, CA) for 20 minutes at room temp, washed again in BSGC-BSA, and resuspended in 0.5 mL BSGC-BSA before performance of flow cytometry to assess P-selectin expression on 2D5-stained cells. In some experiments (see Fig 4A), 2D5 was directly conjugated with FITC and used to identify mouse platelets. Fluorescent-tagged monoclonal antibodies directed against the platelet antigen CD41 and the erythrocyte antigen TER-119 (see Fig 5A) were purchased from Pharmingen (San Diego, CA).
For fibrinogen binding studies, 0.5 mL blood was withdrawn by cardiac puncture into a syringe containing 0.1 mL 3.8% sodium citrate, mixed with an equal volume of HEPES-buffered saline (HBS), and centrifuged at 100g for 6 minutes. Two hundred microliters of the PRP was added to 800 μL of HBS containing 0.5 U/mL of bovine thrombin or buffer and incubated at room temperature for 45 seconds, followed by fixation in 4 mL 0.3% formaldehyde for 20 minutes and washing in BSGC-BSA supplemented with 2 mmol/L EDTA. The platelets were incubated sequentially for 20 minutes at ambient temp in BSGC-BSA containing 4 μg 2D5-biotin and 4 μL FITC-conjugated goat anti-mouse fibrinogen (Nordic Immunology, Tilburg, The Netherlands) and BSGC-BSA containing 3 μL streptavidin-Tricolor. After washing, cells were reuspended in 0.4 mL BSGC-BSA and flow cytometry was used to assess fibrinogen binding on 2D5+ cells.
Electron microscopy.
Electron microscopy of the cellular fraction from PRP was performed according to a modification of the procedure of Stenberg et al.17 Briefly, whole blood was collected by cardiac puncture directly into syringes containing an excess of 1.5% glutaraldehyde in 0.01 mol/L cocadylate buffer, pH 7.4, fixed overnight at 4°C, and centrifuged as above to obtain PRP. The subsequently prepared pellet was dehydrated through an ascending series of alcohols, infiltrated with propylene oxide, and embedded in Epoxy resin. Ultrathin sections were cut with an MT6000 microtome (Du Pont Company, Newtown, CT), stained with uranyl acetate and lead citrate, and examined with a JEOL 100CX-II transmission electron microscope (JEOL, Peabody, MA) at an accelerating voltage of 60 kV.
Fetal liver transplantation.
This was performed as described previously.18 Briefly, livers recovered from the fetuses of p45 NF-E2+/−matings on postcoital day 14 were disaggregated into single cells and cultured overnight pending determination of the p45 NF-E2 genotype of each fetus. The next day, 2 groups of 6 adult 129/SvJ adult females were treated with 1,000 cGy whole-body irradiation and then injected intravenously with 6 to 8 × 10⁶ fetal liver cells derived from p45 NF-E2+/− or p45 NF-E2−/− donor fetuses. One recipient from the test group and 2 mice from the control group showed either endogenous or chimeric reconstitution at 3 to 5 weeks, indicating sublethal irradiation; analysis was restricted to the majority of mice with complete marrow reconstitution by donor cells. Spleen size and RBC parameters were determined at sacrifice 5 weeks posttransplantation.
RESULTS
Megakaryocyte growth defect in the absence of NF-E2.
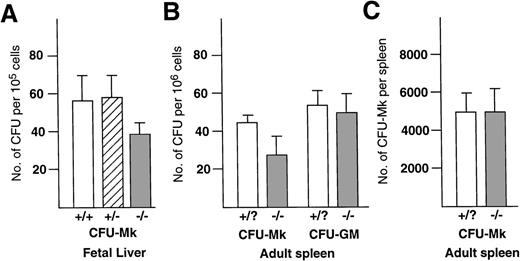
Mice lacking NF-E2 function have greatly increased numbers of megakaryocytes.8 Remarkably, circulating levels of the c-Mpl ligand are much lower than predicted for the degree of thrombocytopenia in these animals, potentially because of clearance of the growth factor by the excess megakaryocytes.19 These observations raise the question of whether the megakaryocytosis is a secondary effect of thrombocytopenia or a primary consequence of NF-E2 deficiency manifested at the level of progenitor cells. Therefore, we performed megakaryocyte colony assays in semisolid medium with cells derived from the hematopoietic organs of the mutant animals. Compared with wild-type or heterozygous littermates, the frequency of megakaryocyte colony-forming units (CFU-Mk) was consistently lower in the NF-E2-null fetal livers (Fig 1A) and adult spleens (Fig 1B). Interestingly, the total number of CFU-Mk derived from the spleens of knockout mice was the same as from controls (Fig 1C), reflecting the splenomegaly in these animals. Unexpectedly, no CFU-Mk were detected in bone marrow specimens from 5 p45 NF-E2−/− mice; this was associated with levels of CFU-GM that were only 25% of normal (data not shown). Cellularity was markedly reduced in these bone marrows, from which it is routinely difficult to obtain cells for culture; nevertheless, it seems unlikely that this difficulty alone would have resulted in a total loss of CFU-Mk.
Number of CFU-Mk in the hematopoietic tissues of p45 NF-E2 mutant and control mice. Cells isolated from the fetal liver (A) or adult spleen (B and C) of wild-type (+/+), heterozygote (+/−), and p45 NF-E2 mutant homozygote (−/−) mice were cultured as described, and CFU-Mk were scored at 7 days. N = 7 and 8 for control and knockout spleens; 21 and 13 for control and knockout fetal livers, respectively. Data are presented as the number of colonies per 105 (A) or 106 cells (B) or total number of colonies per spleen (C). The modest reduction in CFU-Mk in p45 NF-E2−/− cultures shown in (A) and (B) were statistically significant, with P = .002 andP < .001, respectively; all other comparisons failed to achieve statistical significance using the Student’s t-test. In experiments for which a distinction was not made between +/+ and +/− (nonmutant) mice, these genotypes are collectively designated as +/?.
Number of CFU-Mk in the hematopoietic tissues of p45 NF-E2 mutant and control mice. Cells isolated from the fetal liver (A) or adult spleen (B and C) of wild-type (+/+), heterozygote (+/−), and p45 NF-E2 mutant homozygote (−/−) mice were cultured as described, and CFU-Mk were scored at 7 days. N = 7 and 8 for control and knockout spleens; 21 and 13 for control and knockout fetal livers, respectively. Data are presented as the number of colonies per 105 (A) or 106 cells (B) or total number of colonies per spleen (C). The modest reduction in CFU-Mk in p45 NF-E2−/− cultures shown in (A) and (B) were statistically significant, with P = .002 andP < .001, respectively; all other comparisons failed to achieve statistical significance using the Student’s t-test. In experiments for which a distinction was not made between +/+ and +/− (nonmutant) mice, these genotypes are collectively designated as +/?.
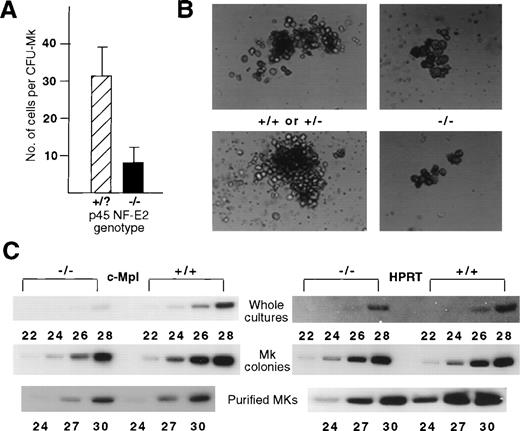
The number of cells within individual colonies derived from CFU-Mk was always lower in the mutant fetal liver cultures (Fig 2A). Consistent with the ≈75% reduction in average colony size (P = .003), the total number of megakaryocytes in liquid cultures of bone marrows or whole fetal livers from the mutant mice was also correspondingly reduced compared with littermate controls (data not shown). Furthermore, the cultured NF-E2–deficient megakaryocytes were larger than normal (Fig 2B), similar to observations in vivo.8 The kinetics of colony formation and death were identical in the knockout and control megakaryocyte cultures.
Reduced number of cells per CFU-Mk in the absence of NF-E2 function. (A) Quantification of mean number of cells per CFU-Mk based on counting cells from 100 colonies derived from control (+/+ or +/−, designated as +/?, N = 10) and mutant (−/−, N = 5) fetal livers. Statistical significance was established using the Student’s t-test, P = .003. (B) Bright-field photomicrographs of representative individual megakaryocyte colonies at day 7 from control (left) and mutant (right) fetal livers (original magnification × 200). (C) RT-PCR analysis for c-Mpl (left) and control (hypoxanthine phosphoribosyl transferase, HPRT, right) mRNA levels in wild-type (+/+) and NF-E2–deficient (−/−) megakaryocytes. Numbers refer to PCR cycles.
Reduced number of cells per CFU-Mk in the absence of NF-E2 function. (A) Quantification of mean number of cells per CFU-Mk based on counting cells from 100 colonies derived from control (+/+ or +/−, designated as +/?, N = 10) and mutant (−/−, N = 5) fetal livers. Statistical significance was established using the Student’s t-test, P = .003. (B) Bright-field photomicrographs of representative individual megakaryocyte colonies at day 7 from control (left) and mutant (right) fetal livers (original magnification × 200). (C) RT-PCR analysis for c-Mpl (left) and control (hypoxanthine phosphoribosyl transferase, HPRT, right) mRNA levels in wild-type (+/+) and NF-E2–deficient (−/−) megakaryocytes. Numbers refer to PCR cycles.
These findings suggest that absence of NF-E2 function is associated with decreased proliferation by the progeny of individual megakaryocyte progenitors (CFU-Mk). We used semi-quantitative RT-PCR to explore the possibility that this results from decreased expression of the c-Mpl receptor. Although c-Mpl mRNA is distinctly underrepresented in whole cultures of p45 NF-E2−/− fetal liver cells in Tpo (Fig 2C), this simply reflects reduced numbers of megakaryocytes. Indeed, c-Mpl mRNA levels are virtually identical in wild-type and p45 NF-E2−/− megakaryocytes purified from bulk liquid cultures or from colonies cultured in methylcellulose (Fig 2C). Unless c-Mpl protein levels vary between normal and NF-E2–deficient megakaryocytes, this observation suggests that the attenuated proliferation of p45 NF-E2−/− megakaryocytes in vitro results from post-receptor signaling defects.
Nature of platelet-like particles produced by NF-E2–deficient megakaryocytes.
Although we have observed platelet-size particles very rarely on peripheral blood smears from p45 NF-E2−/−mice,8 automated blood cell analysis consistently detects a signal in the platelet window and reports platelet counts of 4 to 8 × 10⁴/μL. Using an accurate electronic particle counter or by manual platelet counting under phase microscopy, the knockout mice displayed platelet counts of 1 to 4 × 10⁴/μL, compared with 0.9 to 1.3 × 10⁶/μL in littermate controls. To assess the nature of the particles that are recognized as platelets, we analyzed the platelet-rich plasma by electron microscopy.
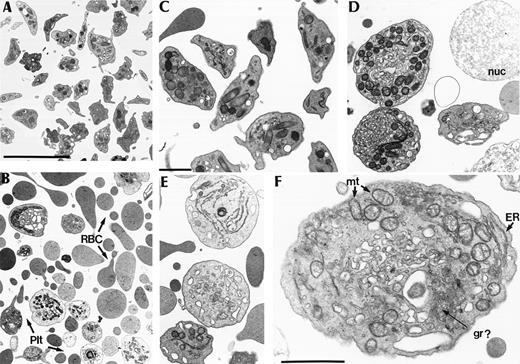
Control samples showed a large number of well-preserved platelets with the normal discoid shape in a majority of the cells and the normal complement of organelles (Fig 3A and C). In contrast, p45 NF-E2 knockout samples were markedly hypocellular and mostly contained abnormal RBC fragments, with many fewer particles resembling platelets (Fig 3B); other microscopic fields were dominated by naked nuclear fragments whose frequently large size suggested a megakaryocyte origin (eg, Fig 3D). The platelet-like particles were large, round, and heterogeneous (Fig 3D through F), with highly disorganized packaging of organelles, including endoplasmic reticulum and extensive profiles of dense tubular system. Granules were rare and usually not electron-dense. This ultrastructural appearance thus resembles the cytoplasm of NF-E2–null megakaryocytes and is consistent with release of intrinsically abnormal platelets or megakaryocyte fragments.
Ultrastructural analysis of particles found in the plasma of p45 NF-E2–deficient adult mice. (A and B) Low-power images of cells in the platelet-rich plasma fraction, showing normal appearance of platelets in control samples (A) but a predominance of RBC fragments (RBC) and fewer, bizarre platelet forms (Plt) in mutant samples (B); bar = 5 μm. (C through E) Higher magnification images of platelets and platelet-like fragments, comparing the normal platelet appearance in controls (C) with large, round, heterogeneous and abnormally organized fragments in p45 NF-E2 knockout mice (D and E). nuc, naked nucleus; bar = 1 μm. (F) High-power view of a representative NF-E2–deficient platelet-like particle, revealing disorganized and abnormal contents, including excess mitochondria (mt) and endoplasmic reticulum (ER), a dense tubular system, and possibly rare abnormal granules (gr?); bar = 1 μm.
Ultrastructural analysis of particles found in the plasma of p45 NF-E2–deficient adult mice. (A and B) Low-power images of cells in the platelet-rich plasma fraction, showing normal appearance of platelets in control samples (A) but a predominance of RBC fragments (RBC) and fewer, bizarre platelet forms (Plt) in mutant samples (B); bar = 5 μm. (C through E) Higher magnification images of platelets and platelet-like fragments, comparing the normal platelet appearance in controls (C) with large, round, heterogeneous and abnormally organized fragments in p45 NF-E2 knockout mice (D and E). nuc, naked nucleus; bar = 1 μm. (F) High-power view of a representative NF-E2–deficient platelet-like particle, revealing disorganized and abnormal contents, including excess mitochondria (mt) and endoplasmic reticulum (ER), a dense tubular system, and possibly rare abnormal granules (gr?); bar = 1 μm.
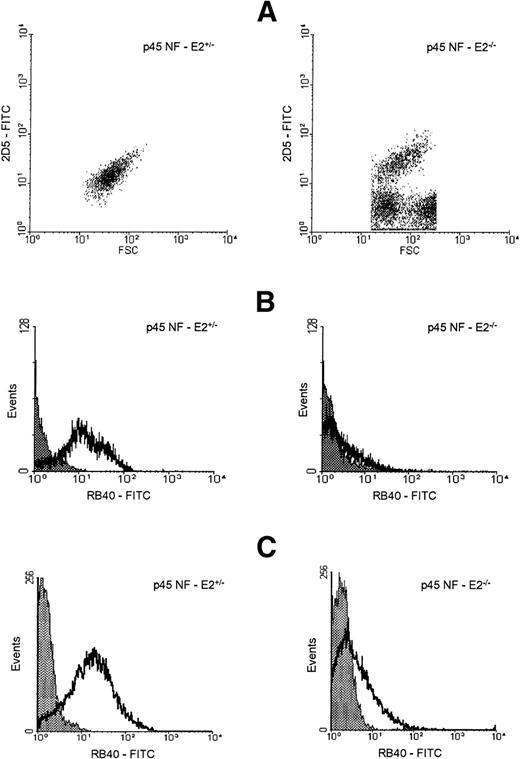
To further characterize the particles recognized as platelets, we studied marker expression and platelet activation using flow cytometry. Staining with 2 mouse platelet-specific monoclonal antibodies, 2D5 (Fig 4A) and 4A5 (data not shown), showed a 2- to 3-fold increase in staining intensity in the mutant cells, consistent with their larger size. These studies also revealed a subpopulation of heterogeneous particles whose size overlaps partially with that of platelets and which do not react with platelet-specific antibodies (Fig 4A); this presumably represents the RBC fragments also seen by electron microscopy. Whereas ≈90% of control platelets responded to stimulation with 0.5 U/mL thrombin by expressing the activation marker P-selectin, less than 25% of NF-E2 knockout “platelets” did so (Table 1), and with a much lower signal (Fig 4B). Thrombin stimulation also resulted in significantly reduced magnitude and fraction of particles showing fibrinogen binding, an independent measure of platelet activation (Table 1). In contrast, thrombin elicited normal activation profiles in platelets derived from the thrombocytopenic mice that lack c-Mpl (Table1); these platelets are known to be normal in other respects.20 Independently, 2D5+ cells derived from mice lacking p45 NF-E2 showed a very weak response to stimulation by phorbol myristate acetate (Fig 4C and Table 1). Thus, the platelet-like fragments that circulate in NF-E2−/− mice are poorly stimulated by platelet agonists in vitro; this is consistent with the severe, usually fatal hemorrhage observed in neonatal knockout mice.8
Characteristics of platelet-like particles in NF-E2–deficient mice. (A) Forward scatter (FSC) plot of control (p45 NF-E2+/−, left) and p45 NF-E2−/−(right) platelets, as defined by fluorescent staining with 2D5 (shown as 2D5-FITC on the ordinate). Control samples showed the same forward scatter characteristics (FSC, an estimate of cell size) as wild-type mouse platelets, whereas p45 NF-E2−/− samples included heterogeneous subpopulations of particles exhibiting similar scatter characteristics to platelets, as well as particles that failed to bind 2D5. (B and C) Representative flow cytometry histograms of platelets (2D5+ cells) reacting with the anti–P-selectin antibody RB40. The majority of 2D5+ particles from NF-E2–null mice do not express P-selectin after stimulation with bovine thrombin (B) or phorbol myristate acetate (PMA; C). The shaded curves represent staining of unstimulated cells (background) while the clear curves show P-selectin expression after stimulation with thrombin (B) or PMA (C). All events were gated on 2D5 positivity, the data are representative of 7 (B) and 4 (C) similar experiments, respectively, and the numbers are presented in greater detail in Table 1.
Characteristics of platelet-like particles in NF-E2–deficient mice. (A) Forward scatter (FSC) plot of control (p45 NF-E2+/−, left) and p45 NF-E2−/−(right) platelets, as defined by fluorescent staining with 2D5 (shown as 2D5-FITC on the ordinate). Control samples showed the same forward scatter characteristics (FSC, an estimate of cell size) as wild-type mouse platelets, whereas p45 NF-E2−/− samples included heterogeneous subpopulations of particles exhibiting similar scatter characteristics to platelets, as well as particles that failed to bind 2D5. (B and C) Representative flow cytometry histograms of platelets (2D5+ cells) reacting with the anti–P-selectin antibody RB40. The majority of 2D5+ particles from NF-E2–null mice do not express P-selectin after stimulation with bovine thrombin (B) or phorbol myristate acetate (PMA; C). The shaded curves represent staining of unstimulated cells (background) while the clear curves show P-selectin expression after stimulation with thrombin (B) or PMA (C). All events were gated on 2D5 positivity, the data are representative of 7 (B) and 4 (C) similar experiments, respectively, and the numbers are presented in greater detail in Table 1.
Activation Characteristics of Platelets Produced in the Absence of NF-E2
| . | Stimulus . | P-Selectin Expression (%) . | Fibrinogen Binding (%) . |
|---|---|---|---|
| Thrombin | |||
| NF-E2+/− | − | 2.4 ± 0.5 (N = 3) | 1.7 ± 1.1 (N = 4) |
| + | 87.8 ± 6.8 (N = 7) | 57.5 ± 8.9 (N = 4) | |
| NF-E2−/− | − | 2.9 ± 0.7 (N = 7) | 5.8 ± 1.9 (N = 4) |
| + | 19.5 ± 4.5 (N = 7) | 24.1 ± 4.4 (N = 4) | |
| c-Mpl−/− | − | 1.8 ± 1.2 (N = 2) | ND |
| + | 87.2 ± 1.6 (N = 2) | ND | |
| PMA | |||
| NF-E2+/− | − | 3.4 ± 1.7 (N = 3) | ND |
| + | 83.1 ± 2.1 (N = 3) | ND | |
| NF-E2−/− | − | 4.2 ± 0.4 (N = 3) | ND |
| + | 39.1 ± 4.1 (N = 3) | ND |
Platelets obtained from mice were activated with thrombin (0.5 U/mL) or with phorbol myristate acetate (PMA; 10−7mol/L), and the fraction (%) expressing P-selectin or binding antifibrinogen antibody were determined by flow cytometry, as described in Materials and Methods. The mean ± SEM is shown. The data represent only those platelets or platelet-like particles that bind 2D5, an MoAb that exclusively identifies platelets in normal mouse blood.
Abbreviation: ND, not determined.
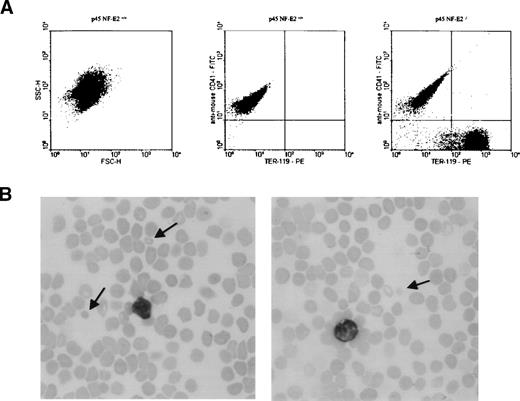
Finally, we performed experiments to establish that the cell fraction recognized as platelets is indeed significantly contaminated by small RBC fragments, as suggested by the ultrastructural studies (Fig 3B). Over half the cells with light scatter characteristics of platelets reacted strongly with the anti-RBC MoAb TER-119 and not with an antibody directed against the platelet antigen CD41 (Fig 5A). Consistent with these observations, small RBCs and RBC fragments were readily detected in peripheral blood smears from p45 NF-E2 knockout mice, as illustrated in Fig 5B.
Simultaneous flow cytometric analysis of RBCs and platelets in the washed platelet-rich plasma of p45 NF-E2−/− mice, showing substantial contamination of platelet-sized cells by RBC fragments. (A) Left panel: Forward (FSC-H) and side (SSC-H) scatter characteristics of the platelet population in wild-type mice. In the analysis of wild-type mice (center panel), only platelets (CD41-positive cells) were observed using the scatter characteristics shown in (A). In samples from p45 NF-E2 knockout mice (right panel), a subtantial population of RBC fragments (TER-119–positive) was present, comprising 56% of total events in this analysis of platelet-sized particles. Results were identical in 2 independent experiments. (B) Representative blood smears from adult p45 NF-E2 knockout mice, showing the presence of small RBC fragments (arrows) and absence of blood platelets.
Simultaneous flow cytometric analysis of RBCs and platelets in the washed platelet-rich plasma of p45 NF-E2−/− mice, showing substantial contamination of platelet-sized cells by RBC fragments. (A) Left panel: Forward (FSC-H) and side (SSC-H) scatter characteristics of the platelet population in wild-type mice. In the analysis of wild-type mice (center panel), only platelets (CD41-positive cells) were observed using the scatter characteristics shown in (A). In samples from p45 NF-E2 knockout mice (right panel), a subtantial population of RBC fragments (TER-119–positive) was present, comprising 56% of total events in this analysis of platelet-sized particles. Results were identical in 2 independent experiments. (B) Representative blood smears from adult p45 NF-E2 knockout mice, showing the presence of small RBC fragments (arrows) and absence of blood platelets.
Effects of splenectomy in NF-E2 knockout mice.
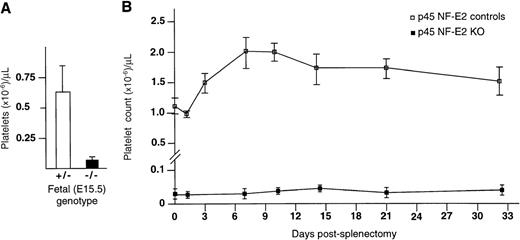
When radioiodinated Tpo is administered to p45 NF-E2−/− mice, it binds to intact megakaryocytes in the spleen and bone marrow as well as to macrophage-associated platelet-size particles in the spleen.19 The identification of these particles in the spleen, and also in the circulation (Figs 3 and 4), raises the possibility that NF-E2−/− megakaryocytes generate abnormal platelets that are rapidly cleared by splenic macrophages; thus, thrombocytopenia might result from some combination of defective platelet production and cellular destruction. Therefore, we performed manual platelet counts on fetal mice before functional maturity of the spleen. At embryonic day 15, when the spleen is not yet populated by hematopoietic cells,21 profound thrombocytopenia was already evident in p45 NF-E2–deficient fetuses (Fig 6A).
Role of the spleen in production of thrombocytopenia in p45 NF-E2 knockout mice. (A) Platelet counts from p45 NF-E2 heterozygote (+/−; N = 17) and homozygous mutant (−/−; N = 6) fetuses at embryonic day 15, before functional development of the spleen. Platelet counts, performed manually, likely reflect some dilution of blood samples by tissue fluid. Statistical significance was established using the Student’s t-test (P < .001). (B) Serial platelet counts from p45 NF-E2 knockout (KO; N = 4) and littermate control adult (N = 8) mice before and after splenectomy. Although platelet counts were obtained for up to 50 days after splenectomy, results are shown only for the initial 32 days, after which no significant changes were noted.
Role of the spleen in production of thrombocytopenia in p45 NF-E2 knockout mice. (A) Platelet counts from p45 NF-E2 heterozygote (+/−; N = 17) and homozygous mutant (−/−; N = 6) fetuses at embryonic day 15, before functional development of the spleen. Platelet counts, performed manually, likely reflect some dilution of blood samples by tissue fluid. Statistical significance was established using the Student’s t-test (P < .001). (B) Serial platelet counts from p45 NF-E2 knockout (KO; N = 4) and littermate control adult (N = 8) mice before and after splenectomy. Although platelet counts were obtained for up to 50 days after splenectomy, results are shown only for the initial 32 days, after which no significant changes were noted.
We also performed splenectomies on p45 NF-E2−/−and control adult mice. As expected, postsplenectomy thrombocytosis in littermate controls was followed by stabilization of platelet counts near the baseline (Fig 6B). Although some p45 NF-E2−/− mice succumbed to postsurgical hemorrhage, serial platelet counts from 4 survivors confirmed that splenectomy failed to increase platelet numbers, even up to 50 days after surgery (Fig 6B). Thus, despite marked splenomegaly, splenic consumption does not contribute significantly to the thrombocytopenia in p45 NF-E2 knockout mice; rather, the low platelet numbers reflect deficient and defective production by abnormal megakaryocytes. Total leukocyte counts were normal in the mutant mice and did not change significantly following splenectomy.
We have previously shown that circulating Tpo levels are paradoxically low in young and adult thrombocytopenic NF-E2 knockout mice.19 Although a newer, more sensitive assay suggests that serum Tpo levels are slightly higher than previously appreciated, they are still disproportionately low for the degree of thrombocytopenia. Pertinently, we did not observe any difference between serum Tpo levels in the knockout mice before and after splenectomy (data not shown).
Erythroid cell homeostasis in the absence of NF-E2.
Several additional aspects of the hematologic phenotype of p45 NF-E2–deficient mice are noteworthy, including splenomegaly, hypochromic anemia, and reticulocytosis.7 One potentially unifying explanation for these findings is chronic hemolysis, which might in turn reflect a requirement for NF-E2 in regulation of genes that maintain RBC integrity. Indeed, the numerous small RBC fragments seen in the platelet fraction of whole blood (Figs 3 and 5) are consistent with this possibility. Alternative explanations for these observations include defective erythropoiesis and secondary effects of chronic blood loss from hemorrhage. We used a combination of experimental approaches to address these aspects of the p45 NF-E2 knockout phenotype.
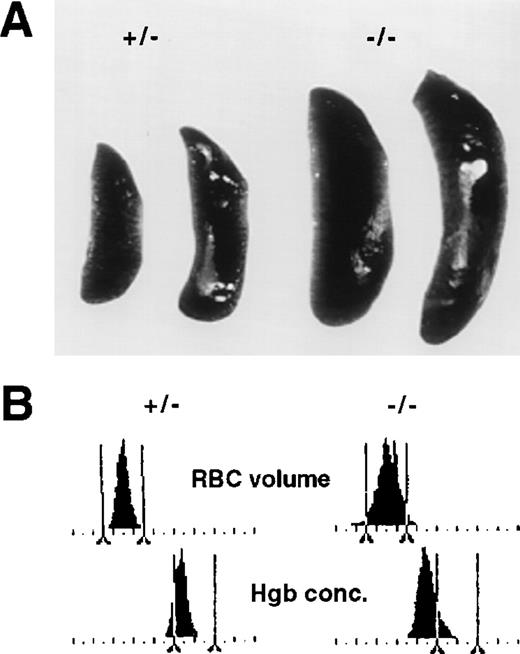
Lethally irradiated wild-type mice that are rescued by hematopoietic cells derived from p45 NF-E2–/– fetal livers show the same degree of thrombocytopenia and megakaryocytosis as adult knockout mice.18 These recipients also demonstrated marked splenomegaly within 5 weeks of transplantation (Fig 7A) and displayed the same magnitude and spectrum of RBC abnormalities (Fig 7B) as adult knockout mice.7 These defects developed uniformly, whereas hemorrhage presumably occurred to a varying degree over the brief period of observation, if at all. This suggests that they represent primary consequences of NF-E2 deficiency in developing RBCs rather than secondary effects of blood loss.
Transfer of the erythroid phenotype of p45 NF-E2 knockout mice after fetal liver transplantation from mutant mice into lethally irradiated wild-type recipients. (A) Comparison of spleen size in representative recipients transplanted with cells derived from control (left two) or p45 NF-E2−/− (right two) fetal livers. (B) Histograms of RBC volume (top panel; 0 to 180 fL on the abscissa) and hemoglobin (Hgb) concentration (bottom panel; 0 to 45 g/dL on the abscissa) in 2 recipients transplanted with fetal liver cells from p45 NF-E2+/− (left) or p45 NF-E2−/− (right) mice; the results are representative of independent analysis of 5 adult recipients each of fetal liver cells from control and knockout mice. Vertical bars delineate approximate normal boundaries for common strains of laboratory mice.
Transfer of the erythroid phenotype of p45 NF-E2 knockout mice after fetal liver transplantation from mutant mice into lethally irradiated wild-type recipients. (A) Comparison of spleen size in representative recipients transplanted with cells derived from control (left two) or p45 NF-E2−/− (right two) fetal livers. (B) Histograms of RBC volume (top panel; 0 to 180 fL on the abscissa) and hemoglobin (Hgb) concentration (bottom panel; 0 to 45 g/dL on the abscissa) in 2 recipients transplanted with fetal liver cells from p45 NF-E2+/− (left) or p45 NF-E2−/− (right) mice; the results are representative of independent analysis of 5 adult recipients each of fetal liver cells from control and knockout mice. Vertical bars delineate approximate normal boundaries for common strains of laboratory mice.
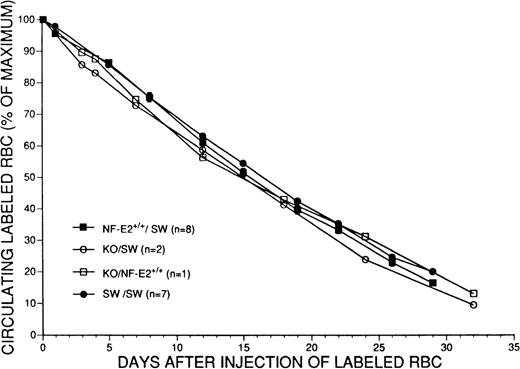
If chronic hemolysis is a significant aspect of the phenotype in the absence of NF-E2 function, this should be reflected in decreased survival of mature RBCs in vivo. To examine this possibility, we fluorescently labeled RBCs isolated from knockout or control adult mice ex vivo and followed the fate of these cells after injection into recipient mice. Remarkably, RBCs isolated from p45 NF-E2−/− mice displayed exactly the same survival in vivo as cells isolated from littermate controls or wild-type Swiss Webster mice (Fig 8), with a calculated survival time of 31 days for p45−/− cells compared to 32 days for control RBCs. Furthermore, the concentrations of total (0.2 ± 0.05 mg/dL; N = 5) and unconjugated (0.1 mg/dL) bilirubin in the plasma of p45 NF-E2−/− mice and normal adult littermates were indistinguishable. Taken together, these results argue against significant hemolysis in the absence of NF-E2 function and suggest that the small RBCs and RBC fragments seen in vivo (Figs 3 and 4) reflect defective erythropoiesis.
Comparison of survival of donor RBCs derived from littermate control (NF-E2+/+), knockout (KO) or wild-type Swiss Webster (SW) adult mice, labeled with fluorochrome, and measured for approximately 1 month after intravenous administration into recipient SW or NF-E2+/+ mice. Data are expressed as the percentage of labeled cells detected at various time points relative to the maximum number of cells detected 2 hours after injection.
Comparison of survival of donor RBCs derived from littermate control (NF-E2+/+), knockout (KO) or wild-type Swiss Webster (SW) adult mice, labeled with fluorochrome, and measured for approximately 1 month after intravenous administration into recipient SW or NF-E2+/+ mice. Data are expressed as the percentage of labeled cells detected at various time points relative to the maximum number of cells detected 2 hours after injection.
Consequences of splenectomy on erythropoiesis.
It is likely that the cells labeled ex vivo for the RBC survival studies were derived from a relatively normal subset of circulating erythrocytes and excluded the smaller RBC fragments seen in the platelet fraction of whole blood from the knockout mice. These fragments are likely cleared efficiently by the spleen, which may also contribute to splenomegaly in these animals. Alternatively, the splenomegaly may reflect vigorous compensatory hematopoiesis in animals faced with defective erythropoiesis, severe thrombocytopenia, and chronic hemorrhage. We have previously noted that splenomegaly is evident at or soon after birth of the mutant animals.7 In the current studies, we observed an inverse correlation between the weight of the spleen, determined at splenectomy, and the preoperative hematocrit in p45 NF-E2−/− mice (Table 2; r = −.841,P = .036). Correspondingly, the presplenectomy reticulocyte count tended to be proportional to the spleen weight (r = .522,P = .184). These results suggest that vigorous splenic erythropoiesis may contribute to the splenomegaly and raise the possibility that NF-E2–null mice depend on the spleen for adequate erythropoiesis.
Relationship Between Spleen Size and Hematocrit and Reticulocyte Values in Mice Lacking NF-E2
| Animal (No.) . | Spleen Weight (mg) . | Presplenectomy HCT (%) . | Presplenectomy RETIC (%) . |
|---|---|---|---|
| 53 | 256.4 | 49 | 6.0 |
| 21 | 262.9 | 45 | 5.0 |
| 8 | 295.2 | ND | 12.8 |
| 1 | 362.2 | ND | 10.0 |
| 12 | 383.5 | 43 | 24.7 |
| 6 | 392.3 | 43 | 16.4 |
| 58 | 399.7 | 40 | 7.6 |
| 19 | 423.0 | 35 | 12.7 |
Before splenectomy, blood was drawn from NF-E2 knockout mice for hematocrit (HCT) and reticulocyte (RETIC) determinations. The spleens were weighed after removal. Spleen weight in normal controls averaged 113 mg. Regression co-efficients, calculated using the Pearson product moment correlation, were −.841 (P = .036) between spleen weight and HCT and .522 (P = .184) between spleen weight and RETIC.
Abbreviation: ND, not determined.
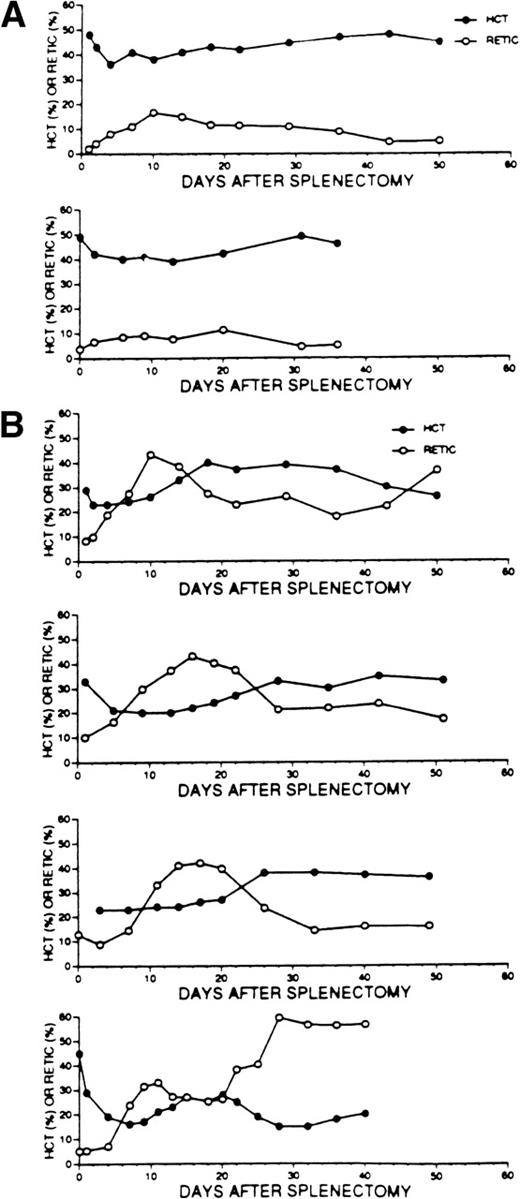
Consequently, we were surprised to observe that splenectomy was followed by a dramatic increase in reticulocyte numbers in the knockout mice (Fig 9B), compared with only modest reticulocytosis in littermate controls (Fig 9A), and stabilization of the hematocrit in most animals in either case. In 3 of 4 p45 NF-E2−/− survivors of splenectomy, the reticulocyte counts approached or exceeded 20%, despite relatively stable hematocrits of approximately 40%. Notably, we failed to observe evidence for surgical or other hemorrhage in these 4 mice during or at the termination of these experiments, indicating that this was not a significant stimulus for accelerated erythropoiesis. These observations lead to 2 conclusions. First, mice lacking NF-E2 harbor some stimulus for persistently accelerated erythropoiesis (besides hemorrhage) that is most dramatically revealed after removal of the spleen; the nature of this stimulus is presently unknown. Second, mice lacking NF-E2 can sustain profound reticulocytosis (exceeding 50% of total RBCs) in the absence of a spleen, indicating that the bone marrow or some other source harbors considerable erythroid reserve; small subcutaneous masses occasionally observed at necropsy might possibly represent sites of extramedullary hematopoiesis.
Consequence of splenectomy on the hematocrit (HCT) and reticulocyte counts (RETIC) of 2 representative control (A) and 4 p45 NF-E2 knockout (B) adult mice followed serially for 36 to 50 days after surgery. The control data are representative of 6 mice.
Consequence of splenectomy on the hematocrit (HCT) and reticulocyte counts (RETIC) of 2 representative control (A) and 4 p45 NF-E2 knockout (B) adult mice followed serially for 36 to 50 days after surgery. The control data are representative of 6 mice.
DISCUSSION
Animal models of disease provide invaluable insights into physiology and pathology. Knockout mice have particular power in this regard because their phenotypes can be attributed to the loss of a single gene product, and understanding these phenotypes establishes the essential functions of the disrupted gene in the context of the whole animal. Indeed, targeted disruption of a single gene frequently reveals complex effects resulting from abnormalities in single- or multiple-cell lineages, as illustrated by mice that lack the hematopoietic-specific p45 subunit of the bZip transcription factor NF-E2. These mice display profound thrombocytopenia, impressive splenic enlargement with megakaryocytosis, and anemia with hypochromia and reticulocytosis; although the mean RBC volume (MCV) of NF-E2 knockout mice is not reduced, the RBC size distribution width (RDW) is much greater than normal, consistent with the simultaneous presence of many reticulocytes and small RBCs. We undertook these studies to achieve a fuller understanding of the relationships between these consequences of the targeted disruption of a single transcriptional regulator.
Previous analysis of the thrombocytopenic phenotype, limited to examination of postendomitotic megakaryocyte differentiation, had shown that this results from a late arrest in megakaryocyte cytoplasmic maturation. Indeed, the megakaryocytosis in vivo and the additional proliferation in response to pharmacologic administration of Tpo8 both suggested that the replication potential of NF-E2–deficient megakaryocyte progenitors is intact. In the current studies, however, NF-E2–null fetal liver cells cultured in vitro in the presence of serum and recombinant Tpo yielded significantly lower numbers of mature megakaryocytes than controls, whereas the frequency of CFU-Mk was only slightly reduced. Thus, NF-E2 appears to be required at 2 distinct stages of megakaryocyte development: in terminal cytoplasmic maturation, as we have demonstrated previously,8 and in regulation of replication of the progeny of committed precursors, as shown in this report. Hence, the megakaryocytosis seen in p45 NF-E2 knockout mice8 19 likely reflects a steady state achieved through chronic stimulation by Tpo and/or other factors in the presence of severe thrombocytopenia. Indeed, the defect in proliferation was uncovered in vitro under controlled culture conditions; it is likely that additional factors operate in vivo to produce or maintain the baseline increase in the number of megakaryocytes. Prolonged survival of cells that are unable to terminate differentiation and produce platelets may also contribute to the megakaryocytosis.
We were intrigued by the consistent detection of small numbers of platelet-size particles in association with splenic macrophages19 and in the peripheral blood (Fig 3). These particles obviously do not protect the knockout mice from usually lethal perinatal hemorrhage but might contribute to survival of about 10% of the mutant animals into adulthood. The ultrastructure of these particles, however, showed a very abnormal organization relative to normal platelets and is suggestive of haphazard packaging of organelles rather than normal platelet biogenesis. Furthermore, the fraction of particles expressing platelet antigens responded poorly to platelet agonists and, thus, likely contributes only marginally toward hemostasis in vivo. We recently reported that cultured p45 NF-E2−/− megakaryocytes do not produce proplatelets,18 the presumptive immediate precursors of blood platelets in terminally differentiated megakaryocytes.22-24 Here we also show that splenectomy does not restore platelet levels in mice lacking p45 NF-E2, indicating that the severe thrombocytopenia does not result from splenic destruction of platelets. Taken together, these findings lead us to speculate that most of the platelet-like particles found in p45 NF-E2−/− mice represent megakaryocyte debris or pathologic cell fragments.
The identification of NF-E2 through its presumed function in developing erythrocytes imparts special relevance to the phenotype of RBCs in its absence and to the relationship between the erythroid and platelet abnormalities in the knockout mice. One possibility is that anemia and reticulocytosis occur secondary to chronic hemorrhage in the presence of severe thrombocytopenia; alternatively, these findings may reflect distinct requirements for NF-E2 function in producing normal RBCs. We have previously shown that the magnitude of hypochromia and anisocytosis is highly similar across many individual adult knockout mice and, therefore, unlikely to be a direct consequence of recent bleeding, which varies among individuals.7 Baseline reticulocyte counts well exceeding 10%, often associated with hematocrits ≥40%, are also difficult to ascribe exclusively to intermittent or chronic, low-level hemorrhage, and the knockout mice are not deficient in iron.7 In the current studies, lethally irradiated wild-type mice reconstituted by p45 NF-E2−/− hematopoietic cells also rapidly developed splenomegaly and a consistent degree of the same RBC abnormalities within the brief period of posttransplant observation (Fig 7). Moreover, small RBC fragments dominate the platelet fraction of p45 NF-E2−/− blood (Figs 3 through 5), even though the lifespan of intact mutant RBCs is indistinguishable from control cells in vivo (Fig 8). The sum of these observations indicates that RBC maturation in the absence of NF-E2 function is defective and that the reticulocytosis reflects a compensatory response to this defect.
Although we performed splenectomies on p45 NF-E2 knockout mice principally to test whether platelet destruction in the spleen contributes to the severe thrombocytopenia, the consequences of this surgery were more broadly instructive. Besides determining that platelet levels did not increase after splenectomy (Fig 6), we noted an inverse correlation between spleen weight and presplenectomy hematocrit, and a loose direct correlation between spleen weight and the reticulocyte count (Table 2). Furthermore, p45 NF-E2−/− mice mounted a dramatic reticulocytosis after splenectomy (Fig 9), indicating that the spleen is not required to maintain adequate erythropoiesis. This occurred in individuals with relatively stable hematocrits as well as in mice whose hematocrits initially declined. The degree of reticulocytosis exceeded that seen in most clinical situations and was sustained even in mice whose hematocrits stabilized over the last 3 or more weeks of observation and in the absence of detectable hemorrhage, as judged by careful postmortem studies. These data are consistent with the previously noted normal proliferation potential of erythroid CFU in vitro.7 Nevertheless, it is almost impossible to rule out some contribution of ongoing, low-level hemorrhage to the constellation of hematologic findings.
Although the presence of anemia and marked reticulocytosis in NF-E2 knockout mice would usually suggest a hemolytic process, the normal bilirubin levels and normal life span of circulating RBCs are inconsistent with significant peripheral destruction. Moreover, a usually low level of hemolysis should become less rather than more severe after splenectomy. Indeed, the sum of our current and previous findings is more consistent with the notion that absence of p45 NF-E2 results in a biochemical block in normal RBC maturation, perhaps akin to the defect in terminal megakaryocyte differentiation. We speculate that the enlarged spleen concomitantly sequesters most reticulocytes from the circulation and functions as an organ of erythropoiesis. Removal of this organ, which usually performs both phagocytic and erythropoietic functions in NF-E2 knockout mice, hence results in higher peripheral reticulocytosis and a paradoxically lower hematocrit.
We interpret our analysis of the complex phenotype of mice lacking NF-E2 to suggest the following hematologic pathophysiology. There is a clear essential function for NF-E2 in megakaryocytes, both in regulating proliferation of the progeny of committed precursors and in facilitating terminal differentiation, including platelet release.18 There is also an essential requirement for NF-E2 within maturing RBCs, possibly independent of any potential role in regulating globin gene expression. This is manifested by production of RBC populations comprised of defective platelet-size fragments as well as less severely abnormal but heterogeneous and hypochromic cells. The splenomegaly probably reflects a physiologic response to increased demand for RBC production, although the spleen is not essential for this purpose because some erythroid reserve clearly resides in extra-splenic sites. An expanded megakaryocyte compartment and sequestration or phagocytosis of abnormal RBCs may also contribute to splenomegaly. Finally, a variable degree of reticulocytosis compensates for anemia that results from some combination of defective erythropoiesis and chronic hemorrhage, with the former responsible for a significant proportion of increased erythroid demand. This model and the expression profiles and in vivo requirements of p45 NF-E2 and other transcriptional regulators are consistent with emerging concepts of differentiation of erythrocytes and megakaryocytes from a common progenitor.25-28
In these studies, we have used physiologic experiments to address hematologic aspects of the phenotype of mice lacking p45 NF-E2. A deeper understanding of the molecular basis of specific cellular defects may follow identification of the relevant transcriptional targets of NF-E2 in developing RBCs and megakaryocytes. Our findings predict that these targets include genes responsible for proper maturation of RBCs, for appropriate expansion of megakaryocyte progenitors, and for release of functional blood platelets from terminally differentiated megakaryocytes.
ACKNOWLEDGMENT
We are grateful to Yuhui Xu and Paula Stenberg for assistance with electron microscopy; to Frederic de Sauvage for assaying serum Tpo levels and providing c-Mpl knockout mice; to Bethany Swencki for technical assistance; to Paresh Vyas and Stuart Orkin for helpful discussions and critical comments on the manuscript; and to Sang-We Kim for statistical analysis.
Supported in part by grants from the Veterans Administration and the National Institutes of Health.
The publication costs of this article were defrayed in part by page charge payment. This article must therefore be hereby marked “advertisement” in accordance with 18 U.S.C. section 1734 solely to indicate this fact.
REFERENCES
Author notes
Address reprint requests to Ramesh A. Shivdasani, MD, PhD, Dana-Farber Cancer Institute, 44 Binney St, Boston, MA 02115; e-mail:ramesh_shivdasani@dfci.harvard.edu.

This feature is available to Subscribers Only
Sign In or Create an Account Close Modal