Abstract
Hematopoietic growth factors (HGFs) stimulate growth, differentiation, and prevent apoptosis of progenitor cells. Each growth factor has a specific cell surface receptor, which activates both unique and shared signal transduction pathways. We found that several HGFs, including granulocyte-macrophage colony-stimulating factor (GM-CSF), interleukin-3 (IL-3), steel factor (SF), and thrombopoietin (TPO) induce a rapid increase in reactive oxygen species (ROS) in quiescent cells. In an effort to understand the potential biochemical and biological consequences of increased ROS in these cells, we exposed growth factor-deprived cells to hydrogen peroxide (H2O2) at concentrations that increased intracellular ROS. H2O2 induced a dose-dependent increase in tyrosine phosphorylation, including increased tyrosine phosphorylation of the GM-CSF receptor beta chain (βc), STAT5, and other signaling proteins. H2O2 also induced expression of the early response gene c-FOS, and G1- to S-phase transition, but not S- to G2/M-phase transition of MO7e cells. The cell permeable antioxidant pyrrolidine dithiocarbamate (PDTC) decreased the intracellular levels of ROS and inhibited tyrosine phosphorylation induced by GM-CSF in MO7e cells, suggesting that ROS generation plays an important role in GM-CSF signaling. Consistent with this notion, PDTC and two other antioxidants, N-acetyl cysteine and 2-mercaptoethanol, reduced growth and viability of MO7e cells. These results suggest that generation of ROS in response to HGFs may contribute to downstream signaling events, especially those involving tyrosine phosphorylation.
HEMATOPOIETIC GROWTH factors (HGFs) bind to specific cell surface receptors and rapidly activate cellular tyrosine kinases or intrinsic receptor tyrosine kinase activity. In many cases, the receptor itself becomes tyrosine phosphorylated, and phosphorylation sites in the receptor lead to recruitment of SH2 containing proteins that can activate downstream signaling pathways.1-3 For example, the SH2 domain of SHC can be recruited to a phosphotyrosine containing sequence in the erythropoietin receptor followed by binding of GRB2 and SOS to SHC.4,5 SOS is a nucleotide exchange factor and this pathway leads to activation of p21RAS.6,7 In addition, many growth factor receptors share common downstream signaling proteins such as SHP-2, CBL, STATs, and PI3K.8 Such common pathways are likely to lead to common biological events such as regulation of proliferation, viability, or adhesion.
Recently, activation of the platelet-derived growth factor (PDGF) receptor9 or ultraviolet (UV)-irradiation10 have been shown to activate intracellular regulation of redox processes through generation of reactive oxygen species (ROS) such as H2O2 and superoxide. It has been suggested in these cases that ROS may act as second messengers to regulate activities of redox-sensitive enzymes, including protein kinases and protein phosphatases. Of particular interest is the fact that several protein tyrosine phosphatases are highly sensitive to oxidation because of a critical thiol group in the active site of the enzyme.11
In this study, we have investigated the potential role of ROS in signal transduction of several hematopoietic growth factors, including granulocyte-macrophage colony-stimulating factor (GM-CSF), interleukin-3 (IL-3), steel factor (SF), and thrombopoietin (TPO), using the growth factor–dependent cell lines MO7e, TF1, and 32Dcl3. In each cell line, growth factor stimulation increased the intracellular level of ROS as measured by 2’, 7’-dichloro-fluorescein fluorescence. ROS levels were rapidly increased and sustained, suggesting that this increase of ROS could, in part, be a signal due to multiple mechanisms, including a direct response to signal transduction, as well as a consequence of cell metabolism. To determine the potential significance of increased ROS, more detailed signaling studies were performed in MO7e cells to compare GM-CSF signaling with that induced by the ROS H2O2. We found that H2O2, like GM-CSF, induces tyrosine phosphorylation of cellular proteins, c-FOS gene expression, G1 to S phase transition, and cell migration.
MATERIALS AND METHODS
Cells.
The human megakaryocytic cell line, MO7e, was grown in Dulbecco’s modified Eagle’s medium (DMEM) with 20% (vol/vol) fetal calf serum (FCS) and 10 ng/mL GM-CSF (Immunex, Seattle, WA). The human erythrocytic cell line, TF1, was grown in RPMI 1640 with 10% (vol/vol) FCS and 10 ng/mL GM-CSF. The murine myeloid cell line, 32Dcl3, was grown in RPMI 1640 with 10% (vol/vol) FCS and 10% (vol/vol) WEHI conditioned medium (as a source of murine IL-3). MO7e cells were deprived of growth factors for 18 hours in DMEM medium containing 1% (wt/vol) bovine serum albumin (BSA) or TF1, and 32Dcl3 cells were starved for the same period in RPMI 1640 medium containing 0.5% (wt/vol) BSA. Cells were stimulated with recombinant human GM-CSF, recombinant human IL-3 (Genetics Institute, Cambridge, MA), recombinant human SF (Amgen, Thousand Oaks, CA), or recombinant murine IL-3 (Upstate Biotechnology Inc, Lake Placid, NY). Viability of cells was determined by trypan blue exclusion or annexin V (Boehringer Mannheim, Mannheim, Germany) staining.
Analysis of ROS in starved and growth factor–stimulated cells.
A total of 106 cells was incubated with 5 μmol/L DCF-DA (2’, 7’-dichloro-fluorescin-diacetate; Acros Organics, Pittsburgh, PA) for 5 minutes at 37°C and subsequently washed twice in cold Dulbecco’s phosphate-buffered saline (PBS) before analysis using a Coulter Epics XL flow cytometer (Coulter Corp, Miami, FL). DCF-DA is a cell permeable dye commonly used to monitor intracellular changes in ROS. This compound becomes fluorescent when oxidized by either H2O2 or superoxide. The fluorescence of oxidized DCF was measured with an excitation wavelength of 480 nm and an emission wavelength of 525 nm.12 13
Stimulation of cells and preparation of cellular lysates.
For immunoprecipitation studies, growth factor-starved MO7e cells were stimulated at 37°C for 7.5 minutes with GM-CSF (20 ng/mL) and SF (40 ng/mL) or 20 minutes with H2O2 (5 mmol/L). In some experiments, cells were pretreated for 3 hours with the antioxidant pyrrolidine dithiocarbamate (PDTC; Sigma Co, St Louis, MO) before stimulation with growth factors. Cells were subsequently washed once in cold Dulbecco’s PBS, and cell lysates were prepared as described.14
Immunoprecipitation and immunoblotting.
Immunoprecipitation and immunoblotting using a chemiluminescence technique was performed as described.14Tyrosine-phosphorylated proteins were detected using the monoclonal antibody 4G10 (kindly provided by Dr B. Druker, Oregon Health Sciences University, Portland). A mouse monoclonal antibody against the GM-CSF receptor β chain (βc; Santa Cruz Biotech, Santa Cruz, CA) and polyclonal rabbit antisera against STAT5 (Santa Cruz Biotech) were used for immunoprecipitation.
Northern blotting.
The expression of c-FOS after H2O2 stimulation in MO7e cells was analyzed by Northern blotting using standard methods. cDNA probes against c-FOS (431 bp) and G3PDH (glycerinaldehyde 3-phosphate dehydrogenase; 331 bp) were generated by reverse transcriptase-polymerase chain reaction (RT-PCR). The following oligonucleotides were used for c-FOS: 5′-AGCTCCCTCCTCCGGTTGCGGCAT-3′ (antisense primer) and 5′-CTACGAGGCGTCATCCTCCCG-3′ (sense primer) and for G3PDH: 5′-TTCAAGGGGTSTACATGGCAACTG-3′ (antisense primer) and 5′-GGGCATCCTGGGCTACACTG-3′ (sense primer). The cDNA probes were labeled using Klenow fragment (High Prime Kit; Boehringer Mannheim) with 32P-deoxycytidine triphosphate (dCTP) and purified with ProbeQuant G-50 micro columns (Pharmacia Biotech, Piscataway, NJ). Total RNA was isolated with Trizol reagent (Life Technologies, GIBCO-BRL, Gaithersburg, MD) and used to prepare mRNA (Message Maker; Life Technologies, GIBCO-BRL) to evaluate gene expression. Bound probe was analyzed by phosphorimaging analysis (FLA-2000 Fluorescent Image Analyzer; Fuji Photo Film Corp, Stamford, CT).
Cell cycle analysis.
Starved MO7e cells were treated at 37°C with GM-CSF, 0.05 mmol/L H2O2 in water (Sigma, 30% [wt/wt] solution) or an equal volume water and analyzed after propidium iodide staining using standard methods. In brief, 0.5 × 10⁶ cells per sample were washed once in cold Dulbecco’s PBS and resuspended in 500 μL staining solution containing 50 μg/mL propidium iodide, 0.1% (vol/vol) NP-40, and 0.1% (wt/vol) sodium citrate. Cells were incubated at 4°C in the dark for 15 minutes and then analyzed by flow cytometry.
Transwell migration assay.
The membranes of transwell chambers (8-μm pore size polycarbonate membrane, Corning Costar Corp, Cambridge, MA) were coated with 10 μg/mL fibronectin (Life Technologies, GIBCO-BRL) for 18 hours. Starved cells (0.2 × 10⁶) were transferred to the upper chamber in DMEM medium containing different stimuli. After 5 hours, cells in the lower compartment were concentrated by centrifugation and living cells counted by trypan blue exclusion.
RESULTS
GM-CSF, IL-3, SF, and TPO alter the intracellular redox status of hematopoietic cell lines.
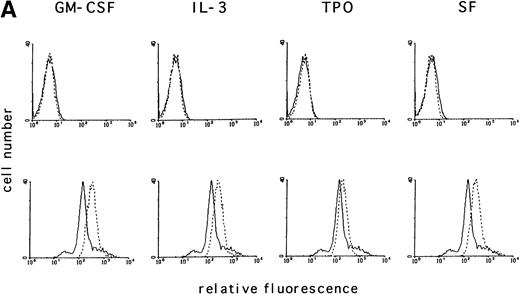
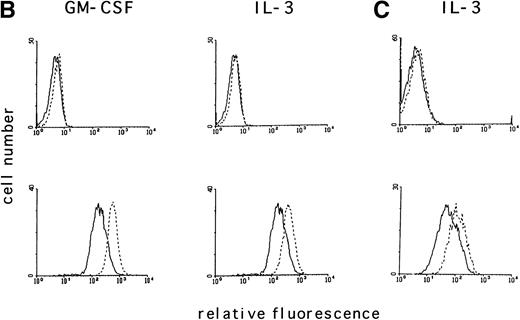
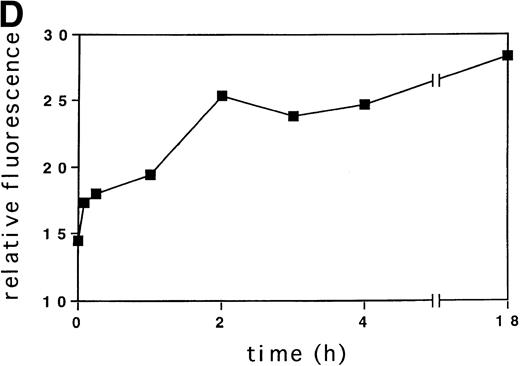
Activation of tyrosine kinases, in particular the PDGF receptor, has been shown to upregulate ROS levels. The relative ROS levels in hematopoietic cell lines, treated and untreated with GM-CSF, were measured and compared with other growth factors using the fluorochrome 2’, 7’-dichloro-fluorescin-diacetate. The human megakaryocytic cell line, MO7e (Fig 1A); the human erythrocytic cell line, TF1 (Fig 1B); and the murine myeloid cell line, 32Dcl3 (Fig1C) were studied. Figure 1A (lower panel) shows that the relative ROS levels in MO7e cells are increased on GM-CSF, IL-3, TPO, or SF stimulation compared with growth factor-deprived cells. Similarly, the relative ROS levels were increased in TF1 cells after GM-CSF or IL-3 stimulation (Fig 1B, lower panel) and in 32Dcl3 cells after IL-3 stimulation (Fig 1C, lower panel). Growth factor–deprived and stimulated cells had equal levels of autofluorescence as tested by fluorescence-activated cell sorting (FACS) analysis using no fluorochrome (Fig 1A through C, upper panel). The kinetics of changes in relative levels of ROS were analyzed in MO7e cells treated for 0 to 18 hours with GM-CSF. The levels of ROS continously increased within the first 2 hours until they reached a plateau and increased only slightly over the next 16 hours (Fig 1D).
GM-CSF, IL-3, SF, and TPO increase the intracellular level of ROS in hematopoietic cell lines. (A through C) The relative levels of ROS were measured in starved cells (dotted line) and in growth factor-treated cells (straight line) as indicated using 2’, 7’-dichloro-fluorescin-diacetate (bottom panel) or the autofluorescence of these cells was measured without fluorochrome (top panel). (A) MO7e cells were treated with either GM-CSF (10 ng/mL), IL-3 (10 ng/mL), SF (20 ng/mL), or TPO (100 ng/mL) for 18 hours. (B) TF1 cells were treated with either GM-CSF (10 ng/mL) or IL-3 (10 ng/mL) for 18 hours. (C) 32Dcl3 cells were treated with IL-3 (10 ng/mL) for 18 hours. (D) The increase in relative levels of ROS was measured in MO7e cells stimulated for 0 to 18 hours with 20 ng/mL GM-CSF.
GM-CSF, IL-3, SF, and TPO increase the intracellular level of ROS in hematopoietic cell lines. (A through C) The relative levels of ROS were measured in starved cells (dotted line) and in growth factor-treated cells (straight line) as indicated using 2’, 7’-dichloro-fluorescin-diacetate (bottom panel) or the autofluorescence of these cells was measured without fluorochrome (top panel). (A) MO7e cells were treated with either GM-CSF (10 ng/mL), IL-3 (10 ng/mL), SF (20 ng/mL), or TPO (100 ng/mL) for 18 hours. (B) TF1 cells were treated with either GM-CSF (10 ng/mL) or IL-3 (10 ng/mL) for 18 hours. (C) 32Dcl3 cells were treated with IL-3 (10 ng/mL) for 18 hours. (D) The increase in relative levels of ROS was measured in MO7e cells stimulated for 0 to 18 hours with 20 ng/mL GM-CSF.
The antioxidant PDTC decreases ROS levels and viability in GM-CSF–treated cells.
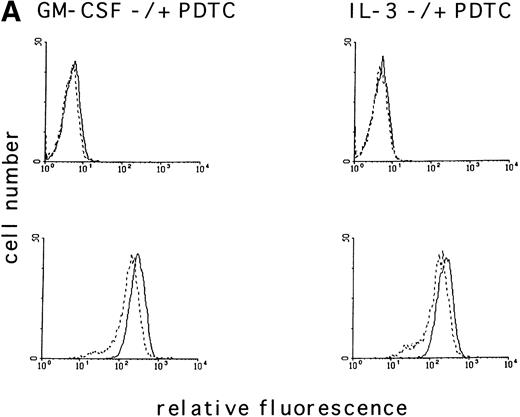
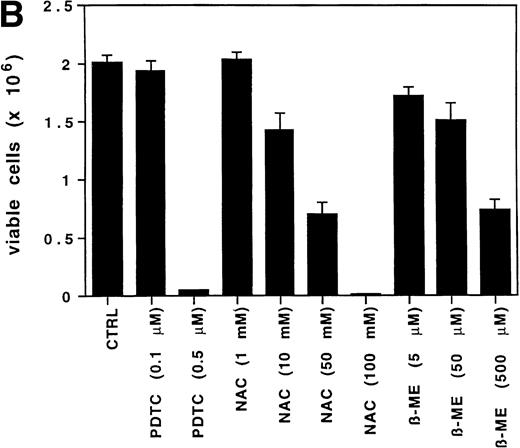
To determine if the intracellular ROS levels can be manipulated by adding reducing agents, MO7e cells grown in GM-CSF– or IL-3–containing medium without FCS were treated with the reducing agent PDTC (25 μmol/L) for 3 hours and then analyzed. PDTC was not cytotoxic under these conditions, and the cells retained full viability for the duration of the experiment as assessed by trypan blue exclusion and annexin V staining. PDTC decreased the intracellular levels of ROS in MO7e cells treated with either growth factor (Fig 2A, bottom panel), but did not alter the autofluorescence of these cells (Fig 2A, top panel). Finally, the effects of PDTC on proliferation of 3-day cultures of MO7e cells in GM-CSF (10 ng/mL) were tested. In contrast to the relatively high concentration of PDTC that was required for a 3-hour treatment to suppress GM-CSF– and IL-3–induced increase in ROS, the dose that was required to suppress cell growth in a 3-day culture was lower. As shown in Fig 2B, 0.5 μmol/L PDTC completely suppressed growth and viability of GM-CSF–stimulated MO7e cells. Equivalent results were obtained with PDTC-treated BaF3 cells (data not shown). Similar to PDTC, the antioxidants, N-acetyl cysteine and 2-mercaptoethanol, suppressed growth and viability of GM-CSF–treated MO7e cells. These effects were dose-dependent and the lowest concentrations that reduced cell growth in a 3-day culture were 10 mmol/L for N-acetyl cysteine and 50 μmol/L for 2-mercaptoethanol. These data suggest that antioxidants block a pathway in GM-CSF–stimulated MO7e cells that is important for cell growth.
The antioxidant PDTC reduces intracellular levels of ROS and cell growth in MO7e cells. (A) MO7e cells were stimulated for 18 hours with 10 ng/mL GM-CSF or 10 ng/mL IL-3 before treatment for 3 hours with 25 μmol/L PDTC (dotted line) or left untreated (straight line) as indicated. The autofluorescence of these cells (top panel) or the relative levels of ROS using 2’, 7’-dichloro-fluorescin-diacetate (bottom panel) were measured. (B) MO7e cells were treated with the indicated doses PDTC, NAC, and 2-mercaptoethanol (2-ME) for 72 hours, and cell growth was measured by trypan blue exclusion. The error bars indicate the standard error of the mean (SEM) (n = 4).
The antioxidant PDTC reduces intracellular levels of ROS and cell growth in MO7e cells. (A) MO7e cells were stimulated for 18 hours with 10 ng/mL GM-CSF or 10 ng/mL IL-3 before treatment for 3 hours with 25 μmol/L PDTC (dotted line) or left untreated (straight line) as indicated. The autofluorescence of these cells (top panel) or the relative levels of ROS using 2’, 7’-dichloro-fluorescin-diacetate (bottom panel) were measured. (B) MO7e cells were treated with the indicated doses PDTC, NAC, and 2-mercaptoethanol (2-ME) for 72 hours, and cell growth was measured by trypan blue exclusion. The error bars indicate the standard error of the mean (SEM) (n = 4).
Oxidative stress increases tyrosine phosphorylation of cellular proteins in MO7e cells.
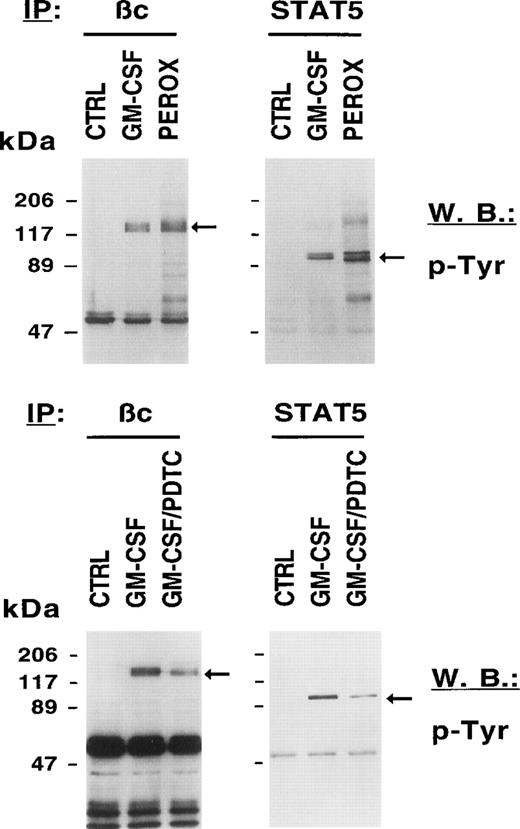
Signaling through HGF receptors correlates with the activation of tyrosine kinases such as JAK2. Biological effects activated by growth factors are therefore thought to be mediated through tyrosine phosphorylation of cellular proteins. We sought to determine the biochemical consequences of an exogenously given ROS to unstimulated cells and to compare it with GM-CSF–stimulated cells. Figure 3 (top panel) shows that H2O2, like GM-CSF, increases the tyrosine phosphorylation of the common βc and STAT5 compared with growth factor–deprived MO7e cells. We also found tyrosine phosphorylation of other signaling proteins after H2O2 stimulation including c-KIT, the receptor for SF, the adapter protein SHC, and the protein tyrosine phosphatase SHP-1 (data not shown). These data suggest that a change in the intracellular redox status on growth factor stimulation contributes to the increased tyrosine phosphorylation of cellular proteins.
The redox status in MO7e cells regulates the tyrosine phosphorylation of growth factor receptors and STAT5. MO7e cells were left untreated (CTRL) or treated for 7.5 minutes with either GM-CSF (20 ng/mL), 20 minutes H2O2 (5 mmol/L) (PEROX), or pretreated with 1 mmol/L PDTC for 3 hours and then stimulated with GM-CSF (GM-CSF/PDTC) for 7.5 minutes. Tyrosine-phosphorylated proteins were detected in GM-CSF receptor βc and STAT5 immunoprecipitates by immunoblotting with an antiphosphotyrosine antibody (p-Tyr).
The redox status in MO7e cells regulates the tyrosine phosphorylation of growth factor receptors and STAT5. MO7e cells were left untreated (CTRL) or treated for 7.5 minutes with either GM-CSF (20 ng/mL), 20 minutes H2O2 (5 mmol/L) (PEROX), or pretreated with 1 mmol/L PDTC for 3 hours and then stimulated with GM-CSF (GM-CSF/PDTC) for 7.5 minutes. Tyrosine-phosphorylated proteins were detected in GM-CSF receptor βc and STAT5 immunoprecipitates by immunoblotting with an antiphosphotyrosine antibody (p-Tyr).
We excluded the possibility that the increase in tyrosine phosphorylation induced by H2O2 occurred during the subsequent lysis of cells. The buffer that was used to prepare lysates of peroxide-stimulated cells contains vanadate that could hypothetically react with peroxide to generate pervanadate, a potent phosphatase inhibitor and known stimulator of cellular tyrosine phosphorylation. However, omission of vanadate from this buffer did not reduce H2O2-induced tyrosine phosphorylation (data not shown).
Because HGF-stimulated cells have increased levels of ROS and increased levels of ROS are associated with tyrosine phosphorylation, we asked if reducing agents such as PDTC might decrease tyrosine phosphorylation of cellular proteins in MO7e cells. Figure 3 (bottom panel) shows that PDTC reduced tyrosine phosphorylation of cellular proteins previously shown to be phosphorylated by either H2O2 or GM-CSF. Pretreatment of MO7e cells with PDTC resulted in reduced tyrosine phosphorylation of the βc and STAT 5 after GM-CSF stimulation. These data suggest that PDTC is effective in reducing tyrosine phosphorylation of cellular proteins in growth factor–stimulated cells. It can also be appreciated that the reduction in phosphotyrosine signal was significant, but incomplete.
H2O2 induces c-FOS expression and cell cycle progression.
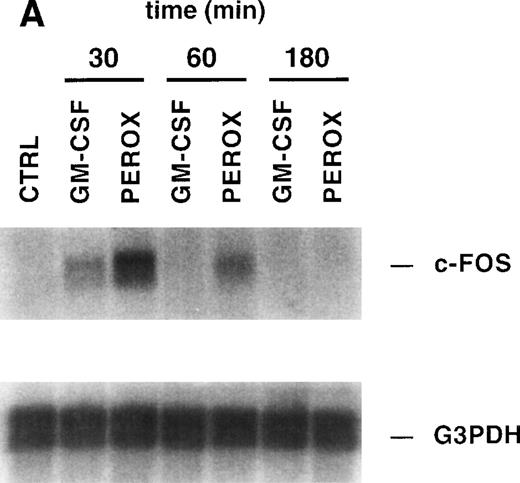
The previous results suggested that treatment of MO7e cells with H2O2 mimics at least some of the signaling pathways normally activated by growth factor receptors, such as receptor phosphorylation. Therefore, we sought to determine if H2O2 can also activate some of the fundamental processes that are required for cell growth and viability, such as gene expression. We have previously shown that c-FOS is upregulated in MO7e cells after GM-CSF stimulation. MO7e cells were treated for 30 minutes, 60 minutes, or 3 hours with H2O2, GM-CSF, or left untreated and then expression of c-FOS was analyzed by Northern blotting (Fig 4A). c-FOS was induced by both GM-CSF and H2O2 after 30 minutes of stimulation and thereafter decreased and became undetectable after 3 hours of stimulation. The membrane was stripped and reprobed with a G3PDH probe, demonstrating equal loading of mRNA.
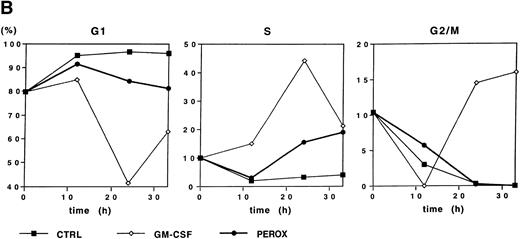
Because H2O2 induced early gene expression, we sought to determine whether this oxidant could also induce cell cycle progression. Starved MO7e cells were either treated with GM-CSF, H2O2, or control medium, and the DNA content was analyzed for 0 to 33 hours by propidium iodide staining (Fig 4B). Due to the short half-life of dilute H2O2, the stimulation was repeated by resuspending the cells in fresh medium every 3 hours for the first 12 hours of stimulation. Growth factor–deprived cells remained in G1-phase for the 33 hours of this study. Both GM-CSF and H2O2 induced a fraction of cells to enter S-phase after 24 hours (44% and 15%, respectively), but further cell cycle progression to G2/M-phase was only observed in GM-CSF–stimulated cells. This suggests that H2O2 can induce G1-arrested cells to enter S-phase, but stimulation with the oxidant alone is insufficient to bring cells into G2/M-phase and, thus, induce proliferation.
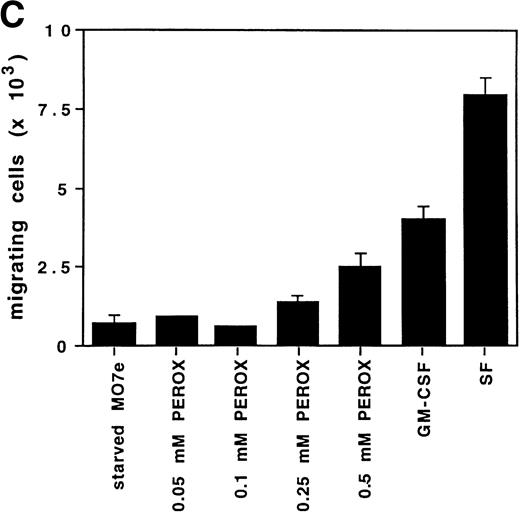
H2O2 mimics GM-CSF–induced G1-S phase transition, early gene expresion, and random transwell migration in MO7e cells. (A) Gene expression was analyzed using mRNA from MO7e cells left untreated (CTRL) or stimulated for the indicated times with GM-CSF (20 ng/mL) or H2O2 (PEROX, 250 μmol/L). The expression of c-FOS and G3PDH was detected by Northern blotting using specific probes. (B) MO7e cells were either left untreated or treated with GM-CSF (20 ng/mL) or H2O2 (PEROX, 50 μmol/L). Cell cycle analysis was performed using propidium iodide at the indicated time points and the samples were analyzed by flow cytometry. (C) MO7e cells were either left untreated or treated with GM-CSF, SF, or H2O2 (PEROX) as indicated and used for a random transwell migration assay. The number of viable cells in the lower chamber was determined after 5 hours of migration by trypan blue exclusion. The error bars indicate the SEM (n = 4).
H2O2 mimics GM-CSF–induced G1-S phase transition, early gene expresion, and random transwell migration in MO7e cells. (A) Gene expression was analyzed using mRNA from MO7e cells left untreated (CTRL) or stimulated for the indicated times with GM-CSF (20 ng/mL) or H2O2 (PEROX, 250 μmol/L). The expression of c-FOS and G3PDH was detected by Northern blotting using specific probes. (B) MO7e cells were either left untreated or treated with GM-CSF (20 ng/mL) or H2O2 (PEROX, 50 μmol/L). Cell cycle analysis was performed using propidium iodide at the indicated time points and the samples were analyzed by flow cytometry. (C) MO7e cells were either left untreated or treated with GM-CSF, SF, or H2O2 (PEROX) as indicated and used for a random transwell migration assay. The number of viable cells in the lower chamber was determined after 5 hours of migration by trypan blue exclusion. The error bars indicate the SEM (n = 4).
H2O2 increases random transwell migration of MO7e cells.
Another prominent effect of growth factors such as GM-CSF is induction of migration. Therefore, the potential ability of H2O2 to increase the number of MO7e cells migrating through a fibronectin-coated membrane in a transwell migration assay was measured. MO7e cells were placed in the upper transwell chambers, while equal concentrations of the stimulant were in both chambers. Therefore, the number of cells migrating to the lower chamber is random and depends on the ability of the stimulant to increase cell motility, as well as to activate the ability to migrate through the transwell membrane. In this assay, growth factor–deprived MO7e cells were stimulated with either 0.1 mmol/L, 0.25 mmol/L, or 0.5 mmol/L H2O2, or 20 ng/mL GM-CSF or 40 ng/mL SF. As shown in Fig 4C, both cytokines increased transwell migration compared with starved cells in this assay, fourfold after GM-CSF stimulation, and eightfold after SF stimulation. The random transwell migration of MO7e cells was also increased with H2O2. This effect was dose-dependent and at the highest concentration (0.5 mmol/L H2O2) was increased threefold over the level in starved MO7e cells. These data suggest that oxidants such as H2O2, like GM-CSF, might contribute to the complex biologic processes that regulate cytoskeletal function and result in cell migration.
DISCUSSION
We have shown that GM-CSF and other growth factors including IL-3, SF, and TPO are associated with increased levels of ROS in different hematopoietic cell lines compared with unstimulated cells. Selectively increasing intracellular ROS by adding H2O2induced tyrosine phosphorylation and other signaling events, while pretreatment of cells with the reducing agent, PDTC, suppressed formation of ROS, as well as GM-CSF–activated signal transduction, suggesting that ROS contribute to growth factor signal transduction. Reducing agents such as PDTC, 2-mercaptoethanol, and N-acetyl cysteine suppressed growth of several hematopoietic cell lines, including MO7e cells, suggesting that growth factor–induced generation of ROS may be biologically significant.
In other cell systems, ROS have previously been shown to be involved in various biologic functions. ROS are formed in cells after a variety of stimuli, including UV-irradiation10 or cytokines, such as transforming growth factor-β (TGF-β),15 epidermal growth factor (EGF),16 or PDGF.9 Interestingly, depending on the cell type or the stimulus, changes in the oxidative state can result in apparently opposing pathways such as p53-mediated apoptosis through ROS17,18 or induction of apoptosis by antioxidants.19,20 The role of ROS has been best described in PDGF-stimulated vascular smooth muscle cells. PDGF stimulated the formation of H2O2 in these cells, which could be suppressed by overexpression of catalase. PDGF-induced tyrosine phosphorylation, mitogen-activated protein (MAP) kinase stimulation, DNA synthesis, and chemotaxis were found to be dependent on the increase of H2O2 in these cells.9
Here we show that GM-CSF, IL-3, SF, and TPO induce increased formation of ROS, and that some of the biochemical and biologic effects of these cytokines are mimicked by H2O2. These effects include tyrosine phosphorylation of cellular proteins, increased migration, c-FOS gene expression, and G1 to S-phase cell cycle progression. In MO7e cells, H2O2 was as effective as GM-CSF in inducing cellular tyrosine phosphorylation, and the antioxidant, PDTC, reduced GM-CSF–stimulated tyrosine phosphorylation, suggesting that ROS might contribute to signaling by stimulating or augmenting tyrosine phosphorylation. GM-CSF and ROS induced tyrosine phosphorylation of some of the same substrates, including the βc chain21 and STAT5.22 23
The studies presented here expand the cell lineages and signaling events already potentially linked to intracellular formation of ROS. However, the exact mechanisms of ROS action are not well understood. Recent work indicates that an important function of ROS may be to modulate the function of protein tyrosine phosphatases. Protein tyrosine phosphatases contain a critical cysteine residue in their active site that is a potential target for redox regulation, and this residue must be in the reduced state for full phosphatase activity.11 For example, H2O2 can specifically inhibit the protein tyrosine phosphatase activity of LAR (leukocyte antigen-related) and PTP1, but has no apparent effect on serine/threonine protein phosphatases, including PP2C-α and calcineurin. The inhibitory effect is due to the selective oxidation of the cysteine residue in the catalytic domain by H2O2.24 This is of special interest because inhibition of tyrosine phosphatases through redox modulation would explain the broad spectrum of H2O2 on biologic activities. In the current study, we have shown that H2O2 increases tyrosine phosphorylation of cellular proteins and the antioxidant, PDTC, inhibits cytokine receptor-induced kinase activity and reduces the total cellular tyrosine phosphorylation. Tyrosine phosphatases are crucial for the regulation of many signaling pathways,25 26 and if ROS inhibit one or more tyrosine phosphatases in hematopoietic cells, this could explain many of the biologic activities associated with ROS that are shown here.
The results presented here also show that ROS generated outside the cell can activate intracellular signaling in hematopoietic cells. This is consistent with previous studies in other cell types showing induction of tyrosine phosphorylation or activation of a number of signaling molecules by H2O2, including SHC,27 LCK,28 SYK,29FAK,30 protein kinase C (PKC),31activation of mitogen-activated protein kinase (MAPK),27and other signaling molecules. Redox-sensitive cysteine residues in key proteins are likely to play a critical role in mediating these signaling events. For example, oxidation of Cys118 in p21RAS has been reported to activate its GTPase activity and increase the activity of the downstream effector MAPK.32
Interestingly, in contrast to the GM-CSF–induced transient tyrosine phosphorylation of cellular proteins, the fluorescence of DCF was sustained in MO7e cells for at least 18 hours. We cannot exclude that the production of ROS is a result of mitochondrial metabolism as a consequence of cell growth. However, our results also suggest that ROS can play a role in processes that promote cell growth. Cells stimulated with H2O2 have increased tyrosine phosphorylation, increased cell cycle progression and gene expression, and increased transwell migration. These processes occur later than the observed tyrosine phosphorylation. Our data also show that PDTC-induced reduction of ROS is insufficient to completely block cellular tyrosine phosphorylation. This suggests that ROS contribute only in part to the regulation of cellular tyrosine kinases.
In addition to tyrosine phosphorylation, ROS can induce a specific response by activation or induction of transcription factors. The response of regulators of transcription to changes in the cellular redox status has been well described. p53, NF-κB, and AP-1, the family of JUN/FOS transcription factors, can be regulated in response to redox signaling. For example, on a posttranscriptional level, oxidants and reductants can regulate the activity of p53, AP-1, and NF-κB, likely through critical redox-sensitive cysteine residues in these proteins. Both, c-JUN and c-FOS levels are known to be induced by oxidants, including H2O2.33 This is consistent with our data showing upregulation of c-FOS, a component of AP-1, in MO7e cells as a response to H2O2 and GM-CSF. Interestingly, the UV-irradiation-induced increase in AP-1 activity can be decreased by antioxidants.34 However, oxidants have also been shown to decrease the AP-1–mediated gene induction.35 The regulation of AP-1 by redox processes shows an important role of ROS for mediating the biologic function of this transcription factor in cell growth and proliferation.36
The origin of ROS associated with activated cytokine receptors is unknown. There are several possible mechanisms, which could contribute to modulating ROS levels. The overall activity or protein expression of enzymes that generate ROS such as NADH (nicotinamide-adenine dinucleotide, reduced)/NADPH (nicotinamide-adenine dinucleotide phosphate, reduced) oxidases or xanthine oxidases could be elevated. Also, enzymes such as catalase, superoxide dismutase, glutathione peroxidase, or thiols such as thioredoxin or glutathione reduce ROS, and it is possible that activated cytokine receptors affect the activity of one of these pathways. Superoxide dismutase generates H2O2 from superoxide anions, while catalase reduces H2O2 to water. The glutathione peroxidases, which also include the phospholipid hydroperoxide glutathione peroxidase, reduce peroxides by using reduced glutathione (GSH) as an electron donor and generate the dimeric form of glutathione (GSSG).37 ROS levels can also be regulated by exogenous antioxidants such as α-tocopherols, β-carotene, or ascorbic acid.38 The two thiol group containing reducing drugs used in this study, PDTC and NAC, have been shown to directly reduce intracellular free radicals and modulate the intracellular redox status.39
The mechanisms which generate ROS have been best studied in cells involved in host defense mechanism. ROS are released by phagocytes including neutrophils, monocytes, and eosinophils, as well as by B cells through a mechanism called the respiratory burst. This respiratory burst is part of a defense mechanism aimed at the destruction of invading pathogens. The production of ROS starts with the activation of the membrane-associated NADPH oxidase and formation of superoxide, a key precursor of other ROS.40 41 However, the formation of ROS during a respiratory burst is for a very different biologic purpose than for intracellular signaling.
In any case, it is likely that further characterization of redox-sensitive proteins regulated through ROS will be helpful in further understanding the signaling of cytokine receptors. Of particular interest would be to first identify the specific ROS that is involved in HGF signaling. These specific ROS or set of ROS could be used directly to dissect the signaling pathways that are stimulated by these molecules. Similarly, overexpression of enzymes that are metabolizing these oxidants, like catalase, which has the ability to reduce H2O2, will be further helpful to understand the significance of this pathway. Overall, our results suggest that several HGFs induce rapid and sustained accumulation of ROS and further suggest that these ROS have the potential ability to modulate signal transduction involving tyrosine phosphorylation events. Finally, our data show that ROS, at least when added to cells in the form of H2O2, can mediate important biologic events, including cell cycle progression and migration. Further definition of the role of ROS in signaling are called for.
Supported by José Carreras International Leukemia Foundation fellowship FIJC-95/INT (to M.S.) and Grants No. CA01730 (to R.S.) and CA36167 (to J.D.G.) from the National Institutes of Health (NIH).
The publication costs of this article were defrayed in part by page charge payment. This article must therefore be hereby marked “advertisement” in accordance with 18 U.S.C. section 1734 solely to indicate this fact.
REFERENCES
Author notes
Address reprint requests to James D. Griffin, MD, Department of Adult Oncology, Dana-Farber Cancer Institute, Harvard Medical School, 44 Binney St, Boston, MA 02115; e-mail:james_griffin@dfci.harvard.edu.

This feature is available to Subscribers Only
Sign In or Create an Account Close Modal