Abstract
Neutrophils are recruited into the airway in the early phase of uncomplicated influenza A virus (IAV) infection and during the bacterial superinfections that are a significant cause of morbidity and mortality in IAV-infected subjects. In this report, we show that IAV accelerates neutrophil apoptosis. Unopsonized Escherichia colihad similar effects, although apoptotic effects of opsonized E coli were greater. When neutrophils were treated with both IAV and unopsonized E coli, a marked enhancement of the rate and extent of neutrophil apoptosis occured as compared with that caused by either pathogen alone. Treatment of neutrophils with IAV markedly increased phagocytosis of E coli. Simultaneous treatment of neutrophils with IAV and E coli also elicited greater hydrogen peroxide production than did either pathogen alone. IAV increased neutrophil expression of Fas antigen and Fas ligand, and it also increased release of Fas ligand into the cell supernatant. These findings may have relevance to the understanding of inflammatory responses to IAV in vivo and of bacterial superinfection of IAV-infected subjects.
INFLUENZA A VIRUS (IAV) infection induces apoptosis of cultured epithelial cells (eg, MDCK or HeLa cells)1,2 and of human peripheral blood monocytes.3 IAV also has been reported to induce apoptosis of airway epithelial cells and lymphoid cells in vivo in mice.4 Whether IAV induces apoptosis of neutrophils has not previously been reported. We have studied extensively the interactions of IAV with neutrophils because there is evidence that neutrophils may play a role in initial containment of IAV infection,5,6 but also because IAV-induced depression of neutrophil functions is a likely contributory factor to the development of bacterial superinfections during IAV infection.7,8 Such bacterial superinfections constitute a major cause of morbidity and mortality during IAV epidemics.7 Defects in neutrophil and monocyte chemotactic, oxidative, and bacterial killing functions have been documented in IAV infections.9,10 Moreover, it is been shown in animal models that there is a clear correlation between impairment of functions of these cells and predisposition to bacterial superinfections.11 We have shown that IAV has complex effects on neutrophil function. IAV causes depression of the ability of these cells to mount respiratory burst responses to the bacterial peptide, fMLP, or the phorbol ester, PMA.10,12,13 In addition, the virus itself induces activation of neutrophils as evidenced by stimulation of phosphoinositide and calcium metabolism and generation of H2O2.14 15 The current studies were undertaken to determine if IAV also induces apoptosis of neutrophils.
We also aimed to determine whether incubation of neutrophils with both IAV and bacteria would result in an enhancement of apoptosis compared with effects of either IAV or bacteria alone. Data regarding the effects of bacteria on neutrophil apoptosis are conflicting. Watson et al16 have reported that ingestion of serum-opsonized, heat-killed Escherichia coli induces neutrophil apoptosis. In contrast, Baran et al17 reported that ingestion ofStaphylococcus aureus promoted apoptosis of monocytes while inhibiting apoptosis of neutrophils. In any case, demonstration of an interaction between IAV and bacteria in induction of apoptosis could have relevance to bacterial superinfection of IAV infected subjects.
We report that IAV and E coli independently accelerate neutrophil apoptosis, and that the combination of E coli and IAV caused markedly greater apoptosis than either pathogen alone. The mechanisms of these effects are elucidated. The effects of opsonins on IAV or E coli–induced apoptosis are examined as well.
MATERIALS AND METHODS
Reagents.
Dextran, sodium citrate, RPMI 1640, propidium iodide (PI), Dulbecco’s phosphate-buffered saline with Ca2+ and Mg2+, Trypan blue stain, Wright–Giemsa stain, scopoletin, and horseradish peroxidase-type II were purchased from Sigma Chemicals Co (St Louis, MO). Ficoll-Paque was obtained from Pharmacia Biotech (Piscataway, NJ). Dulbecco’s phosphate-buffered saline without Ca2+ and Mg2+ was purchased from GIBCO-BRL (Grand Island, NY). Organic solvents were purchased from Fisher Scientific (Fairlawn, NJ). The phycoerythrin-labeled anti-CD95 murine monoclonal antibody and isotype control were obtained from PharMingen (SanDiego, CA). Rabbit polyclonal antibodies against the Fas antigen (C-20) and Fas ligand (C-20) and corresponding blocking peptides were obtained from Santa Cruz Biotechnology (Santa Cruz, CA). Rabbit immunoglobulins were obtained from Sigma. Recombinant human pulmonary surfactant protein D (rHSP-D) is a pulmonary surfactant collectin that binds to, and increases neutrophil uptake of, both IAV and E coli. RHSP-D was prepared as described.18 19
Neutrophil preparation.
Neutrophils from healthy volunteer donors were isolated to greater than 95% purity, as previously described, by using dextran precipitation, followed by a Ficoll-Hypaque gradient separation for removal of mononuclear cells and hypotonic lysis to eliminate contaminating erytrocytes.10 Neutrophils were used within 2 hours of isolation.
Virus preparation.
IAV strain H3N3 A/Bangkok/79 (Bangkok 79; gracious gift of Robert Webster, St Jude’s Hospital, Memphis, TN) was grown in the chorioallantoic fluid of 10-day-old embryonated hens’ eggs and purified on a discontinous sucrose density gradient as previously described.10
Bacterial preparations.
E coli (K-12 strain, unlabeled), fluorescein isothiocyanate (FITC)-labeled E coli (K-12 strain), and E coli–opsonizing reagent (polyclonal rabbit IgG) were purchased from Molecular Probes (Eugene, OR). Additionally viable E coli(K-12) were obtained from American Type Culture Collection (Rockville, MD), grown in our laboratory, and fixed with formalin for use in experiments. All bacteria used in experiments described in this report were killed. E coli suspensions in phosphate-buffered saline (PBS) were sonicated (for three 20-second intervals) to eliminate bacterial aggregates and washed three times in PBS before each experiment.
Measurement of bacterial uptake by neutrophils.
E coli uptake by neutrophils was measured incubating FITC-labeled bacteria with neutrophils, followed by evaluation of cell-associated fluorescence using a flow cytometer. For fluorescence measurements, 250 μg/mL (or 1.2 × 10⁹ bacteria/mL) of FITC-labeled E coli was incubated with neutrophils (ratio 24 bacteria per neutrophil), alone or in presence of various concentrations of IAV. After allowing E coli and neutrophils to interact for 1 hour at 37°C, the neutrophils were washed, resuspended in E coli–free PBS, and fixed with 2% paraformaldehyde. Cell-associated fluorescence was measured on a Becton Dickinson FACS scan 2 and analyzed using the Lysis II program (Becton Dickinson, Mountain View, CA) in presence of 0.02% of Trypan blue to quench extracellular flourescence.20
Assessment of apoptosis.
Neutrophil apoptosis was assessed by analysis of the percent of cells with hypodiploid nuclei by exposing the cells to the DNA-binding dye PI. The method was performed using a slight modification of the method decribed by Nicoletti et al.21 Neutrophils (5 × 10⁶/mL) were incubated for 1 hour with IAV, and/or E coli and/or rHSP-D at 37°C; washed; resuspended in RPMI 1640 supplemented with 4% human serum, 20 mmol/L HEPES buffer, 1% L-glutamine, 1% penicillin, and streptomycin pH 7.4; and left to incubate at 37°C. This incubation was carried in slowly rotating 15-mL conical, polypropylene tubes. At various periods of incubation, 200 μL of cell suspensions were centrifuged at 200g for 10 minutes, and the pellets were fixed in 1 mL of ice-cold 70% ethanol at 4°C for 60 minutes at least. Fixed cells were then washed with cold PBS with Ca2+ and Mg2+ and gently resuspended in 1 mL of PI solution (40 μg/mL in PBS with Ca2+ and Mg2+). The cells were finally incubated in the dark at room temperature for 15 minutes and analyzed on a Becton Dickinson FACS scan 2. Forward and side scatter of neutrophils were simultaneously acquired. The red fluorescence due to the PI staining of individual cells was collected under FL-2 and plotted against forward scatter. The FL-2 data were registered on a logarithmic scale. Cells debris were excluded from analysis by appropriately raising of the forward light scatter threshold. Five thousand cells of each sample were counted. All measurements were done under the same instrument settings and evaluated using the Lysis II program. To further differentiate apoptotic from lysed neutrophils, the cells were routinely examined using Trypan blue staining and light microscopy. Cells that were permeable to Trypan blue were considered lysed and nonviable. In addition, the degree of autolysis of cells was assessed by counting the overall number of cells present in samples treated with IAV or E coli as compared with control samples.
The validity of the PI assay for apoptosis was confirmed in some experiments through use of light microscopy in which cells were assessed for apoptotic morphology using Wright-Giemsa stain. Briefly, at each time point aliquots of each sample were fixed with methanol, stained, and the slides were examined by oil-immersion light microscopy (original magnification ×1,000). At least 400 cells of each preparation in different fields of view were counted. Apoptotic cells were easily distinguishable by their reduced volume, chromatin condensation, and nuclear fragmentation.
Assay for neutrophil expression or release of Fas or Fas-ligand.
Fas antigen expression was assessed using either the phycoerythrin-labeled CD95 monoclonal or unlabeled rabbit polyclonal anti-Fas (C-20) antibodies (followed by Fab2 fragments of FITC-labeled goat–anti-rabbit IgG; Jackson Laboratories, West Grove, PA). Fas Ligand expression on neutrophils was assessed using a rabbit polyclonal anti-Fas ligand preparation (anti-FasL C-20). During incubation of neutrophils with rabbit polyclonal anti-Fas or anti-FasL antibodies, nonspecific rabbit immunoglobulin was added to the buffer to inhibit Fc-receptor–mediated binding. Release of Fas ligand into the culture supernatant was measured by allowing neutrophil culture supernatants to incubate in 96-well plates overnight (to allow proteins to adhere to plastic), followed by washing and incubation with biotinylated rabbit polyclonal anti-Fas ligand antibody. Bound antibody was detected by incubation with streptavidin coupled to horseradish peroxidase, followed by peroxidase substrates (TMB substrate; BioRad, Hercules, CA), sulfuric acid to terminate the reaction, and assay of OD450 on a plate-reading device.
Assay of neutrophil H2O2 production.
H2O2 production by neutrophils was measured using the flourescent scopoletin assay as we have previously described.22
Statistical methods.
Statistical significance was determined using Student’s pairedt-test.
RESULTS
Bangkok 79 IAV accelerates neutrophil apoptosis.
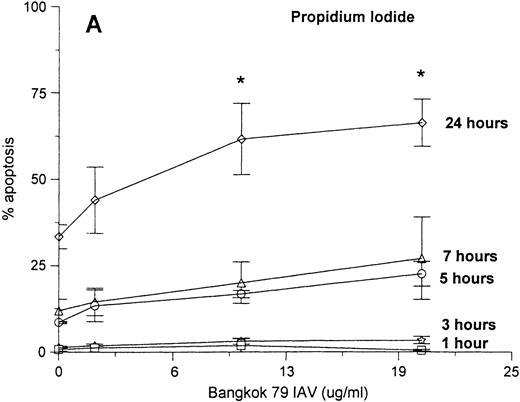
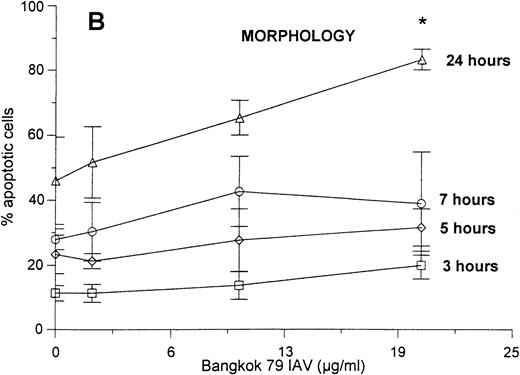
Neutrophils were incubated with control buffer or varying concentrations of Bangkok 79 IAV for 20 minutes at 37°C, washed, and incubated in RPMI (see Materials and Methods). At various time points (as indicated) aliquots of each sample were assessed for apoptosis by two different methods: the classic Wright-Giemsa stain to evaluate the morphologic characteristic of apoptosis, and PI fluorescence to measure the percent of cells with hypodiploid DNA. As shown in Fig1 there was a good correlation between the results obtained with these techniques. Both the graphs indicate that the virus caused apoptosis in a dose- and time-dependent manner, although the effect became statistically significant only at 24 hours. IAV did not significantly increase the extent of cell lysis in these experiments as determined by Trypan blue dye exclusion assay (eg, 93 ± 3% control cells were viable after 24 hours as compared with 92 ± 2% of cells treated with 20 μg/mL of IAV).
Neutrophil apoptosis induced by IAV. Neutrophil apoptosis assessed by PI-stained hypodiploid nuclei and flow cytometry (A) and Wright-Giemsa stain to detect the morphologic characteristics of apoptotic cells (B). A total of 5 × 10⁶/mL neutrophils were incubated with control buffer or 2, 10, and 20 μg/mL of Bangkok 79 IAV stock at 37°C. At indicated times, aliquots of each sample (1 × 10⁶ and 1 × 10⁵ cells for PI stain and Wright-Giemsa stain respectively) were assessed for apoptosis. Data are expressed (A) as percent of cells with hypodyploid DNA (counted 5,000 cells) or (B) as percent of cells with apoptotic characteristics with respect to the total number of cells counted (at least 400 in five different fields) and represent the mean ± SEM of at least four separate experiments. (*)Indicates where IAV significantly increased apoptosis (P ≤ .05).
Neutrophil apoptosis induced by IAV. Neutrophil apoptosis assessed by PI-stained hypodiploid nuclei and flow cytometry (A) and Wright-Giemsa stain to detect the morphologic characteristics of apoptotic cells (B). A total of 5 × 10⁶/mL neutrophils were incubated with control buffer or 2, 10, and 20 μg/mL of Bangkok 79 IAV stock at 37°C. At indicated times, aliquots of each sample (1 × 10⁶ and 1 × 10⁵ cells for PI stain and Wright-Giemsa stain respectively) were assessed for apoptosis. Data are expressed (A) as percent of cells with hypodyploid DNA (counted 5,000 cells) or (B) as percent of cells with apoptotic characteristics with respect to the total number of cells counted (at least 400 in five different fields) and represent the mean ± SEM of at least four separate experiments. (*)Indicates where IAV significantly increased apoptosis (P ≤ .05).
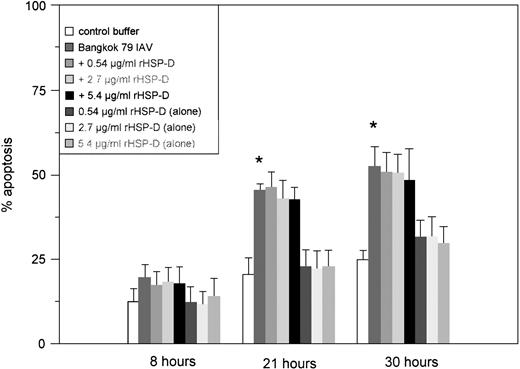
Pulmonary surfactant protein D (SP-D) is a collagenous lectin present in pulmonary secretions that binds to and aggregates IAV. Because we have previously shown that rHSP-D increases neutrophil uptake of IAV,23 we tested if preincubation of IAV with SP-D increases apoptosis induced by the virus. As shown in Fig2, IAV alone again significantly accelerated neutrophil apoptosis after 21 and 30 hours; however, rHSP-D did not cause apoptosis on its own, nor did it affect the rate or extent of apoptosis caused by the virus.
Effect of rHSP-D on IAV-induced neutrophil apoptosis. Various amounts of rHSP-D were preincubated alone or with 25 μg/mL of Bangkok 79 IAV for 30 minutes at 37°C before incubation (for 20 minutes at 37°C) with neutrophils (5 × 10⁶/mL). At indicated times the samples were assessed for apoptosis using the PI flow cytometry assay. Data are expressed as percentage of cells with hypodyploid nuclei and represent mean ± SEM of at least four separate experiments. As indicated by the (*), Bangkok 79 IAV alone caused significant (P < .05) apoptosis. Samples treated with IAV and rHSP-D together did not cause significantly greater apoptosis than did IAV alone. rHSP-D alone did not cause significant apoptosis.
Effect of rHSP-D on IAV-induced neutrophil apoptosis. Various amounts of rHSP-D were preincubated alone or with 25 μg/mL of Bangkok 79 IAV for 30 minutes at 37°C before incubation (for 20 minutes at 37°C) with neutrophils (5 × 10⁶/mL). At indicated times the samples were assessed for apoptosis using the PI flow cytometry assay. Data are expressed as percentage of cells with hypodyploid nuclei and represent mean ± SEM of at least four separate experiments. As indicated by the (*), Bangkok 79 IAV alone caused significant (P < .05) apoptosis. Samples treated with IAV and rHSP-D together did not cause significantly greater apoptosis than did IAV alone. rHSP-D alone did not cause significant apoptosis.
E coli accelerates neutrophil apoptosis.
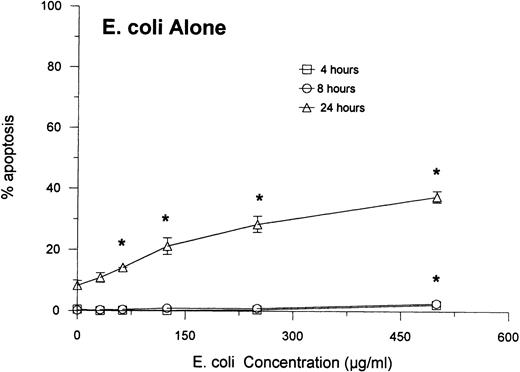
We incubated a fresh suspension of neutrophils with a range of E coli concentrations for 1 hour, followed by washing and further incubation in media. Figures 3 shows that unopsonized E coli accelerated apoptosis in a dose- and time-dependent manner. This effect of E coli was barely detectable after 8 hours of incubation, but clearcut apoptosis was present after 24 hours. These results could not be accounted for based on cell lysis. After 24 hours, only the highest concentration of E coli caused a significant reduction in neutrophil viability as compared with controls (ie, 84 ± 5% of cells were able to exclude Trypan blue, as compared with 93 ± 2% of control cells;P ≤ .05). At other concentrations of E coli (or other time points), the E coli–treated samples did not show significantly greater lysis than control cells. Therefore, the extent of apoptosis measured using the PI assay greatly exceeded the extent of lysis as determined by Trypan blue dye exclusion.
Neutrophil apoptosis induced by E coli. The indicated concentrations of E coli were incubated with neutrophils as described in Materials and Methods. (The ratios of bacterial particles to neutrophils were between 20 and 460 bacteria/neutrophil.) Results are expressed as percentage of cells with hypodyploid DNA as measured by the PI assay and represent the mean ± SEM of three separate experiments. (*)Indicates where E colialone caused significantly greater apoptosis than control buffer.
Neutrophil apoptosis induced by E coli. The indicated concentrations of E coli were incubated with neutrophils as described in Materials and Methods. (The ratios of bacterial particles to neutrophils were between 20 and 460 bacteria/neutrophil.) Results are expressed as percentage of cells with hypodyploid DNA as measured by the PI assay and represent the mean ± SEM of three separate experiments. (*)Indicates where E colialone caused significantly greater apoptosis than control buffer.
As shown in Table 1, opsonization of E coli with polyclonal IgG increased the extent of apoptosis resulting from E coli treatment. We have previously shown that opsonization with this antibody preparation or with rHSP-D increases neutrophil uptake of E coli.23 Opsonization of E coli with rHSP-D did not significantly alter apoptosis induced by the bacteria (Table 1). Table 1 also shows that treatment of neutrophils with E colisignificantly enhanced neutrophil Fas antigen expression. Opsonization of E coli with IgG, or with one concentration of rHSP-D, caused greater increase in Fas antigen expression than E colialone. The anti–E coli IgG preparation alone did not increase neutrophil apoptosis or Fas antigen expression (Table1).
Effects of Opsonizing Antibodies or rHSP-D on Neutrophil Apoptosis Induced by E coli
| Neutrophil Treatment . | Apoptotic Neutrophils (%) . | Fas Antigen Expression . |
|---|---|---|
| Control buffer | 5 ± 1 | 5 ± 0.4 |
| E coli alone | 26 ± 5* | 10 ± 2* |
| E coli + 18 μg/mL IgG | 36 ± 8*,† | 16 ± 2*,† |
| E coli + 36 μg/mL IgG | 38 ± 8*,† | 19 ± 1*,† |
| 36 μg/mL IgG alone | 4 ± 1 | 4.5 ± 1 |
| E coli + 0.13 μg/mL rHSP-D | 23 ± 4* | 10 ± 2* |
| E coli + 0.26 μg/mL rHSP-D | 30 ± 6* | 12.5 ± 2*,† |
| E coli + 1 μg/mL rHSP-D | 28 ± 4* | 12 ± 2* |
| E coli + 2 μg/mL rHSP-D | 24 ± 1* | 10 ± 2* |
Results represent mean ± SEM for five experiments (ie, 5 individual blood donors). Percentages of apoptotic neutrophils were assessed using PI as described in Fig 1. Fas antigen expression was assessed by flow cytometry using polyclonal rabbit anti-Fas antibodies. Fas antigen results are expressed in fluorescence units (ie, mean channel fluorescence of 5,000 cells). All assays were done after 20 hours of incubation of neutrophils with control buffer, E colialone, or E coli that had been preincubated with either opsonizing IgG or rHSP-D as indicated. Opsonizing IgG alone (in absence of E coli) did not cause any increase in percent of apoptotic cells compared with control (n = 3; data not shown).
P ≤ .05 as compared with neutrophil treated with buffer alone.
Indicates P ≤ .05 as compared with neutrophils treated withE coli alone (ie, no opsonizing agent).
Bangkok 79 IAV potentiates the apoptotic effect of E coli(and vice versa).
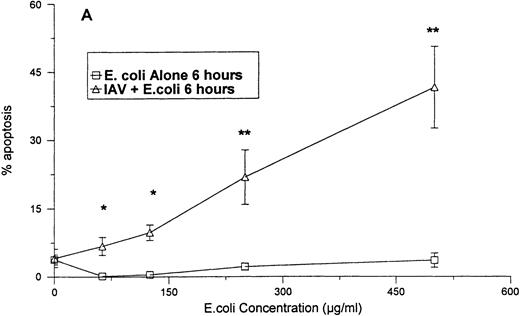
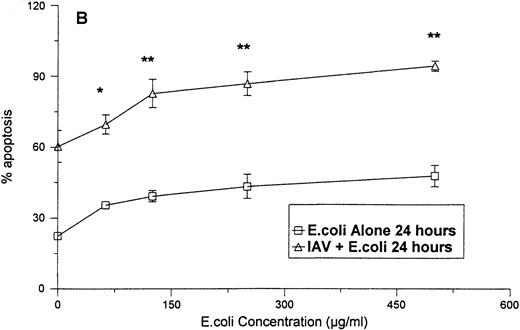
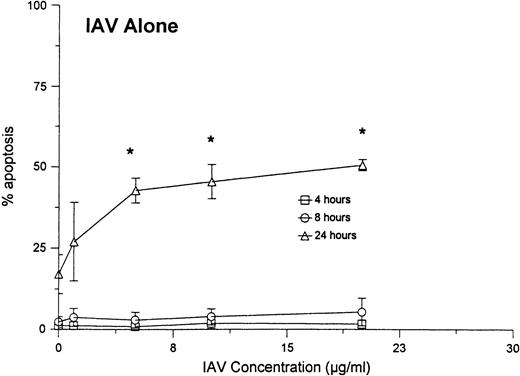
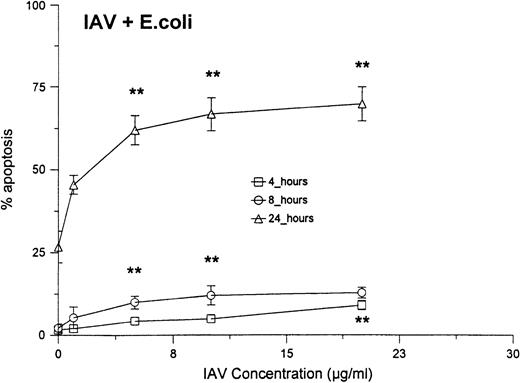
As shown in Fig 4A, no significant increase in apoptosis was seen when neutrophils were treated with various concentrations of E coli for 6 hours. However, when the cells were treated with the same concentrations of E coli in combination with a fixed concentration of IAV, significant increases the percentage of apoptotic neutrophils were found after 6 hours. The percentage of apoptosis was also significantly increased at 24 hours for samples treated with IAV and E coli, as compared with those treated with E coli alone. Figure 5compares the percentage of apoptotic neutrophils after treatment of the cells with either various concentrations of IAV alone, with percentage of apoptotic cells after treatment with the same concentrations of IAV, along with a fixed concentration of E coli. Although IAV alone did not cause significant increases in apoptosis after 4 or 8 hours, the combination of IAV and E coli did. Also the percentage of apoptosis was significantly greater at 24 hours in samples treated with the combination compared with IAV alone.
Neutrophil apoptosis induced by E coli alone orE coli in combination with 40 μg/mL of IAV. The degree of apoptosis induced by E coli alone or E coli in combination with 40 μg/mL of IAV after 6 (A) or 24 (B) hours of incubation are shown. Results are expressed as percentage of cells with hypodyploid DNA and represent the mean ± SEM of three separate experiments. At 24 hours all concentrations of E coli alone caused significantly more apoptosis than control buffer (P ≤ .05). (*)Indicates where the combination of E coli and IAV caused significantly greater apoptosis than E coli alone. (**)Indicates where the combination of E coliand IAV caused significantly greater apoptosis than either E coli or IAV alone.
Neutrophil apoptosis induced by E coli alone orE coli in combination with 40 μg/mL of IAV. The degree of apoptosis induced by E coli alone or E coli in combination with 40 μg/mL of IAV after 6 (A) or 24 (B) hours of incubation are shown. Results are expressed as percentage of cells with hypodyploid DNA and represent the mean ± SEM of three separate experiments. At 24 hours all concentrations of E coli alone caused significantly more apoptosis than control buffer (P ≤ .05). (*)Indicates where the combination of E coli and IAV caused significantly greater apoptosis than E coli alone. (**)Indicates where the combination of E coliand IAV caused significantly greater apoptosis than either E coli or IAV alone.
Neutrophil apoptosis induced by various concentrations of IAV alone or IAV in combination with 250 μg/mL of E coli.Neutrophils were incubated for 1 hour at 37°C with the indicated concentrations of IAV alone (top panel) or IAV in combination with 250 μg/mL (or 1.2 × 10⁹ particles/mL; or 240 bacteria/neutrophil) of E coli (bottom panel). (*)Indicates where IAV alone caused significantly greater apoptosis than control buffer. (**)Indicates where the combination of E coli and IAV caused significantly greater apoptosis than IAV or E colialone.
Neutrophil apoptosis induced by various concentrations of IAV alone or IAV in combination with 250 μg/mL of E coli.Neutrophils were incubated for 1 hour at 37°C with the indicated concentrations of IAV alone (top panel) or IAV in combination with 250 μg/mL (or 1.2 × 10⁹ particles/mL; or 240 bacteria/neutrophil) of E coli (bottom panel). (*)Indicates where IAV alone caused significantly greater apoptosis than control buffer. (**)Indicates where the combination of E coli and IAV caused significantly greater apoptosis than IAV or E colialone.
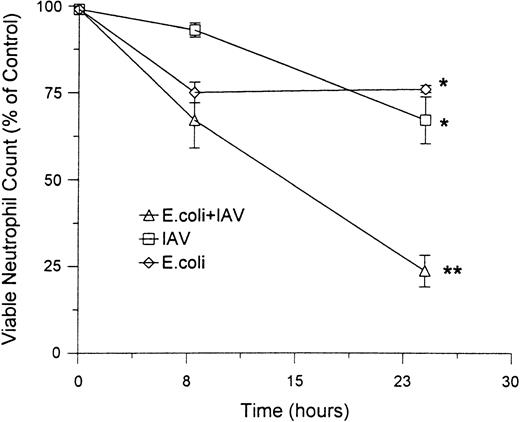
Combinations of E coli and IAV also induced a greater degree of cell lysis than either pathogen alone. Figure6 shows the extent of lysis (as judged by Trypan blue dye exclusion) caused by 25 μg/mL of IAV or 250 μg/mL of E coli alone or in combination. Neither pathogen alone caused significant increase in lysis as compared with control buffer. The combination of these concentrations of IAV and E coli did not increase the rate of lysis after 8 hours, but did cause a lysis of a significantly greater proportion of neutrophils than either buffer, IAV, or E coli alone after 24 hours. However, even after 24 hours, the extent of lysis induced by these concentrations of IAV andE coli (eg, approximately 25%) was substantially less than the extent of apoptosis induced (see Fig 3). Overall, the combination of IAV and E coli caused a very marked decline in the absolute numbers of viable neutrophils (absolute number of cells able to exclude Trypan blue remaining in culture) after 24 hours (Fig 6B).
Effect of IAV, E coli or the combination of IAV and E coli on a percentage of lysed neutrophils and a percentage of control viable neutrophils. These data were obtained on neutrophils treated with 25 μg/mL of IAV, 250 μg/mL of E coli, or both in combination as described in Fig 4. The top panel shows the percent neutrophil viability as determined by the percent of cells able to exclude Trypan blue. In the bottom panel, counts of absolute numbers of viable neutrophils were made (ie, number of cells able to exclude Trypan blue) and divided by number of viable neutrophils present in the control samples (×100 to give percent of control). (*)Indicates samples showing a significant reduction in percent viability as compared with control. (**)Indicates sample with a significant reduction in viable numbers of neutrophils as compared with control samples or samples treated with IAV or E coli alone.
Effect of IAV, E coli or the combination of IAV and E coli on a percentage of lysed neutrophils and a percentage of control viable neutrophils. These data were obtained on neutrophils treated with 25 μg/mL of IAV, 250 μg/mL of E coli, or both in combination as described in Fig 4. The top panel shows the percent neutrophil viability as determined by the percent of cells able to exclude Trypan blue. In the bottom panel, counts of absolute numbers of viable neutrophils were made (ie, number of cells able to exclude Trypan blue) and divided by number of viable neutrophils present in the control samples (×100 to give percent of control). (*)Indicates samples showing a significant reduction in percent viability as compared with control. (**)Indicates sample with a significant reduction in viable numbers of neutrophils as compared with control samples or samples treated with IAV or E coli alone.
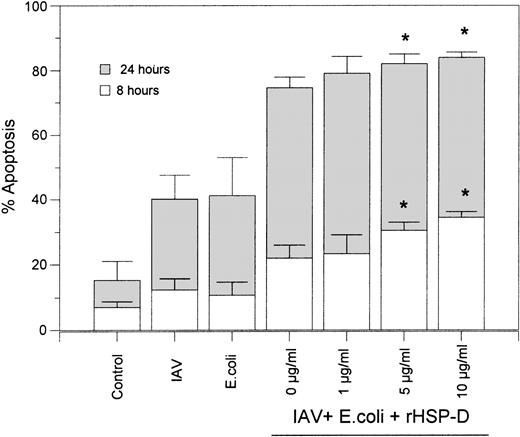
Using rhodamine-labeled E coli and fluorescent microscopy, we found that rHSP-D caused aggregation of E coli as previously described24 (data not shown). When rhodamine-labeled E coli and FITC-labeled IAV were incubated simultaneously with rHSP-D it was evident that bacterial aggregates also contained IAV (ie, both red and green fluorescence was present in the aggregates). Based on these results we tested whether rHSP-D would further increase the extent of apoptosis caused by IAV and E coli in combination. IAV and E coli were preincubated with several concentrations of rHSP-D for 30 minutes at 37°C, followed by addition of these preparations to neutrophils. As shown in Fig7, the additive effect of incubating neutrophils with IAV and E coli together was again evident in these experiments. Addition of rHSP-D caused a modest but statistically significant further increase in apoptosis after 8 or 24 hours. The effect of rHSP-D was marginal possibly due to the marked extent of apoptosis already induced by the combination of IAV and E colialone.
rHSP-D–enhanced apoptosis caused by the combination of IAV and E coli. The indicated concentrations of rHSP-D were preincubated with the combination of IAV (40 μg/mL) and E coli (250 μg/mL) for 30 minutes at 37°C, followed by addition of these samples to neutrophils and assessment of apoptosis at 8 and 24 hours as described in Fig 2. Samples of E coli or IAV alone or the combination of E coli and IAV (without rHSP-D) were run in parallel. Data are given as mean ± SEM of three separate experiments. (*)Indicates where rHSP-D significantly (P < .05) enhanced apoptosis as compared with the combination of E coli and IAV.
rHSP-D–enhanced apoptosis caused by the combination of IAV and E coli. The indicated concentrations of rHSP-D were preincubated with the combination of IAV (40 μg/mL) and E coli (250 μg/mL) for 30 minutes at 37°C, followed by addition of these samples to neutrophils and assessment of apoptosis at 8 and 24 hours as described in Fig 2. Samples of E coli or IAV alone or the combination of E coli and IAV (without rHSP-D) were run in parallel. Data are given as mean ± SEM of three separate experiments. (*)Indicates where rHSP-D significantly (P < .05) enhanced apoptosis as compared with the combination of E coli and IAV.
Neutrophil uptake of E coli.
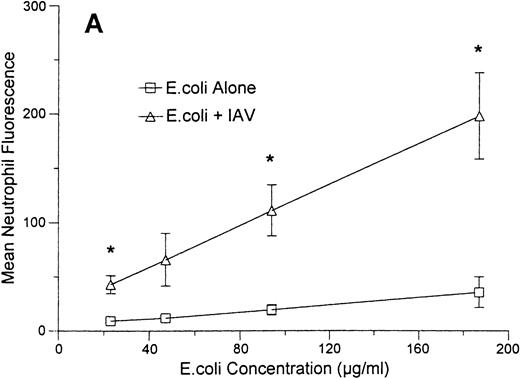
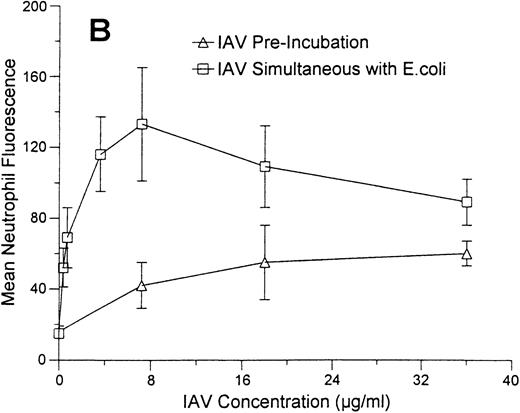
As shown in Fig 8A, incubation of neutrophils with a fixed concentration of IAV enhanced binding of various concentrations of FITC-labeled E coli to these cells. In these experiments the neutrophils were allowed to incubate with IAV and E coli simultaneously for 1 hour at 37°C and then to incubate with Trypan blue to quench extracellular flourescence. The results reflect mainly the amount of E coli that internalized by the cells (see Hartshorn et al23 for validation of this method). Figure 8B (upper curve) shows the effect of incubating neutrophils with a fixed concentration of E coli and increasing concentrations of IAV. All concentrations of virus significantly increased uptake of E coli. The maximum enhancement of E coli uptake was seen at a concentration of 7 μg/mL of IAV (neutrophil fluorescence was significantly greater at this concentration of IAV than at lower or higher concentrations of the virus). However, all concentrations of IAV tested (including 0.36 μg/mL) significantly increased E coli binding. Figure 8B (lower curve) also shows the effect of preincubating neutrophils with various concentrations of IAV, followed by washing off unbound virus and then incubating the cells with E coli. Using this method, the virus still enhanced binding of E coli to neutrophils, although only at the highest concentration of IAV shown.
Effect of IAV on neutrophil uptake of E coli.Mean neutrophil fluorescence after exposure to various concentrations of FITC-labeled E coli alone or in combination with IAV was assessed using flow cytometry as described. All samples were incubated with Trypan blue to quench extracellular fluorescence. (A) Results of incubating various concentrations of E coli alone (lower curve) or in combination with a fixed concentration of IAV (70 μg/mL). (*)Indicates where IAV caused a significantly increased (P < .05) binding of E coli in (A). (B) The effect of preincubating neutrophils with various concentrations of IAV followed by washing off unbound virus and testing binding of FITC-labeled E coli (“IAV Pre-incubation”; lower curve) or of simultaneously incubating various concentrations of IAV along with a fixed concentration of E coli (250 μg/mL) with neutrophils (“IAV simultaneous with E.coli”; upper curve). Results represent mean ± SEM of three separate experiments. In (B) all concentrations of IAV simultaneously incubated with neutrophils enhanced E coli binding significantly (P ≤ .05). The enhancement of uptake was significantly greater with 7.2 μg/mL of IAV than with any other concentration of the virus. For neutrophils preincubated with IAV (lower curve), only the highest concentration of IAV enhanced E coli binding.
Effect of IAV on neutrophil uptake of E coli.Mean neutrophil fluorescence after exposure to various concentrations of FITC-labeled E coli alone or in combination with IAV was assessed using flow cytometry as described. All samples were incubated with Trypan blue to quench extracellular fluorescence. (A) Results of incubating various concentrations of E coli alone (lower curve) or in combination with a fixed concentration of IAV (70 μg/mL). (*)Indicates where IAV caused a significantly increased (P < .05) binding of E coli in (A). (B) The effect of preincubating neutrophils with various concentrations of IAV followed by washing off unbound virus and testing binding of FITC-labeled E coli (“IAV Pre-incubation”; lower curve) or of simultaneously incubating various concentrations of IAV along with a fixed concentration of E coli (250 μg/mL) with neutrophils (“IAV simultaneous with E.coli”; upper curve). Results represent mean ± SEM of three separate experiments. In (B) all concentrations of IAV simultaneously incubated with neutrophils enhanced E coli binding significantly (P ≤ .05). The enhancement of uptake was significantly greater with 7.2 μg/mL of IAV than with any other concentration of the virus. For neutrophils preincubated with IAV (lower curve), only the highest concentration of IAV enhanced E coli binding.
Neutrophil hydrogen peroxide production in response to E coliand IAV alone or in combination.
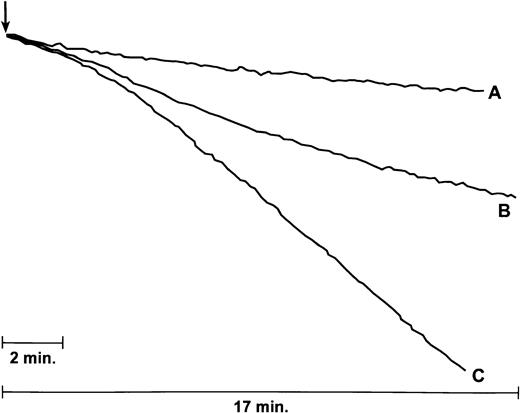
As shown in Fig 9, neutrophils that were treated with the combination of E coli and IAV produced H2O2 at a more rapid rate than cells treated with either IAV or E coli alone. The results shown are representative of four experiments in which the combination of IAV andE coli consistently elicited more H2O2than did either E coli or IAV alone. The mean ± SEM rate of H2O2 production (in nmol/L/3 min/4 × 106 cells) was 0.84 ± 0.16 for the combination of IAV and E coli as compared with 0.26 ± 0.05 and 0.19 ± 0.03, respectively, for IAV or E coli alone (P ≤ .02 for the combination as compared with either IAV orE coli alone). Rates of H2O2 production elicited by E coli alone were not significantly greater than rates of production by untreated neutrophils (data not shown). Addition of rHSP-D to the combination of IAV and E coli resulted in production of 1.16 ± 0.13 nmol/L/3 min of H2O2, which was significantly greater than IAV or E coli alone, but not significantly greater than the rate of H2O2 produced by the combination of IAV andE coli.
IAV increases neutrophil H2O2response to E coli. Results shown are tracings from an experiment in which either E coli (100 μg/mL; tracing A), IAV (6 μg/mL; tracing B), or both (tracing C) was added to a stirred suspension of neutrophils (where indicated by arrow) and H2O2 production was assessed by the decline in fluorescence of scopoletin. Aggregate results from four similar experiments are given in the text.
IAV increases neutrophil H2O2response to E coli. Results shown are tracings from an experiment in which either E coli (100 μg/mL; tracing A), IAV (6 μg/mL; tracing B), or both (tracing C) was added to a stirred suspension of neutrophils (where indicated by arrow) and H2O2 production was assessed by the decline in fluorescence of scopoletin. Aggregate results from four similar experiments are given in the text.
Effect of IAV and/or E coli on neutrophil expression of Fas antigen or Fas ligand.
As shown in Table 2, incubation with IAV for 3 or 20 hours increased neutrophil expression of Fas antigen as assessed using either the CD95 monoclonal antibody or rabbit polyclonal antibodies directed against Fas. To rule out the possibility that these results reflected a general increase in binding of antibodies, the effect of IAV on binding of either isotype control monoclonal antibody or nonspecific rabbit IgG was tested as well. Although a slight increase in isotype control antibody did result from IAV treatment, this increase was insufficient to account for the increase in binding of CD95 monoclonal antibodies. IAV did not alter binding of rabbit polyclonal IgG (data not shown). Also, the IAV-induced increase in binding of polyclonal anti-Fas antibodies was abrogated by preincubation of the antibodies with blocking peptide.
Effects of IAV, E coli, or the Combination of IAV and E coli on Neutrophil Expression of Fas Antigen
| Antibody . | Time (h) . | Control Buffer . | IAV . | E coli . | IAV + E coli . |
|---|---|---|---|---|---|
| CD95 | 3 | 36 ± 2 | 41 ± 3* | 39 ± 2 | 46 ± 4* |
| Isotype control | 3 | 4.4 ± 0.4 | 5.6 ± 0.3* | 7.3 ± 1* | 13.2 ± 2* |
| CD95 | 20 | 26 ± 3 | 35 ± 5* | 33 ± 4* | 40 ± 3*,† |
| Isotype control | 20 | 5 ± 1 | 7 ± 1* | 11 ± 2* | 16 ± 2*,† |
| Rabbit anti-Fas | 20 | 10 ± 1 | 16 ± 2* | 15 ± 2* | 49 ± 15*,† |
| Rabbit anti-Fas + blocker | 20 | 9.4 ± 1 | 11 ± 2 | 9 ± 2 | 26 ± 8 |
Results shown are mean ± SEM of three or more experiments. Expression of Fas antigen was assessed by flow cytometry using monoclonal antibody CD95 or polyclonal rabbit anti-Fas (C-20) antibodies. Values given are mean channel fluorescence for 5,000 cells. Controls included a mouse monoclonal of the same isotype as monoclonal antibody CD95, rabbit anti-Fas that had been preincubated with specific peptide blocker, and nonspecific rabbit IgG. Neutrophils were incubated with either control buffer, IAV, E coli, or IAV and E coli for 3 or 20 hours as indicated. IAV and/or E coli did not cause any increase in binding of nonspecific rabbit IgG (data not shown).
Significant increase (P ≤ .05) as compared with neutrophil treated with buffer alone.
P ≤ .05 as compared with neutrophils treated with IAV orE coli alone (ie, no opsonizing agent).
E coli also increased expression of Fas antigen (as assessed using either antibody) after 20 hours. Although the combination of IAV and E coli appeared to increase Fas antigen expression to a greater extent than either IAV or E coli alone, these results are more difficult to interpret because there was substantial variability in results between donors and because the combined treatment caused additive increases in isotype binding. Also note that the blocking peptide only partially eliminated the enhanced binding of Fas polyclonals in the case of neutrophils treated with IAV and E coli. The marked degree of neutrophil apoptosis and lysis occuring after 20 hours in samples treated with IAV and E coli may have precluded definitive determination of whether additive increases in Fas expression occured.
Fas ligand expression on neutrophils was significantly (although modestly) increased after 20 hours of treatment with IAV (see Table3). There was a substantial, and statistically significant, increase in release of Fas ligand into the culture supernatant in neutrophils treated with IAV for 20 hours.
Effects of IAV, E coli, or both IAV and E coli on Neutrophil Fas Ligand Expression and Neutrophil Release of Fas Ligand Into Supernatant
| Assay . | Time (h) . | Control Buffer . | IAV . | E coli . | IAV + E coli . |
|---|---|---|---|---|---|
| Neutrophil FasL | 20 | 7 ± 0.2 | 12 ± 13-150 | 10 ± 2 | 10 ± 2 |
| Neutrophil FasL + blocker | 20 | 10 ± 1 | 10 ± 2 | 10 ± 2 | 8 ± 2 |
| Supernatant FasL | 3 | 0.14 ± 0.02 | 0.14 ± 0.01 | 0.16 ± 0.01 | 0.22 ± 0.053-150 |
| Supernatant FasL | 20 | 0.9 ± 0.2 | 1.36 ± 0.13-150 | 1.3 ± 0.2 | 1.3 ± 0.3 |
Results represent mean ± SEM of four experiments. Fas ligand expression on neutrophils and supernatant Fas ligand were measured with anti-FasL (C-20) polyclonal antibodies using flow cytometry or enzyme-linked immunosorbent assay (ELISA), respectively. Flow cytometry results are mean neutrophil fluorescence values, while ELISA results are OD450 values.
Significant increase (P ≤ .05) as compared with neutrophil treated with buffer alone.
DISCUSSION
IAV induces apoptosis of epithelial cells1,2,4 and peripheral blood monocytes.3 IAV has been shown to upregulate Fas antigen expression in MDCK1 and HeLa cells25 providing one possible mechanism for induction of apoptosis. It has also been found that MDCK cells transfected with bcl-2 are resistant to IAV-mediated apoptosis2 and indeed show greater resistance to IAV replication as compared with control cells.26 These studies have generally found that inactivated IAV does not induce apoptosis and indicate an association between active viral replication and apoptosis. Pahl and Baeuerle27 have found, however, that expression of the IAV hemagglutinin alone activates transcription factor NF-κB in HeLa and 293 cells through a mechanism that involves cellular oxidant production. Activation of NF-κB could lead to elaboration of cytokines (eg, tumor necrosis factor) that in turn could accelerate apoptosis.
In this report we show for the first time that IAV accelerates neutrophil apoptosis. Cassidy et al28 have reported that IAV causes only abortive infection of neutrophils such that viral proteins are produced but infectious viral particles are not released into the supernatant. The time course of apoptosis induction by IAV (first clearly observable effect at ∼20 hours’ incubation) is compatible with virus-mediated induction of either cellular (eg, Fas antigen, cytokines) or viral protein expression. IAV increased expression of neutrophil Fas antigen to a moderate extent (see Table2). Neutrophil surface Fas ligand expression and release of Fas ligand into the culture supernatant were also increased by treatment with IAV (Table 3). Other factors may also be involved in IAV-induced neutrophil apoptosis. We have reported that IAV acts as a stimulus for neutrophil activation in its own right12,14,29 and also causes depression of neutrophil responsiveness to other stimuli.10,13 Our prior studies have shown the IAV-induced respiratory burst response occurs predominantly at an intracellular location,12 which could contribute to apoptosis.
We have also reported that preincubation of IAV with SP-D enhances neutrophil binding of the virus and increases the respiratory burst response triggered by the virus.30 In addition SP-D is able to protect neutrophils against the depressing effects of the virus on neutrophil respiratory burst responses to other stimuli.30 31 We anticipated that SP-D would also be found to alter the ability of IAV to cause neutrophil apoptosis. However, in experiments reported in this study, we show no such effect for reasons that remain unclear to us.
We also show that unopsonized E coli accelerates neutrophil apoptosis in a dose-related and time-dependent fashion, and that the degree of neutrophil apoptosis is enhanced when E coli is preincubated with opsonizing antibodies. Although we have reported that rHSP-D enhances neutrophil uptake of E coli to an extent similar to opsonizing antibodies, the effects of rHSP-D on E coli–related apoptosis were much more subtle (see Table 1). Watson et al16 have also found that antibody-opsonizedE coli accelerates apoptosis of neutrophils. Because inactivated bacteria were used in both studies, it is clear that bacterial replication is not necessary for induction of apoptosis. Watson et al16 showed that acceleration of neutrophil apoptosis by E coli was inhibited by addition of antioxidants. We show that E coli moderately increased neutrophil expression of Fas antigen after 20 hours, which may also have contributed to apoptosis. Fas antigen expression was increased to a greater extent by opsonized, rather than by unopsonized, E coli.
A striking finding of this report was that simultaneous incubation of neutrophils with IAV and E coli caused a substantial and significant enhancement (both in terms of rate and total extent) of apoptosis as compared with that induced by either pathogen alone. The addition of rHSP-D caused a modest but statistically significant further increase in apoptosis induced by the combination of IAV andE coli. Even in the absence of opsonizing agents, however, the combination of IAV and E coli was so profound as to lead to loss of the majority of neutrophils by 24 hours.
Our studies also provide insight into the mechanism of the cooperative acceleration of apoptosis by IAV and E coli. First, IAV was shown to cause increased neutrophil uptake of E coli. Uptake ofE coli was enhanced most strongly when neutrophils were incubated simultaneously with E coli and IAV (ie, the same conditions used in the apoptosis experiments). We have found that treatment of neutrophils with IAV causes a marked and rapid upregulation of CEA-related antigens on the neutrophil surface (K.L. Hartshorn, unpublished data, March 1998). Because these CEA-related antigens (also called nonspecific crossreacting antigens or CD66 and CD67) have been shown to be important binding sites for E coli on neutrophils,32 this may partly account for the enhancement of E coli uptake. Clearly further studies will be needed to clarify the mechanism of IAV-induced enhancement of E coli uptake, since this could be a contributory factor to the cooperative acceleration of apoptosis induced by the combination of IAV and E coli. Note that opsonizing antibodies both enhance E coli uptake and the degree of apoptosis in E coli–treated neutrophils.
Not only did IAV enhance binding of E coli, but it also increased the respiratory burst response elicited by the bacteria. This was unexpected since, as noted above, treatment of neutrophils with IAV depresses respiratory burst responses to fMLP or PMA.13 The respiratory burst elicited by the combination of IAV and E colisignificantly exceeded that produced by either pathogen alone. This cooperative induction of the neutrophil respiratory burst response may, therefore, be a contributory factor in the marked acceleration of apoptosis caused by the combination of IAV and E coli.
Finally, IAV induced increases in surface expression of Fas antigen and Fas ligand on neutrophils and release of Fas ligand into the supernatant. Neutrophil surface Fas antigen has been shown to contribute to spontaneous neutrophil apoptosis, whereas soluble Fas ligand may mediate effects on neighboring cells.33 We cannot reach any firm conclusion regarding whether IAV and E coli cooperate in inducing Fas antigen or Fas ligand expression or release, due to nonspecific changes seen with isotype controls. Possible cooperative effects of IAV and E coli in production of cytokines were not examined but could be involved in accelaration of apoptosis. For instance, Nain et al34 have reported synergistic induction of tumor necrosis factor release from monocytes treated with both IAV and lipopolysaccharide.34 Clearly further studies will be needed to sort out these possibilities. It will be of interest to determine if monocytes or macrophages (which also have been reported to undergo apoptotic changes after exposure to influenza virus35) also show enhanced expression of Fas antigen or release of Fas ligand in response to IAV.
In any case, our findings may have relevance to IAV infection, or to bacterial superinfection during IAV infection, in vivo. Neutrophils have been shown to contribute to the early inflammatory response to IAV infection5 6 and are also likely to be recruited to the airway in cases where bacterial superinfection occurs during IAV infection. IAV-induced apoptosis may be beneficial in the sense that inflammatory responses may be minimized during clearance of the virus. Alternatively, accelerated apoptosis of neutrophils could impair bacterial clearance in patients with IAV infection. Further studies will be needed to determine if IAV has cooperative apoptotic effects with more common respiratory bacterial pathogens.
ACKNOWLEDGMENT
We gratefully acknowledge the technical assistance of Jessica Miller.
Supported by Grant No. AI 23897 from the National Institutes of Health (to K.L.H.) and the Boston City Hospital Fund for Excellence.
The publication costs of this article were defrayed in part by page charge payment. This article must therefore be hereby marked “advertisement” in accordance with 18 U.S.C. section 1734 solely to indicate this fact.
REFERENCES
Author notes
Address reprint requests to Kevan Hartshorn, MD, Department of Medicine and Pathology, Boston University School of Medicine, 80 E Concord St, Boston, MA 02118.


This feature is available to Subscribers Only
Sign In or Create an Account Close Modal