Human cyclin A1 is a newly cloned, tissue-specific cyclin that is prominently expressed in normal testis. In this study, we showed that cyclin A1 was highly expressed in a subset of leukemia samples from patients. The highest frequency of cyclin A1 overexpression was observed in acute myelocytic leukemias, especially those that were at the promyelocyte (M3) and myeloblast (M2) stages of development. Cyclin A1 expression was also detected in normal CD34+progenitor cells. The expression of cyclin A1 increased when these cells were stimulated to undergo myeloid differentiation in vitro. Taken together, our observations suggest that cyclin A1 may have a role in hematopoiesis. High levels of cyclin A1 expression are especially associated with certain leukemias blocked at the myeloblast and promyelocyte stages of differentiation.
ABNORMAL CELL CYCLE regulation can lead to uncontrolled cell growth and cancer. Cyclins are positive regulators of the cell cycle and their overexpression is associated with uncontrolled cell growth and cancer. For example, cyclin D1 overexpression is linked to several cancers (eg, breast, esophageal, and lung cancers as well as lymphomas).1-5 The CDK4/6-cyclin D-Rb (retinoblastoma susceptibility gene product) pathway that controls the G1/S phase transition is altered in many cancers.6,7 Ectopic expression of cyclin A leads to adhesion-independent cell proliferation,8,9 and the cyclin A gene locus is integrated by the Hepatitis B virus in a hepatocellular carcinoma.10 Also, some tumor viruses express viral cyclin proteins that contribute to the cellular transformation mediated by these viruses.11 12
We recently cloned a human cyclin A-like gene (cyclin A1).13 The human cyclin A1 and the newly cloned murine cyclin A1 are highly tissue specific with prominent expression only in testis among normal tissues; and they are thought to function in meiosis during spermatogenesis.14 We also observed high expression of human cyclin A1 in several human leukemia cell lines,13 but whether it functions in promoting the cell cycle is still unknown. In this study, we report that cyclin A1 expression is especially prominent in promyelocytic and myeloblastic leukemias.
MATERIALS AND METHODS
Antibody production and affinity purification.
A 16 amino acid-peptide unique to the carboxy terminus of cyclin A1 (residue 421-437) was synthesized and coupled to the carrier protein keyhole limpet hemacyanin (KLH). The conjugate was used to immunize two rabbits using a standard protocol. The antibodies against the peptide were affinity-purified from the rabbit serum using an affinity column with peptide-coupled sepharose beads as described.15 This antibody, which we named antiA1C16, specifically recognized the recombinant cyclin A1 expressed in sf9 insect cells and the GST-cyclin A1 fusion protein expressed in Escherichia coli in our immunoblot and immunoprecipitation (IP) experiments (data not shown).
Northern blot and immunoblot analyses.
A collection of 28 leukemia samples from the University of Freiburg Medical Center (Freiburg, Germany) was studied for cyclin A1 expression by Northern blot and immunoblot. Total RNA was extracted from leukemia samples and Northern blot was performed using standard protocols.16 The full-length cDNA of cyclin A1 was used as a probe. Immunoblots were performed as described16 using antiA1C16. Leukemia cells were lysed in sodium dodecyl sulfate (SDS) sample buffer and the protein concentration was determined by protein assay (Bio-Rad protein assay kit; Bio-Rad, Hercules, CA). Thirty micrograms of total protein was loaded per lane for each sample and 10% gels were used for protein separation.
Reverse transcriptase-polymerase chain reaction (RT-PCR).
Eighty leukemia and preleukemia samples from a collection at Showa University School of Medicine (Tokyo, Japan) were analyzed for cyclin A1 and cyclin A expression by semiquantitative RT-PCR. RNA samples were prepared and RT-PCR was performed as previously described.17 The PCR was performed using the following primers and conditions: for cyclin A1, GCCTGGCAAACTATACTGTG (5′), CTCCATGAGGGACACACACA (3′); 94°C for 40 seconds, 60°C for 30 seconds, and 72°C for 40 seconds for 19 cycles. Twenty-five cycles were used for detection of cyclin A1 in normal myeloid cells. Two large introns are present between this pair of primers so that any contaminating genomic DNAs would not be amplified. The primers and conditions for cyclin A are as follows: TCCATGTCAGTGCTGAGAGGC (5′), GAAGGTCCATGAGACAAGGC (3′); 94°C for 1 minute, 60°C for 30 seconds, and 72°C for 45 seconds for 19 cycles. A set of primers for β-actin or glyceraldehyde-3-phosphate dehydrogenase (GAPDH) was also used in each reaction as positive controls; and RTs without the addition of reverse transcriptase were used as negative controls. The primer pairs for actin and GAPDH were as follows: TACATGGCTGGGGTGTTGAA/AAGAGAGGCATCCTCACCCT and CCATGGAGAAGGCTGGGG/CAAAGTTGTCATGGATGACC, respectively. For GAPDH, 13 cycles of PCR were performed. The RT-PCR products were transferred onto a nylon membrane (Amersham, Arlington Heights, IL) after agarose gel electrophoresis and a standard Southern blot analysis was performed using appropriate cDNAs as probes. The band intensities on Southern blots were analyzed by a densitometer and the ratios of cyclin A1 (or cyclin A) versus GAPDH were obtained for quantitative analyses.
Immunohistochemistry.
Immunohistochemistry studies were performed on formalin or B5 fixed sections of tissues and bone marrow biopsies obtained from the files of UCLA Center for the Health Sciences and Cedars-Sinai Medical Center. Sections were pretreated with trypsin 10 mg/50 mL in Tris buffer, pH 8.1, for 10 minutes at 37°C, followed by cyclin A1 antibody diluted 1:1,000 in phosphate-buffered saline (PBS) for 30 minutes. Slides were washed in PBS and incubated sequentially for 15 minutes with peroxidase-conjugated swine antirabbit Igs and rabbit antiswine Igs both diluted 1:50 (DAKO Corp, Carpinteria, CA). Staining was performed with the DAKO autostainer. Localization of reaction product was performed with the diaminobenzidene reaction as previously described.18 Intensity of staining was rated 1+ (weak) to 3+ (strong).
Isolation and induction of differentiation of hematopoietic stem cells.
Human CD34+CD38− and CD34+CD33+ cells were isolated by magnetic cell sorting followed by fluorescence-activated cell sorting (FACS) as described.17 These cells were cultured in RPMI medium containing stem cell factor (50 ng/mL), interleukin-3 (20 ng/mL), granulocyte-macrophage colony-stimulating factor (20 ng/mL), and 30% fetal calf serum (FCS). Cells were harvested on days 0, 2, 4, 6, and 8 for total RNA extraction. Cytospins were prepared concurrently, and cells at different stages of differentiation were analyzed as described.17 Because of the limited number of CD34+ cells that we could isolate, RT-PCR, as described above, was used to investigate if cyclin A1 was expressed in CD34+ cells.
Immunofluorescent staining and FACS analysis of cyclin A1 expression in CD34+ cells.
CD34-enriched cells (using the magnetic cell sorting kit; Miltenyi Biotec Inc, Bergisch Gladbach, Germany) were washed twice with PBS and stained with either monoclonal anti-CD34-fluorescein isothiocyanate (FITC) or monoclonal anti-CD4-FITC as a control in PBS containing 3% bovine serum albumin (BSA) for 30 minutes at room temperature. After washing, the cells were fixed in 3% paraformaldehyde, 2% sucrose, 1× PBS for 10 minutes at room temperature followed by permeabilization in 0.5% TX-100, 50 mmol/L NaCl, 3 mmol/L MgCl2, 200 mmol/L sucrose, 10 mmol/L HEPES, pH 7.4, for 10 minutes at room temperature. After washing, the cells were split into two halfs; one half was stained with a control rabbit antibody and the other half was stained with rabbit anti-cyclin A1 antibody. Both halves were then stained with a secondary goat antirabbit Ig-R-phycoerythrin (RPE). The cells were analyzed by FACS analysis for either CD34 or CD4 (green, FITC) and cyclin A1 (red, RPE). Unstained cells and cells stained by FITC-labeled antibody alone or RPE-labeled antibody alone were used to calibrate the FACS machine. For each sample, 20,000 cells were analyzed.
RESULTS
Localization of cyclin A1 in bone marrow and tissue sections.
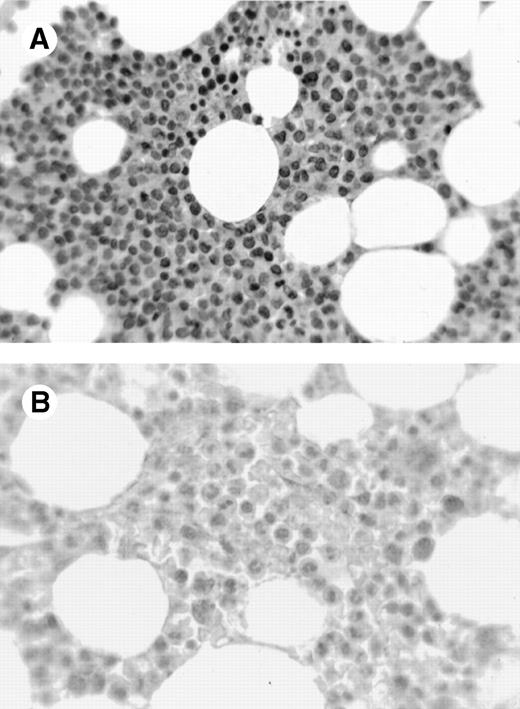
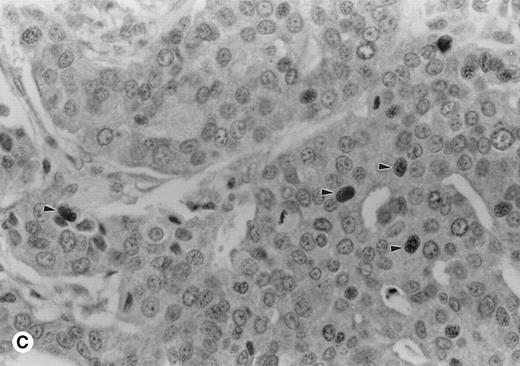
A variety of tissues were sampled for expression of cyclin A1 using immunohistochemistry on formalin- and B5-fixed paraffin-embedded sections. One case of acute promyelocytic leukemia showed strong 3+ nuclear staining in almost all leukemic cells (Fig 1A). In contrast, normal marrows had few positive cells with weak nuclear staining (Fig 1B). Cyclin A1 was also localized in a few solid tumors (Table 1). One case of adenocarcinoma of the colon showed speckled nuclear staining (Fig 1C). In contrast, the normal colonic mucosa showed only rare positive cells in the epithelium at the base of the crypts (data not shown). We were particularly impressed by strong expression in the promyelocytic leukemia shown in Fig 1A, which prompted us to investigate further the expression of cyclin A1 in leukemia samples.
Immunohistochemistry showing cyclin A1 expression in tissue sections. (A) Bone marrow biopsy from a case of acute promyelocytic leukemia (AML M3). Promyelocytes show strong nuclear staining for cyclin A1. (B) Normal bone marrow biopsy with negative or focal weak staining of myeloid precursors. (C) Adenocarcinoma of the colon with malignant cells showing nuclear staining for cyclin A1 (arrowheads). Hematoxylin counterstain original magnification × 400.
Immunohistochemistry showing cyclin A1 expression in tissue sections. (A) Bone marrow biopsy from a case of acute promyelocytic leukemia (AML M3). Promyelocytes show strong nuclear staining for cyclin A1. (B) Normal bone marrow biopsy with negative or focal weak staining of myeloid precursors. (C) Adenocarcinoma of the colon with malignant cells showing nuclear staining for cyclin A1 (arrowheads). Hematoxylin counterstain original magnification × 400.
Immunohistochemical Expression of Cyclin A1 in Nonhematopoietic Neoplasms
| Type of Cancer . | Positive/ Total* . |
|---|---|
| Seminoma | 1/1 |
| Hepatocellular carcinoma | 1/2 |
| Mesothelioma | 1/1 |
| Ganglioglioma | 0/1 |
| Breast cancer | 1/4† |
| Metastatic breast cancer | 0/1 |
| Osteosarcoma | 0/1 |
| Leiomyoma | 0/1 |
| Neuroblastoma | 0/1 |
| Malignant fibrous histiocytoma | 0/1 |
| Mucoepidermoid cancer | 0/1 |
| Squamous cancer of trachea | 0/1 |
| Colon carcinoma | 1/2† |
| Thyroid cancer | 0/1 |
Data are expressed as the number of positive samples over the total number of samples.
The staining in these positive samples was speckled.
Cyclin A1 is highly expressed in certain leukemias from patients.
We analyzed a collection of 23 acute myelogenous leukemias (AML), 1 acute lymphocytic leukemia (ALL), and 1 B-chronic lymphocytic leukemia (B-CLL) for cyclin A1 expression by Northern blot analysis. The French-American-British (FAB) classification of AML is as follows: M1, undifferentiated; M2, myeloblastic; M3, promyelocytic; M4, myelomonocytic; and M5, monoblastic. Figure2A and Table 2 show that cyclin A1 mRNA was detected by Northern blot in several leukemia samples. Positive samples include one of 2 samples of M1, 7 of 13 M2, 1 of 2 M3, 1 of 5 M4, 1 of 1 M5, and 1 of 1 ALL L2. The ALL L2 sample that expressed cyclin A1 also coexpressed the myeloid markers CD13 and CD65 (data not shown). Some of the M2, M3, and the ALL L2 samples (lanes 1, 3, 15, 18, and 20 in Fig 2A) had higher levels of cyclin A1 mRNA than did the control U937 cells (lane 27 in Fig 2A). Normal peripheral blood leukocytes did not have detectable levels of cyclin A1 by Northern blot, as previously shown.13
Northern blot and immunoblot showing cyclin A1 expression in leukemia samples. (A) Northern blot showing the expression of cyclin A1 in leukemia samples. Lanes 26 and 27 are NB4 and U937 cell lines, respectively. (B) Immunoblot show cyclin A1 protein level in leukemia samples. The diagnostic information for each lane of the Northern blot and immunoblot is summarized in Table 2.
Northern blot and immunoblot showing cyclin A1 expression in leukemia samples. (A) Northern blot showing the expression of cyclin A1 in leukemia samples. Lanes 26 and 27 are NB4 and U937 cell lines, respectively. (B) Immunoblot show cyclin A1 protein level in leukemia samples. The diagnostic information for each lane of the Northern blot and immunoblot is summarized in Table 2.
Summary of the Results of Fig 2A and B
| Patient No. . | Diagnosis . | Source of Cells . | Northern Blot . | Immunoblot . | ||
|---|---|---|---|---|---|---|
| Lane . | Result . | Lane . | Result* . | |||
| 1 | AML M2† | BM | 1 | ++ | 3 | 100 |
| 2 | AML M1 | PB | 2 | − | 1 | 4 |
| 3 | AML M2 | PB | 3 | + | NA | |
| 4 | AML M2 | PB | 4 | + | 5 | 58 |
| 5 | AML M2 | BM | 5 | − | NA | |
| PB | 14 | − | NA | |||
| 6 | AML M2 | BM | 6 | + | NA | |
| PB | 7 | + | NA | |||
| 7 | AML M4 | BM | 8 | + | NA | |
| 8 | AML M2 | BM | 9 | − | 7 | 8 |
| 9 | AML M4 | BM | 10 | − | NA | |
| 10 | AML M3 | BM | 11 | + | NA | |
| 11 | AML M4 | BM | 12 | − | NA | |
| 12 | AML M4 | BM | 13 | − | NA | |
| 13 | AML M2 | PB | 15, 20 | ++ | NA | |
| 14 | AML M3 | PB | 16 | − | NA | |
| 15 | AML M4 | PB | 17 | − | NA | |
| 16 | AML M2 | BM | 19 | − | 8 | 13 |
| 17 | AML M2 | PB | 22 | + | NA | |
| 18 | AML M2 | PB | 23 | − | NA | |
| 19 | AML M2 | BM | 24 | − | 4 | 2 |
| 20 | AML M5 | PB | 25 | + | 6 | 85 |
| 21 | AML M2 | PB | 28 | − | NA | |
| 22 | AML M1† | PB | 29 | + | 2 | 38 |
| 23 | AML M2 | BM | 30 | + | NA | |
| 24 | ALL L2‡ | PB | 18 | ++ | NA | |
| 25 | B-CLL | PB | 21 | − | NA | |
Abbreviations: BM, bone marrow; PB, peripheral blood; NA, not analyzed.
The densitometric readings (arbitrary units) of the cyclin A1 band are shown.
First relapse.
This ALL sample also expressed myeloid markers CD13 and CD65.
To determine whether the RNA levels correlated with the protein levels of cyclin A1 in the leukemia cells, we analyzed eight samples for which frozen cells were available by immunoblot using the antiA1C16 antibody. Cyclin A1 protein was present at higher levels in the samples that tested positive in Northern blot analyses (lanes 2, 3, 5, and 6 in Fig2B and Table 2) as contrasted with the samples that had undetectable levels of cyclin A1 on Northern blot (lanes 1, 4, 7, and 8 in Fig 2B and Table 2). We also analyzed two bone marrow samples from patients in remission, and these samples showed barely detectable cyclin A1 on immunoblots (data not shown).
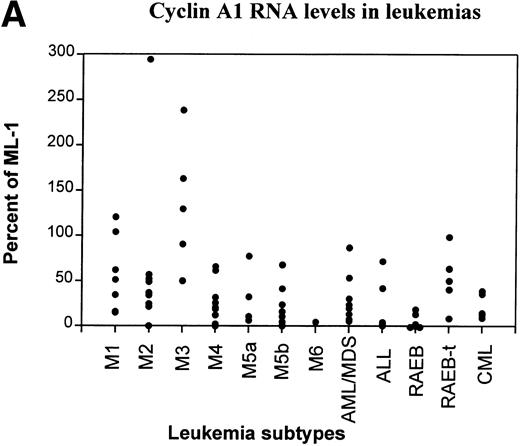
Another collection of 80 leukemia and preleukemia samples from patients was analyzed for cyclin A1 expression by semiquantitative RT-PCR. This collection included 7 M1, 9 M2, 6 M3, 12 M4, 4 M5a, 9 M5b, 1 M6, 8 ALL, 5 chronic myelocytic leukemia (CML), 5 refractory anemia with excess blasts (RAEB), 5 RAEB in transition (RAEB-t), and 9 acute myeloid leukemias that were preceded by myelodysplasia (AML/MDS). The level of expression of cyclin A1 mRNA was quantitated as the ratio of band intensity of cyclin A1 versus GAPDH on autoradiograms. In Fig 3A, the level of cyclin A1 in each sample was shown as a percentage of that expressed in the ML-1 myeloblast cell line. ML-1 cells were previously shown to express particularly high levels of cyclin A1.13 We arbitrarily placed the samples with more than 50% of expression of ML-1 in the category of high expressors of cyclin A1.
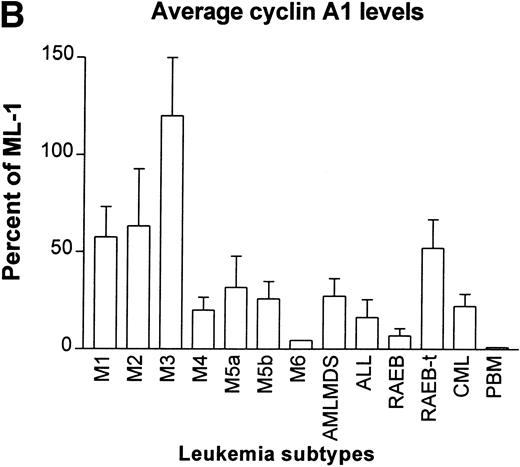
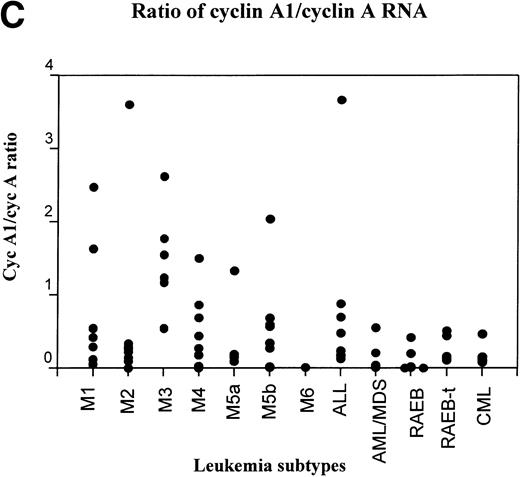
RT-PCR study of the expression of cyclin A1 in leukemia and preleukemia samples. (A) Dot plot show the level of expression of cyclin A1 in leukemia samples as a percentage of the level detected in the ML-1 myeloblast cell line. (B) Cyclin A1 mean levels of each group are shown. The statistical analysis of differences among the groups is discussed in the Results. (C) Ratio of cyclin A1/cyclin A is shown on a dot plot. Each dot represents one sample.
RT-PCR study of the expression of cyclin A1 in leukemia and preleukemia samples. (A) Dot plot show the level of expression of cyclin A1 in leukemia samples as a percentage of the level detected in the ML-1 myeloblast cell line. (B) Cyclin A1 mean levels of each group are shown. The statistical analysis of differences among the groups is discussed in the Results. (C) Ratio of cyclin A1/cyclin A is shown on a dot plot. Each dot represents one sample.
Many of the AML and a few other types of leukemia expressed high levels of cyclin A1. The M3 type (acute promyelocytic leukemia) consistently showed high levels of expression of cyclin A1. All 5 of the M3 samples expressed levels that were more than 50% of ML-1 and 3 of 5 expressed more than ML-1. RAEB was at the other end of the spectrum; 3 of the 5 samples had negligible levels of cyclin A1 (dots are on the horizontal axis in Fig 3A) and none of the rest expressed more than 20% of that expressed by ML-1. As shown in Fig 3B, the M3 samples had the highest and RAEB had the lowest mean level of cyclin A1 expression. Student’st-tests indicated that the level of cyclin A1 expression in M3 was significantly higher than that of all the other groups (P< .05). The level of expression in M2 was significantly higher than that of M4, ALL, and RAEB (P < .05). No statistically significant differences were found among other groups. One sample of normal peripheral blood mononuclear (PBM) cells was also analyzed by RT-PCR, and it showed a negligible level of cyclin A1 at 19 cycles of PCR (Fig 3B). However, cyclin A1 could be detected from these cells when 35 PCR cycles were used (data not shown).
The expression of cyclin A was also determined in this same collection of leukemias and the level of expression of cyclin A1 was compared with that of cyclin A (Fig 3C). About 25% of the AML samples (2/7 M1, 1/8 M2, 5/6 M3, 2/12 M4, 2/11 M5, and 1/9 AML/MDS) had higher levels of cyclin A1 compared with cyclin A. The pattern of cyclin A1/cyclin A ratios closely resembled the absolute level of cyclin A1 (compare Fig3C and A). All the samples that expressed more cyclin A1 than cyclin A were AML, whereas all of the RAEB, RAEB-t, CML, and ALL cases showed higher levels of cyclin A than cyclin A1. Similar to the absolute levels of cyclin A1 shown in Fig 3A and B, the M3 subtype had the most samples (5/6) expressing more cyclin A1 than cyclin A and had the highest average of cyclin A1/cyclin A ratio, whereas the RAEB samples had the lowest average (data not shown).
Cyclin A1 is expressed in normal myeloid cells.
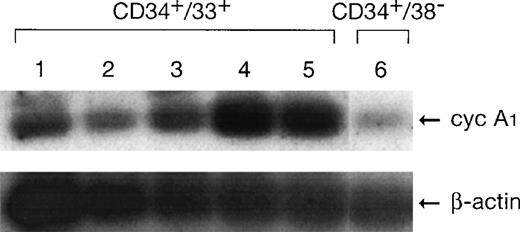
RT-PCR was used to investigate if cyclin A1 was expressed in CD34+ cells. As shown in Fig 4, both CD34+CD38− and CD34+CD33+ cells expressed cyclin A1 at a level that was detectable at 25 cycles of PCR. In other nonhematopoietic tissues that we tested, cyclin A1 mRNA either required 35 PCR cycles for detection or was undetectable (data not shown). The expression level in CD34+CD33+ cells was higher than that in early hematopoietic stem cells (CD34+CD38−). The level in this cohort of cells increased over time and peaked at day 6 of in vitro culture. At day 6, the cell culture mainly contained myelocytes (39%), promyelocytes (28%), granulocytes (20%), and blast/myeloblast (10%).17 The CD34+CD33+ cell population at day 0 mainly contained myeloblasts. Therefore, the more mature myeloid cell populations expressed more cyclin A1 than the less mature cells. The level of cyclin A1 expressed in these normal cells was lower than the amount of cyclin A1 that was expressed in the myeloblastic leukemia samples.
Expression of cyclin A1 in normal human myeloid cells detected by RT-PCR. Lanes 1 through 5, CD34+CD33+ cells at days 0, 2, 4, 6, and 8 of in vitro culture. Lane 6, CD34+CD38−cells.
Expression of cyclin A1 in normal human myeloid cells detected by RT-PCR. Lanes 1 through 5, CD34+CD33+ cells at days 0, 2, 4, 6, and 8 of in vitro culture. Lane 6, CD34+CD38−cells.
To confirm further that cyclin A1 was expressed in CD34+cells, we performed immunofluorescent staining and FACS analysis using CD34+ enriched peripheral blood white cells. A monoclonal anti-CD34-FITC was used to stain CD34 and a rabbit anti-cyclin A1 followed by a secondary antirabbit-RPE was used to stain cyclin A1. A monoclonal anti-CD4-FITC and an irrelevant rabbit antibody were used as controls. As shown in Fig 5A, most of the cells that stained positive for CD34 (right of the vertical line) also stained positive for cyclin A1 (upper right square), although many cyclin A1 positive cells were CD34− (upper left square), whereas in the control experiment, the anti-CD4–stained population of T lymphocytes stained mostly negative for cyclin A1 (Fig5C, lower right square) under the same experimental conditions. When anti-cyclin A1 staining was compared with staining by the control rabbit antibody in the CD34+ cell populations, the anti-cyclin A1 gave a significantly higher positivity than the control antibody (Fig 5B), but no difference was observed between the anti-cyclin A1 and control antibody in the CD4+ cell populations (Fig 5D). These results indicated that most of the CD34+ cells also expressed cyclin A1.
FACS analysis showing the costaining of CD34 and cyclin A1 in myeloid progenitors. (A) Dot plot shows that CD34 and cyclin A1 are costained in the population of the upper right square. Lower left square: cyclin A1−/CD34−; lower right square: cyclin A1−/ CD34+; upper left square: cyclin A1+/ CD34−. (B and D) Histograms show the specificity of cyclin A1 staining. The staining for cyclin A1 (shaded curve) is significantly stronger than the staining for the control rabbit antibody (solid curve) in the CD34+ cell population (shown in [B]), but no difference was observed between the cyclin A1 (shaded) and control (solid) staining in the CD4+ T-lymphocyte population (D). (C) Dot plot shows that the control CD4-stained cells are negatively stained for cyclin A1 (lower right square). CD34+, peripheral blood progenitor cells were partially purified for use in these experiments, as described in the Materials and Methods.
FACS analysis showing the costaining of CD34 and cyclin A1 in myeloid progenitors. (A) Dot plot shows that CD34 and cyclin A1 are costained in the population of the upper right square. Lower left square: cyclin A1−/CD34−; lower right square: cyclin A1−/ CD34+; upper left square: cyclin A1+/ CD34−. (B and D) Histograms show the specificity of cyclin A1 staining. The staining for cyclin A1 (shaded curve) is significantly stronger than the staining for the control rabbit antibody (solid curve) in the CD34+ cell population (shown in [B]), but no difference was observed between the cyclin A1 (shaded) and control (solid) staining in the CD4+ T-lymphocyte population (D). (C) Dot plot shows that the control CD4-stained cells are negatively stained for cyclin A1 (lower right square). CD34+, peripheral blood progenitor cells were partially purified for use in these experiments, as described in the Materials and Methods.
DISCUSSION
Cyclin A1 is a newly discovered cyclin that shows highly specific expression in testis.13,14 The murine cyclin A1 is expressed at high levels in germ cells undergoing meiosis in testis14 and is thought to function in meiosis. Preliminary studies by us detected cyclin A1 in several human leukemia cell lines.13 This prompted us to investigate whether cyclin A1 was expressed in leukemia samples from patients. Using several different techniques, high levels of cyclin A1 expression were frequently found in AML, especially the M3 subtype. Although we also found cyclin A1 expression in normal hematopoietic cells, the leukemia samples that express high levels of cyclin A1 appear to express higher levels than do the normal cells. Our immunohistochemistry studies showed that almost all cells in 1 sample of the M3 subtype expressed much higher levels of cyclin A1 than the few cyclin A1-expressing cells in the normal bone marrow (Fig 1A and B). Our immunoblots also detected much less cyclin A1 in normal remission bone marrow cells than in several leukemia samples from the same individuals. Finally, the detection of cyclin A1 in normal hematopoietic cells by RT-PCR required more PCR cycles as compared with some of the leukemia cells with high cyclin A1 expression. These results suggest that cyclin A1 is overexpressed in certain leukemias such as the M3 subtype. Cyclin A1 expression was also detected in a few solid cancers by immunohistochemistry. However, because only a limited number of samples were examined, the significance of this observation needs to be further studied.
Cyclin A1 transcripts were present in normal myeloid CD34+/CD33+ and CD34+/CD38− cells and higher levels were observed in cell populations containing predominantly promyelocytes and myelocytes than in populations containing mainly early hematopoietic stem cells (CD34+/CD38−) or myeloblasts (CD34+/CD33+). Our immunofluorescent study also showed that CD34+ cells are stained positive for cyclin A1. These results suggest that cyclin A1 may have a role in the proliferation and differentiation of myeloid cells. The functions of cyclin A1 in cell cycle regulation is still not known. However, we have some evidence that cyclin A1 is regulated in the mitotic cell cycle and that it interacts with the cell cycle regulators E2F-1 and Rb.18a We also observed that B- and C-Myb partially contribute to the transcriptional activation of cyclin A1 (Müller et al, unpublished data). B- and C-Myb are known to be expressed in testis and hematopoietic cells, respectively,19 20 which could explain the expression of cyclin A1 in hematopoietic cells. The clarification of the exact function of cyclin A1 in hematopoiesis will await the study of cyclin A1 deletional murine models.
One potential explanation for cyclin A1 overexpression in AML leukemias could be that the leukemia cells that express high levels of cyclin A1 may be arrested at the stage of differentiation when cyclin A1 is normally expressed. That is to say, the AML cells mirror the level of expression of cyclin A1 of their normal counterpart at the same stage of hematopoietic development. However, this hypothesis cannot explain why only a fraction of leukemia samples in the same lineage, and presumably at similar stages of differentiation, expressed cyclin A1 at high levels (Table 2).
Our results suggested that the M3-type leukemia samples that we examined by RT-PCR showed high expression levels of cyclin A1. We are currently further investigating the expression of cyclin A1 in M3 leukemia and are studying the potential molecular mechanism for this prominent expression. No obvious genetic alterations have been found at the cyclin A1 locus in the highly expressing leukemia samples. Several of the leukemia cell lines (ML-1, U937, and NB4) with prominent expression of cyclin A1 were examined for cyclin A1 gene amplifications by Southern blot, but none was found.13 Possibly, cyclin A1 overexpression is indirectly caused by another genetic alteration in leukemia. Whether cyclin A1 in some way contributes to the development of certain leukemias or simply is associated with these leukemias is still under study.
During the review of this manuscript, another study of cyclin A1 expression in leukemia was published.21 In that report, RT-PCR was used to examine the expression of cyclin A1 in various leukemia samples. Although it was not a quantitative study, their results also showed that cyclin A1 was detected in the majority of myeloid and undifferentiated hematological malignancies that is in agreement with our results.
ACKNOWLEDGMENT
The authors thank Dr Michael Lill and Malka Frantzen for providing the normal human CD34-enriched cells.
Supported by National Institutes of Health grants, the Parker Hughes Trust, and C. and H. Koeffler Fund. H.P.K. is a member of the Jonsson Cancer Center and holds the Mark Goodson Chair in Oncology Research.
The publication costs of this article were defrayed in part by page charge payment. This article must therefore be hereby marked “advertisement” in accordance with 18 U.S.C. section 1734 solely to indicate this fact.
REFERENCES
Author notes
Address reprint requests to Rong Yang, PhD, Division of Hematology/Oncology, Davis Research Building, RM 5066, Cedars-Sinai Research Institute, UCLA School of Medicine, 8700 Beverly Blvd, Los Angeles, CA 90048; e-mail: yangr@CSMC.edu.



![Fig. 5. FACS analysis showing the costaining of CD34 and cyclin A1 in myeloid progenitors. (A) Dot plot shows that CD34 and cyclin A1 are costained in the population of the upper right square. Lower left square: cyclin A1−/CD34−; lower right square: cyclin A1−/ CD34+; upper left square: cyclin A1+/ CD34−. (B and D) Histograms show the specificity of cyclin A1 staining. The staining for cyclin A1 (shaded curve) is significantly stronger than the staining for the control rabbit antibody (solid curve) in the CD34+ cell population (shown in [B]), but no difference was observed between the cyclin A1 (shaded) and control (solid) staining in the CD4+ T-lymphocyte population (D). (C) Dot plot shows that the control CD4-stained cells are negatively stained for cyclin A1 (lower right square). CD34+, peripheral blood progenitor cells were partially purified for use in these experiments, as described in the Materials and Methods.](https://ash.silverchair-cdn.com/ash/content_public/journal/blood/93/6/10.1182_blood.v93.6.2067.406k26_2067_2074/5/m_blod40626005ax.jpeg?Expires=1769196711&Signature=q6qJ6DmCs-qD6GkqEqJMH8vYMhNpkomdT0Mz2fBjKOcU2x5hBmneRWkZ19zD2oTRdxorqj1JzwPr9~8IFwkzn4WpCn5kYm-zLp280qVPFjMMKWnIGsPgONLlV19JE4vc0L0rHinGozZVBgrID6uEvtLqtWsyea4pBvnUA~Ik~PeVbYqeyY5Oh~BwE1PjE0BzahBzpBUj88wEwsJaJ3l8Lkou8wxJZSYcm3JJ9D955mgnYDU20j77iYMqd5u0dalIHJhZUk-tUr9jhPP5OU-s4XZTAAPk~I16QWOkt8wy1ZtnmvSX6V8BH97suKcLA9LONWIjcscjez928SBx-eFaYg__&Key-Pair-Id=APKAIE5G5CRDK6RD3PGA)
![Fig. 5. FACS analysis showing the costaining of CD34 and cyclin A1 in myeloid progenitors. (A) Dot plot shows that CD34 and cyclin A1 are costained in the population of the upper right square. Lower left square: cyclin A1−/CD34−; lower right square: cyclin A1−/ CD34+; upper left square: cyclin A1+/ CD34−. (B and D) Histograms show the specificity of cyclin A1 staining. The staining for cyclin A1 (shaded curve) is significantly stronger than the staining for the control rabbit antibody (solid curve) in the CD34+ cell population (shown in [B]), but no difference was observed between the cyclin A1 (shaded) and control (solid) staining in the CD4+ T-lymphocyte population (D). (C) Dot plot shows that the control CD4-stained cells are negatively stained for cyclin A1 (lower right square). CD34+, peripheral blood progenitor cells were partially purified for use in these experiments, as described in the Materials and Methods.](https://ash.silverchair-cdn.com/ash/content_public/journal/blood/93/6/10.1182_blood.v93.6.2067.406k26_2067_2074/5/m_blod40626005bx.jpeg?Expires=1769196711&Signature=sIYDdCSLc6dTc28HLy~6gF9pMuuRAYhXxvu8AbfFK3HfBpnMi226QEF-9XbL5fupliS3R61judBYvrnyrov-CIhKwC6Oo~PSNmCVCFNvJyoRSfDTTav8gvPPVUURCIL9YI5IvuZDNPBNtV7duUTCve38UAlBeskMPOJhE8KfmvspOKua~InJC80UldiM-54iSDZA4HQS-Byf3UCRcTm~pZM7TsBX3lEge8Ir7hScQZ-2KdMBu9Gtc7ItBEAIqtiJfXwm18KEBPjG1oNTrO~giJ2egxwRdUKgP~ZSDaY~UNW3WjC-Fh8VzDHZFkeqMpJtIKN7T-aBJu~eHxC4fuR2SA__&Key-Pair-Id=APKAIE5G5CRDK6RD3PGA)
![Fig. 5. FACS analysis showing the costaining of CD34 and cyclin A1 in myeloid progenitors. (A) Dot plot shows that CD34 and cyclin A1 are costained in the population of the upper right square. Lower left square: cyclin A1−/CD34−; lower right square: cyclin A1−/ CD34+; upper left square: cyclin A1+/ CD34−. (B and D) Histograms show the specificity of cyclin A1 staining. The staining for cyclin A1 (shaded curve) is significantly stronger than the staining for the control rabbit antibody (solid curve) in the CD34+ cell population (shown in [B]), but no difference was observed between the cyclin A1 (shaded) and control (solid) staining in the CD4+ T-lymphocyte population (D). (C) Dot plot shows that the control CD4-stained cells are negatively stained for cyclin A1 (lower right square). CD34+, peripheral blood progenitor cells were partially purified for use in these experiments, as described in the Materials and Methods.](https://ash.silverchair-cdn.com/ash/content_public/journal/blood/93/6/10.1182_blood.v93.6.2067.406k26_2067_2074/5/m_blod40626005cx.jpeg?Expires=1769196711&Signature=B7RZ9N5lM9H5w39~cR6zRf9h0OzVG20kMqEDGCTNmNCBKYWJQS0xCxqw8Lc2lHXWggF0fIZQyTNeJFn6VRq0MotJLBshhrExDq103-n4UB-7dir7knRS1onDHLdJwN7yTIBe19jg~ntgnLBgfTrUC4K5oqizZYA4bXvDUNwPj6crAdS8Vu7zpqVIZpSysuywPv0jXi3IMECLTbx8pyXneD49nR50bdkG04Ce9VpvDQ~-ypOtCpYQM5wkC8B6zNjF1FbrQBGPky79sto-dW74ycPiGLuNIwOuSNTCe47FhIAyH-Da6smBsMcaEDgu0tqSWd5EgxvJrBAIZkU4IYQiPA__&Key-Pair-Id=APKAIE5G5CRDK6RD3PGA)
![Fig. 5. FACS analysis showing the costaining of CD34 and cyclin A1 in myeloid progenitors. (A) Dot plot shows that CD34 and cyclin A1 are costained in the population of the upper right square. Lower left square: cyclin A1−/CD34−; lower right square: cyclin A1−/ CD34+; upper left square: cyclin A1+/ CD34−. (B and D) Histograms show the specificity of cyclin A1 staining. The staining for cyclin A1 (shaded curve) is significantly stronger than the staining for the control rabbit antibody (solid curve) in the CD34+ cell population (shown in [B]), but no difference was observed between the cyclin A1 (shaded) and control (solid) staining in the CD4+ T-lymphocyte population (D). (C) Dot plot shows that the control CD4-stained cells are negatively stained for cyclin A1 (lower right square). CD34+, peripheral blood progenitor cells were partially purified for use in these experiments, as described in the Materials and Methods.](https://ash.silverchair-cdn.com/ash/content_public/journal/blood/93/6/10.1182_blood.v93.6.2067.406k26_2067_2074/5/m_blod40626005dx.jpeg?Expires=1769196711&Signature=Js4E4krettZIg-zcwnNU0NAkQTiFuTKeuT~m3OY~new8VFHqfEvjYsxzuJsruJGgk13IS-5ezv8UtxXskDC-zX4l1DOkAnr3NCmKuTr6ISVZVN4jDUmP~akK8qz4p~Qqt-NQ0zejAWwfk8LGfrTnd0kyuDjwtVi5jmm41IbVoV1gOi4MDqdNugVf4moOuWu-UWVwg7Hw1fLMv5xUS0So-qB5HJ1AheaH6shqHTFWvGhz78C0eXOIJQ-bSABfonQbRTHGRhXrGM83c-IQDlPwDxZgPee4VUQtMQNVGZqKKIxmOZwM6pzEL01jY-jcNrocbemsTq7ImBArrIZBQsiDrw__&Key-Pair-Id=APKAIE5G5CRDK6RD3PGA)
This feature is available to Subscribers Only
Sign In or Create an Account Close Modal