Abstract
After allogeneic bone marrow transplantation (allo-BMT), recipient alveolar macrophages (AM) are gradually replaced by AM of the donor origin. An influx of mononuclear phagocytes of donor origin to the lung is responsible for the repopulation, but the detailed kinetics remain unclear. We therefore studied 24 BMT recipients who underwent bronchoalveolar lavage (BAL) from 24 to 83 days after BMT. AM cell number, size, morphology, proliferating ability, and genotype of AM were measured. Before day 50, the number and size of AM in BAL fluid were similar to those of normal nonsmokers. However, after day 50, the mean number of AM increased threefold and the mean cell size decreased due to the increase of small AM. These small cells are presumably of donor origin based on DNA fingerprinting analysis and based on fluorescence in situ hybridization for the Y chromosome in a sex-mismatched case. Immunohistochemistry and cell cycle analysis demonstrated that the increase in AM number coincided with a remarkable increase of AM expressing proliferating cell nuclear antigen, suggesting that small AM are proliferating. This is the first report representing that augmented proliferation of donor AM in situ may contribute to the reconstitution of AM population after BMT.
ALVEOLAR MACROPHAGES (AM) represent a major component of the alveolar spaces and play important roles in host defense. Human lungs are estimated to contain 2.3 × 10¹⁰ AM, with 50 to 100 AM per alveolus. This number is constant in the steady state, although animal studies demonstrate that large numbers of AM are continuously lost from the lung, mainly through the airways.1,2 Some reports demonstrate that peripheral blood monocytes (PBM) are precursors of AM and that a continuous influx of PBM to the lung is responsible for maintaining AM numbers.3,4 However, studies using various techniques have failed to show any significant emigration of PBM into the alveolar spaces unless the latter are stimulated.5,6Other reports show that AM are proliferating in the lung.7-10 Previously, we demonstrated directly that both murine and human AM proliferate in vitro in the presence of granulocyte-macrophage colony-stimulating factor (GM-CSF), which is produced in the lung parenchyma.11 12
In the murine model, AM population kinetics have been investigated using radiation chimeras, in vivo 3H-thymidine labeling, or89Sr injection. Although the half life of AM is as short as 11 days,9 they maintain a stable population for long periods with little or no influx of blood monocytes to the lung. Using fractionated radiation-induced chimeras that preserve AM precursors in the lungs, Tarling et al8 demonstrated that approximately 60% of AM are of recipient origin even 11 months after bone marrow transplantation (BMT). Population renewal is due to in situ proliferation of AM of recipient origin. Thus, murine AM are supplied mainly by self-replication, but a small population of precursor cells is derived from the circulation.
On the other hand, our knowlege of human AM is limited amd mostly based on in vitro or ex vivo experiments. AM numbers are maintained for a long period in patients with monocytopenia after chemotherapy,13 suggesting that local proliferation contributes to the homeostasis of AM. However, large gaps in our knowledge exist because studying the kinetics of human AM in vivo is difficult.
In this regard, BMT is a valuable system to study human AM in vivo. Repopulation of AM with cells of donor origin provides a way of investigating AM dynamics, even though recipient lungs may not be normal due to the conditioning therapies or graft-versus-host reactions. Inflammation may promote the entry and repopulation of donor cells in the lung. Thomas et al14 studied Y chromosomes in AM obtained from allogeneic BMT (allo-BMT) recipients of sex-mismatched cases and reported that AM are replaced within 90 days after BMT by cells of donor origin. These observations suggest that influx of PBM to the lung is the crucial mechanism for the reconstituting AM population after BMT. After this report, no study has detailed the kinetics of AM replacement.
In this study, we investigated the kinetics of AM replacement after allo-BMT. We found that the number of AM in the bronchoalveolar lavage (BAL) fluid was similar to the control level before day 50 but increased strikingly after day 50. This increase coincided with the increase of AM expressing the proliferating cell nuclear antigen, suggesting the augmented proliferation of AM in situ after day 50. Taken together with previous reports,14 the proliferation of AM in situ may contribute to the reconstitution of the AM population after allo-BMT.
MATERIALS AND METHODS
BMT Recipients and Control Subjects
Recipients were prepared for BMT with different regimens according to their primary diseases. The day of BMT was defined as day 0. Each recipient received grafts from siblings with identical HLA typing. Cyclosporin A was administered intravenously or orally from day −2 through day 170 as prophylaxis for graft-versus-host disease (GVHD). No recipient had cytokine therapy, including GM-CSF, macrophage colony-stimulating factor (M-CSF), or granulocyte colony-stimulating factor (G-CSF) before and after BMT.
A total of 24 recipients were enrolled in this study. Recipient profiles and conditioning regimens are given in Table 1. As a control, 10 normal nonsmokers underwent BAL and venipuncture. The recipients underwent the first BAL to screen for cytomegalovirus (CMV) pneumonitis from 24 to 83 days after BMT. Three of these recipients volunteered to undergo the second BAL on day 69, 76, or 83. Peripheral blood samples were obtained at the time of BAL. For CMV screening in BAL fluid, we performed cytological evaluation for inclusion bodies or rapid centrifugal cultures.15 Recipients with any pulmonary complication diagnosed at the time of BAL or with any evidence of graft-rejection within 3 months post-BAL were excluded from the study. To avoid the influence of smoking to BAL cell population, we also excluded smokers and ex-smokers from the study. The recipients and control subjects were informed of the investigational nature of this study and gave written informed consent. The protocol was approved by the institutional review boards of the Tokyo Metropolitan Komagome Hospital.
Characteristics of BMT Recipients at the Time of BAL
| Recipient No. . | Age (yr) . | Sex . | Primary Diagnosis . | Grade of Acute GVHD . | Type of Conditioning . | Day of BAL . | |
|---|---|---|---|---|---|---|---|
| Donor . | Recipient . | ||||||
| 1 | 20 | F | F | CML | 0 | I | 24 |
| 2 | 36 | M | F | AML | I | III | 32, 83 |
| 3 | 17 | M | M | SAA | 0 | II | 34 |
| 4 | 20 | F | F | AML | I | I | 34 |
| 5 | 19 | F | M | MDS | 0 | I | 35 |
| 6 | 24 | F | M | MDS | 0 | I | 41 |
| 7 | 22 | M | M | ALL | I | III | 41 |
| 8 | 20 | M | M | ALL | I | III | 41, 69 |
| 9 | 41 | M | F | CML | 0 | I | 41 |
| 10 | 25 | F | F | AML | 0 | I | 43 |
| 11 | 37 | F | F | CML | 0 | I | 46 |
| 12 | 26 | F | M | SAA | 0 | II | 47 |
| 13 | 20 | M | M | CML | 0 | I | 47 |
| 14 | 39 | M | F | CML | 0 | I | 48 |
| 15 | 29 | M | M | SAA | 0 | II | 48 |
| 16 | 23 | F | M | ALL | I | III | 48 |
| 17 | 33 | M | M | ALL | 0 | III | 48, 76 |
| 18 | 38 | F | M | MDS | 0 | I | 55 |
| 19 | 38 | M | M | CML | I | I | 55 |
| 20 | 26 | M | M | CML | 0 | I | 55 |
| 21 | 42 | M | M | CML | II | I | 56 |
| 22 | 31 | F | F | CML | 0 | I | 65 |
| 23 | 27 | F | F | AML | 0 | I | 69 |
| 24 | 27 | F | F | CML | 0 | I | 83 |
Abbreviations: CML, chronic myelogenous leukemia; SAA, severe aplastic anemia; AML, acute myelogenous leukemia; MDS, myelodysplastic syndrome; ALL, acute lymphocytic leukemia; aGVHD, acute graft-versus-host-disease; I, busulfan + cyclophosphamide; II, cyclophosphamide + total lymphocyte irradiation; III, cytosine arabinoside + cyclophosphamide + total body irradiation.
BAL and Preparation of Cells
BAL was performed as described previously.16 Briefly, a flexible fiber optic bronchoscope (Olympus BF10 or 1T10; Olympus, Tokyo, Japan) was inserted into a segmental bronchus of the middle lobe. Three aliquots of 50-mL sterile saline were instilled through a lavage channel and immediately aspirated. Retrieved saline was pooled, placed on ice, and immediately treated according to the protocol described below.
The lavage fluid was filtered through a sterile cell strainer (Becton Dickinson, Rutherford, NJ), collected in a polypropylene tube, and centrifuged at 1,000 rpm for 10 minutes. The supernatant was stored at −80°C. The cell pellet was washed twice with cold Hank’s solution and resuspended in RPMI1640/10% fetal calf serum (FCS). The number of cells was counted by a hemocytometer and cell differentials were made with a modified Wright-Giemsa stain (Diff-Quick; Kokusai Siyaku Co, Ltd, Kobe, Japan). To estimate corrected cell number in epithelial lining fluid (ELF), urea concentration in both BAL supernatant and plasma was measured using a commercially available kit (No. 535-A; Sigma Diagnostics, St Louis, MO). The corrected cell number was then calculated using the formula: Corrected cell number/mL ELF = (urea concentration of plasma/urea concentration of BAL supernatant) × (number of BAL cells/mL).17
Peripheral blood mononuclear cells (PBMC) were obtained from blood cells by Ficoll-Hypaque sedimentation and four phosphate-buffered saline (PBS) washes. PBMC (3 × 10⁶) or BAL cells (1 × 10⁶) suspended in 5 mL of RPMI1640/10% FCS were placed in 35-mm polystyrene plates (Miles Laboratories Inc, Naperville, IL) that had been coated with human AB serum at 4°C overnight and were incubated for 40 minutes at 37°C. The plates were washed three times with PBS, and the adherent cells were removed by gentle scraping with a plastic cell scraper, washed, and resuspended in RPMI. To purify monocytes or AM, the adherent cell suspension was incubated at 4°C with anti-CD2 and anti-CD19 immuno-magnetic beads (Dynal, Oslo, Norway) at a ratio of 40:1 beads to target cells. After 30 minutes, the magnetic beads and contaminating lymphocytes were removed with a magnet and the step was repeated. More than 98% of the resultant cells were defined as monocytes or AM by their morphology and nonspecific esterase staining.
Morphology and Size of AM
For microscopic observation of BAL cells or purified macrophages, cytospin preparations were made on glass slides by centrifugation at 500g for 2 minutes and stained with Diff-Quick. The size of AM on these preparations was measured as the longest axis by direct observation using a Olympus OB-M photomicrometer. For each preparation, 50 AM were measured and the mean diameter was calculated.
Detection of AM Proliferation
DNA cell cycle analysis.
Purified AM (1 × 10⁶) were fixed with 70% ethanol at 4°C for 15 minutes, washed twice with cold PBS, and resuspended in 100 μg/mL bovine pancreatic ribonuclease/PBS solution. After 10 minutes of incubation at room temperature, propidium iodide solution was added to a final concentration of 10 μg/mL. After cells were passed through a cell strainer to remove aggregations, cell cycle analysis was performed using a FACScan cytometer (Becton Dickinson). PBMC from healthy donors and murine leukemia cell line P-815 were used as controls for resting and proliferating cells, respectively. The number of cells in G1, S, and G2/M compartments were obtained using the sum of rectangles model. At least 10,000 cells were scored per sample.
Detection of proliferating cell nuclear antigen.
To detect proliferating cell nuclear antigen (PCNA) in AM, 1 × 10⁵ of AM were fixed with 70% ethanol for 15 minutes at 4°C immediately after cytospin preparation. The slides were washed twice with PBS, immersed in cold PBS overnight, dried, and stocked at −80°C before use. The slides were incubated with the murine anti-PCNA monoclonal antibody (Dako, Glastrup, Denmark) for 1 hour at room temperature followed by treatment with horseradish peroxidase-conjugated antimurine Ig for 30 minutes. Between each incubation, the sections were washed three times with PBS. The peroxidase reaction was developed by adding 0.02% 3-3′-diaminobenzidine, 0.005% hydrogen peroxide, and 10 mmol/L sodium azide in 50 mmol/L Tris-buffer (pH 7.6) for 10 minutes. Counterstaining was performed by hematoxylin.
Fluorescence In Situ Hybridization (FISH) for Detection of Y Chromosome in AM
In situ hybridization was performed as described previously.18 Cytospin preparation of AM were wet-fixed with 70% ethanol for 20 minutes at 4°C and dried at room temperature. Slides were pretreated with RNase and proteinase K before in situ hybridization. For hybridization, 10 ng of biotinylated DY Cocktail probe (Oncor, Gaithersburg, MD) was mixed in 20 mL of hybridization buffer (55% formamide, 1× SSC, 10% dextran sulfate), denatured at 75°C for 10 minutes, and applied to the slides previously denatured at 70°C for 2 minutes in 70% formamide, 2× SSC. Hybridization was performed at 37°C overnight. Posthybridization washes were performed at 42°C for 15 minutes, twice in 50% formamide/1× SSC and once at room temperature in 1× SSC. Fluorescence signals were visualized and amplified by fluorescein isothiocyanate (FITC)-conjugated avidin and biotinylated antiavidin system (Vector Laboratories, Burlingame, CA). After rinsing, slides were stained with the combined use of antifading buffers (PBS containing 90% glycerol, 1.25% diazabicyclo-[2,2,2]-octane [Sigma Chemical Co] and 0.5 μg/mL propidium iodide [Sigma Chemical Co], and PBS containing 90% glycerol and 1 mg/mL D-phenylenediamine [Sigma Chemical Co]). The fluorescein yellow-green signals and propidium iodide-stained red chromosomes were excited at 450 to 490 nm (filter B) using a Olympus fluorophoto microscope and were photographed with Fujichrome 100 film (Fujifilm, Tokyo, Japan). The size of AM was measured by direct observation using a photomicrometer as described above.
DNA Fingerprinting of Genomic DNA From AM or Monocytes
For DNA fingerprinting, we applied the method described by Wong et al.19 Briefly, genomic DNA was extracted from purified AM, monocytes, or whole blood by incubating in sodium dodecyl sulfate (SDS)/protease solution followed by phenol/chloroform extraction and ethanol precipitation. The extracted DNA was digested to completion with HinfI, and 2 μg of DNA was electrophoresed in 0.7% agarose gel until a 2.3-kb marker DNA fragment had migrated 20 cm from the gel origin on control tracks. DNA was transferred by Southern blotting to Hybond N membrane (Amersham, International plc, Amersham, UK), fixed by UV irradiation, prehybridized, and hybridized overnight with a 32P-labeled cocktail of single locus, minisatellite probes MS1 + MS31, MS43a, MS8, and g3 (Cellmark Diagnostics, Oxfordshire, UK), which recognize chromosomes 1p33-p35, 7p22-pter, 12q24.3-qter, and 7q36-qter, respectively. After washing in 0.1× SSC at 65°C, the membrane was autoradiographed from 20 to 46 hours at −80°C in the presence of an intensifier screen.
Statistical Analysis
Data were analyzed by Stat view-J 4.5 using Macintosh computer (Apple Japan, Inc, Tokyo, Japan) and expressed as mean ± standard error. The difference between two groups was evaluated using the Student’s t-test. A P value less than .05 was considered significant.
RESULTS
Characterization and Time Course of BAL Cells From BMT Recipients
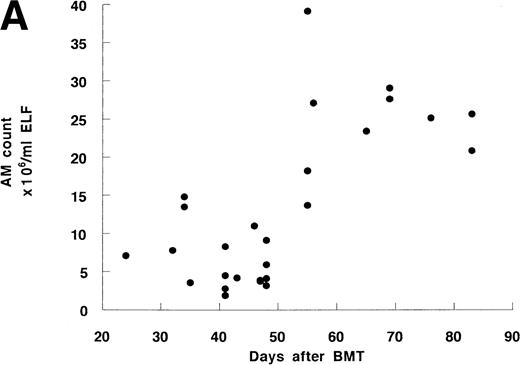
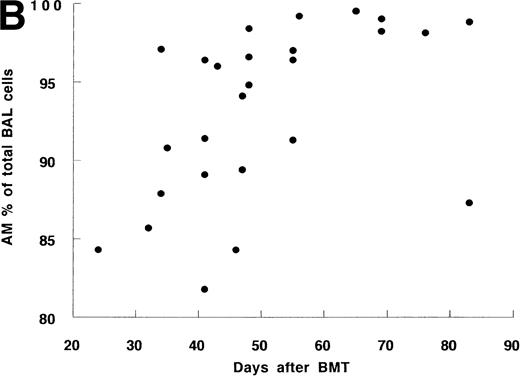
Twenty-four BMT recipients underwent 27 BAL, including 3 second BAL and 10 normal nonsmokers underwent BAL as a control. BAL recovery was similar in both groups. There was a strong correlation between the number or percentage of AM and the time after BMT (Fig 1A and B). Before day 50, the percentage and number of AM from 17 recipients were 91.3% ± 1.3% and 6.4 ± 0.9 × 10⁶/mL, respectively, which were similar to those in controls (91.6% ± 1.5% and 8.2 ± 1.6 × 10⁶/mL, Table 2). The mean values after day 50 (96.5% ± 1.3% and 25.0 ± 2.2 × 10⁶/mL, respectively) were significantly higher than those before day 50 or of controls. This tendency was confirmed in 3 recipients who underwent serial bronchoscopy; in each case the percentage and number of AM increased at the later time point (Table 3).
The time course of BAL cells after allo-BMT. (A) Cell number of AM in ELF. Total 27 BAL were performed. (B) Percentage of AM in BAL cells. Some data are overlaid in both (A) and (B).
The time course of BAL cells after allo-BMT. (A) Cell number of AM in ELF. Total 27 BAL were performed. (B) Percentage of AM in BAL cells. Some data are overlaid in both (A) and (B).
BAL Findings in BMT Recipients and Controls
| Groups . | No. of BAL . | Recovery of BAL (%) . | AM . | |
|---|---|---|---|---|
| % Total Cells . | Counts/ELF (×106/mL) . | |||
| BMT recipients | ||||
| Before day 50 | 17 | 62.4 ± 1.2 | 91.3 ± 1.2 | 6.4 ± 0.9 |
| After day 50 | 10 | 62.4 ± 2.0 | 96.5 ± 1.3* | 25.0 ± 2.2* |
| Controls | 10 | 63.1 ± 3.2 | 91.6 ± 1.5 | 8.2 ± 1.6 |
P < .001 compared with normal nonsmoker.
A Comparison of the Cell Number and Percentage of AM in Three Recipients Between the First and Second BAL
| Recipient No. . | Day . | AM . | |
|---|---|---|---|
| Count/ELF (×106/mL) . | % Total Cells . | ||
| 2 | 32 | 7.8 | 85.7 |
| 83 | 20.8 | 95.1 | |
| 8 | 41 | 2.8 | 89.1 |
| 69 | 27.6 | 92.3 | |
| 17 | 48 | 3.2 | 96.6 |
| 76 | 25.1 | 98.1 | |
| Recipient No. . | Day . | AM . | |
|---|---|---|---|
| Count/ELF (×106/mL) . | % Total Cells . | ||
| 2 | 32 | 7.8 | 85.7 |
| 83 | 20.8 | 95.1 | |
| 8 | 41 | 2.8 | 89.1 |
| 69 | 27.6 | 92.3 | |
| 17 | 48 | 3.2 | 96.6 |
| 76 | 25.1 | 98.1 | |
There were no significant changes in the numbers of lymphocytes and neutrophils during the whole period studied (data not shown). There was no correlation between the number or percentage of AM and primary disease (CML v non-CML), conditioning therapies (with vwithout total body irradiation), or grade of GVHD. These data indicate that AM maintain their number despite severe bone marrow suppression and even show a remarkable increase after day 50.
Morphology of AM After Allo-BMT
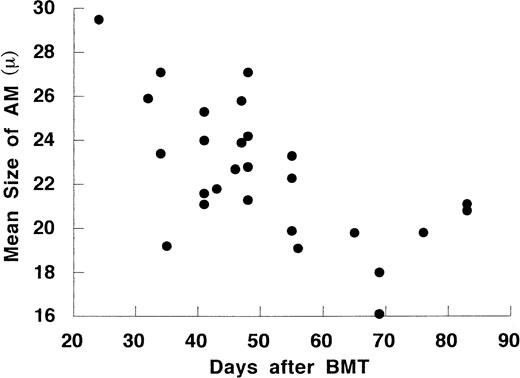
The size of AM also changed according to days after BMT (Fig 2). The mean diameter of AM after day 50 was 20.0 ± 0.7 μm, which was significantly smaller than those before day 50 (23.9 ± 0.6 μm) or controls (24.7 ± 0.7 μm). The mean diameter of AM inversely correlated with the cell number in ELF (r = −.62, P < .001, n = 27). In Diff-Quick staining, most AM before day 50 had large bright cytoplasm and deviated eosinophilic nuclei. After day 50, the morphology showed two cell patterns: one with large, bright cytoplasm and one with a smaller diameter and basophilic cytoplasm. The small AM were regularly round and had nuclei with dense chromatin. These cells were adherent, phagocytic, and nonspecific esterase-positive cells (data not shown). These data suggest that the increase of AM after day 50 is due to a repopulation of small AM in the lung.
The time course of the mean size of AM on cytospin preparations after allo-BMT.
Proliferating AM After Allo-BMT
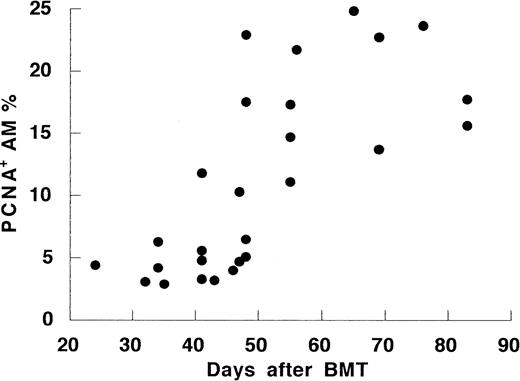
To investigate the mechanism of the increase of AM numbers after day 50, we evaluated for AM proliferation using monoclonal anti-PCNA antibody. Normal controls had low PCNA expression (3.0% ± 0.4%). PCNA expression was slightly elevated compared with control in the early period after BMT (7.1% ± 1.3%, P = .03). PCNA expression was strikingly higher in BMT recipients after day 50 than those in recipients before day 50 or the control (18.3% ± 1.5%,P < .001; Fig 3). Moreover, the percentages of proliferating AM correlated with the cell number in the all recipient (r = .59, P < .001). The high PCNA levels seen after day 50 corresponded to increased cells in G2/M phase of the cell cycle. Consistently, DNA cell cycle analysis on 6 recipients showed higher percentages of AM entering G2/M phase after day 50 than those before day 50 or controls (Table 4). Thus, the increase of AM after day 50 seemed to correlate with an augmented, local proliferation of AM in vivo.
The time course of percentage of proliferating cell nuclear antigen-positive cells in AM after allo-BMT.
The time course of percentage of proliferating cell nuclear antigen-positive cells in AM after allo-BMT.
Proportion of the Proliferating Cells in AM From BMT Recipients and Controls
| Subjects . | Days After BMT . | Proportion of Proliferating Cells . | |
|---|---|---|---|
| PCNA Positive AM (%) . | G2/M in Cell Cycle (%) . | ||
| BMT recipients (no.) | |||
| 1 | 24 | 4.0 | 2.0 |
| 9 | 41 | 4.8 | 1.0 |
| 10 | 43 | 6.5 | 0.8 |
| 20 | 55 | 22.7 | 9.8 |
| 22 | 65 | 18.5 | 4.9 |
| 23 | 69 | 25.6 | 3.8 |
| Normal nonsmokers | |||
| 1 | 2.5 | — | |
| 2 | 2.0 | 2.5 | |
| 3 | 1.5 | 1.9 | |
| 4 | 0.9 | 1.5 | |
Direct Observation of Chimeric State of AM by Y Chromosome Detection in a Sex-Mismatched Case
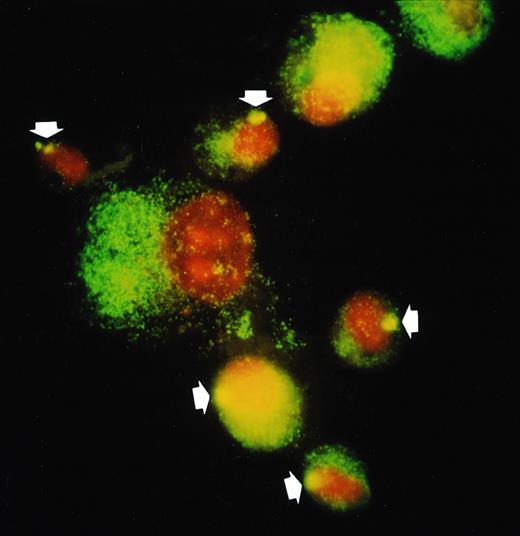
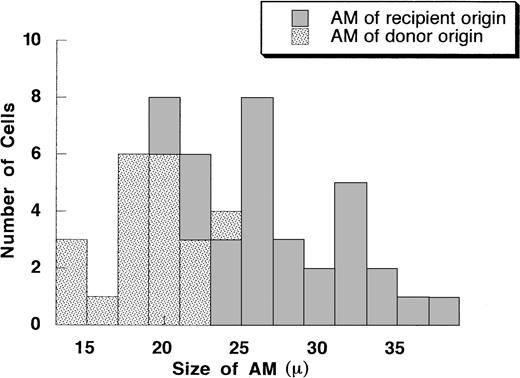
To demonstrate that the small rounded AM present after allo-BMT were derived from donor hematopoietic progenitor cells, we performed FISH to detect the Y chromosome of AM from a sex-mismatched case (recipient, female; donor, male; Fig 4). In this case, recipients underwent BAL on day 48, when AM are expected to be in a chimeric state. As controls, 2 sex-matched cases (male to male and female to female) were also studied. As shown in Fig 4, most AM that were positive for Y chromosome were small AM. Thirty-three percent of AM were positive for Y chromosome in this case, whereas 100% and 0% were detected in the control cases of male to male and female to female, respectively. The histogram of diameter of AM demonstrated that AM of donor origin were mostly small, whereas recipient AM were heterogeneous in size (Fig 5). These data indicate that small AM that increase after allo-BMT are donor origin and therefore entered the lung as circulating mononuclear phagocytes.
FISH detection of Y-chromosome in donor AM from a recipient of sex-mismatched BMT (donor, male; recipient, female; on day 48). In situ hybridization was performed using Y-chromosome–specific cocktail probe (DYZ1/DYZ3) as described in Materials and Methods. Y chromosome is stained as a bright yellow dot in each nucleus of male AM. In the sex-mismatched BMT (1; the arrow indicates donor cell), small AM have Y chromosome (donor origin) but not with large AM (recipient origin).
FISH detection of Y-chromosome in donor AM from a recipient of sex-mismatched BMT (donor, male; recipient, female; on day 48). In situ hybridization was performed using Y-chromosome–specific cocktail probe (DYZ1/DYZ3) as described in Materials and Methods. Y chromosome is stained as a bright yellow dot in each nucleus of male AM. In the sex-mismatched BMT (1; the arrow indicates donor cell), small AM have Y chromosome (donor origin) but not with large AM (recipient origin).
A histogram of the size of AM on cytospin preparation from the recipient as shown in Fig 4. The X axis is the size of AM (in millimeters). The Y axis is the number of cells. A total of 50 AM were measured.
A histogram of the size of AM on cytospin preparation from the recipient as shown in Fig 4. The X axis is the size of AM (in millimeters). The Y axis is the number of cells. A total of 50 AM were measured.
Genotypic Evaluation of AM After Allo-BMT
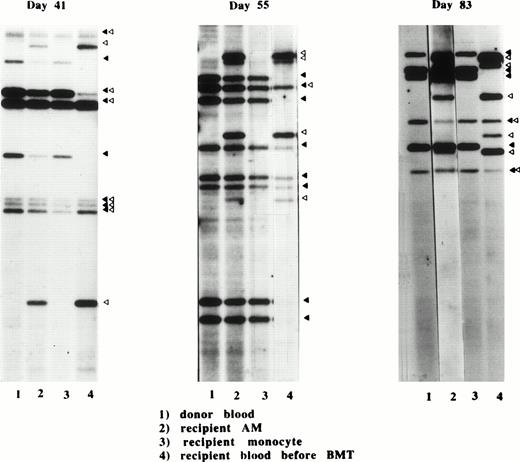
The DNA fingerprinting method enables one to detect minor differences in the genotypes between siblings through the use of single locus probes. Using this method, we investigated the replacement of recipient genotypes in AM and blood monocytes by donor genotypes in 3 different recipients (Fig 6). On day 41, the banding pattern showed that the recipient genotype was predominant in AM, although several bands which were characteristic for donor genotype were also observed. On day 55, bands of donor and recipient origin were similar in intensity, indicating that donor AM were increasing in this period. On day 83, the donor bands predominated but the recipient genotype was still clearly seen. In contrast, banding pattern of blood monocytes demonstrated that these cells were exclusively of donor origin as early as day 41. Thus, replacement of monocytes by donor cells is complete by day 41, whereas that of AM proceeds gradually around day 50.
Banding patterns of DNA fingerprints from three different donor-recipient sets on days 41, 55, and 83 after allo-BMT. DNA fingerprints were produced from HinfI-digested genomic DNA prepared from donor blood cells (1), recipient AM after BMT (2), recipient monocytes (3), and recipient blood cells before BMT (4), as described in Materials and Methods. The characteristic bands for donor (▴) and recipient (▵) are shown.
Banding patterns of DNA fingerprints from three different donor-recipient sets on days 41, 55, and 83 after allo-BMT. DNA fingerprints were produced from HinfI-digested genomic DNA prepared from donor blood cells (1), recipient AM after BMT (2), recipient monocytes (3), and recipient blood cells before BMT (4), as described in Materials and Methods. The characteristic bands for donor (▴) and recipient (▵) are shown.
DISCUSSION
This study was designed to clarify the mechanism of reconstitution of AM populations after allo-BMT. Previous studies have demonstrated that AM are completely replaced by donor AM within 90 days after allo-BMT, indicating that AM are ultimately of bone marrow origin.14To extend these observations, we investigated the kinetics of reconstitution of AM population by performing BAL from 24 to 83 days post-BMT. Our data demonstrated that the cell number, morphology, and proliferative ability of AM were similar to those of the control AM until day 50 when recipient AM predominated. After day 50, the number of AM in ELF increased to threefold. Morphologically, small immature AM predominated after day 50. Those cells were presumed to be donor origin. Finally, AM after day 50 demonstrated an augmented proliferative ability in vivo. Consequently, these observations combined with previous studies suggest that small AM of donor origin replace recipient AM after allo-BMT.
This study may not represent AM kinetics in the normal lung, because the conditioning therapies, supportive therapies, or graft-versus-host reactions may affect the entry of donor cells to the lung or replication of AM in situ. However, our data showed that the cell number, size, and proliferative ability increase strikingly after day 50 regardless of conditioning regimens, supportive therapies, or the grade of GVHD. Therefore, the changes in AM after day 50 are likely to be due to the reconstitution of AM population after allo-BMT.
Genotypic analysis on AM and monocytes from three recipients on days 41, 72, and 83 demonstrated residual recipient genotype at all time points. At day 41, the recipient genotype predominated. At day 72, donor and recipient genotype were evenly mixed. At day 83, donor genotype predominated. No recipient genotype was detected in the PBM at the time of bronchoscopy. This observation supported the idea that AM are long-lived cells.20,21 Moreover, because large numbers of AM are continuously lost from the lung, mainly through airways,1,2 AM must continue to proliferate to maintain their population size after chemotherapy.13 22 This observation supports the conclusion that AM proliferate in situ to maintain their population size.
In contrast to previous studies, the present study demonstrates that AM number increase after day 50. Influx of circulating mononuclear phagocytes may partially contribute to the increase. However, considering the fact that AM retain their population size for long period in monocytopenia,8 9 augmented proliferative ability is likely to be a major cause for the increase. Thus, our present data support the conclusion that the local proliferation of both recipient AM and donor AM play an important role in the population renewal of AM after allo-BMT. Compartmentalization of the time course into three periods may explain the data. In the early period (primarily before day 50), recipient AM and precursors remain in the lung and proliferate to maintain their populations. During this period, small numbers of donor precursors enter the lung. In the middle period, donor AM and precursors exclusively proliferate to form a chimeric state with recipient AM. In the late period, the donor AM predominate, almost replacing the recipient AM. Finally, the number of AM approaches basal levels.
Our present data suggest that small immature AM appearing after day 50 are derived from donor bone marrow graft, although the differentiation pathway remains to be studied. It is reasonable to consider that these small AM are precursor cells of donor origin that go on to proliferate and mature into AM. Two models could account for the origin of these small AM. The first model is that circulating monocytes or their subpopulation(s) repopulate the lung. Because cultured monocytes differentiate and survive for long periods in the presence of GM-CSF or M-CSF,23 which are both produced in the lung, circulating monocytes could enter the lung interstitium, differentiate, and move to the alveoli. Supporting this model, Passlick et al24reported that monocyte subpopulations express similar surface antigens to those on AM. The second model is that multipotential hematopoietic progenitor cells enter the lung from the blood before expanding and differentiating in situ. This idea is supported in ontogeny studies of AM. Sorokin et al25 found that macrophages developed from a rat lung explant of a 14-day fetus. At this stage, hematopoiesis is largely complete in the liver and monocytes are not present in the peripheral blood.25 These macrophages were indistinguishable from mature AM morphologically, phenotypically, and functionally. Consequently, AM precursors, at least in some part, are established in the fetal lung before the initiation of hematopoiesis in the bone marrow. Similarly, recent studies of osteopetrotic mutant mouse (op/op mouse) also support this concept. This mouse has a severe deficiency in monocyte-macrophage lineages,26-28 which is caused by the absence of a functional M-CSF.29 In these mice, tissue macrophages are relatively preserved, whereas monocytes are absent.28 These studies support the idea that AM are premedullary and not of monocytic derivation.
In conclusion, the present study provides a mechanism for the homeostasis of AM populations after allo-BMT. Proliferation of donor AM may be critical for the replacement of recipient AM. Although more detailed characterization of donor-derived AM is necessary, our results may contribute to understanding the mechanism of pulmonary immunodeficiency and the prevention of lower respiratory infections that occur after allo-BMT.
ACKNOWLEDGMENT
The authors thank Kirin Brewery Co, Ltd for providing recombinant human GM-CSF and Morinaga Milk Industry Co, Ltd for providing recombinant human M-CSF. We are very grateful to Dr M. Weiden, Dr D. Nam, Dr S. Kanegasaki, and Dr K. Akagawa for valuable discussions and to Teijin Bio Laboratories for their technical help.
Supported by the Asahi Life Insurance Research Foundation.
The publication costs of this article were defrayed in part by page charge payment. This article must therefore be hereby marked “advertisement” in accordance with 18 U.S.C. section 1734 solely to indicate this fact.
REFERENCES
Author notes
Address reprint requests to Koh Nakata, MD, PhD, Laboratory of Culture Collection, The Institute of Medical Science, The University of Tokyo, 4-6-1 Shirokane-dai, Minato-ku, Tokyo 108, Japan.

This feature is available to Subscribers Only
Sign In or Create an Account Close Modal