To the Editor:
We have developed a method for measuring, simultaneously and in the same red blood cell, membrane elasticity and viscosity using optical tweezers.1-3 We demonstrated the capability and sensitivity of this method by applying it to study both fresh and 35-day stored erythrocytes preserved in CPDA1 (citrate-phosphate-dextrose-adenine). In our method, the elasticity μ was obtained by measuring the deformation of the cells when dragged at a constant velocity through the plasma fluid by optical tweezers.4 By suddenly stopping the movement mentioned above, we were able to measure the membrane viscosity η using the time for the cell to return to its initial morphology. It has been shown that, for this return movement, the length decreases exponentially with time, according to the expression Lo = Lo + ΔLe−t/τ, where τ = η/μ.5 Therefore, by measuring τ and μ, η can be extracted. This shows how important it is to measure the return time τ and the elasticity μ of the same red blood cell to obtain the viscosity.
The optical trap consisted of a Nd:YAG laser focused through the 100× oil immersion objective of an Olympus microscope (Olympus Optical Co, Ltd, Tokyo, Japan) equipped with a JVC Minicam (JVC Company of America, Elmwood, NJ) used to record the images in real time in VHS and, finally, captured in a computer to be quantitatively and qualitatively analyzed. The model used for calculating the elasticity value assumed a parallelepiped shaped (length Lo, width W, and negligible thickness) cell located at a distance Z1 from the bottom of a Neubauer slip and Z2 from the cover slip. Furthermore, it assumed a drag force expressed by Fdrag = η(WLo/Zeq)V and an elastic response given by Felastic = μ(W/Lo)ΔL, where Fs are the drag and elastic forces, μ is the elasticity, ΔL is the cell length deformation, η is the plasma viscosity, and (1/Zeq) = (1/Z1) + (1/Z2) and V are the drag velocity. At equilibrium, these two forces must cancel each other and the elongation ΔL can be expressed by ΔL = [ηLo2/μZeq)]V, independent of the cell width W. The measurement of this deformation as a function of the drag velocity can be used to extract a value for μ, providing that the plasma viscosity η, length Lo, and Zeq are known.
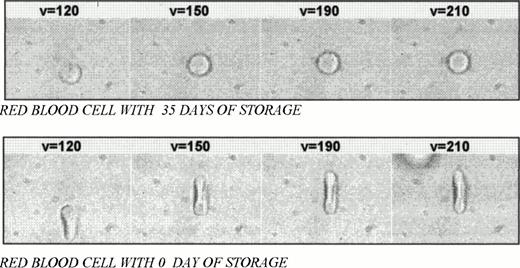
The samples used were obtained from blood donors at the Hematology and Hemotherapy Center of Campinas and analyzed in a 100-μm depth Neubauer slip. The erythrocyte concentrate was diluted (1:500 μL) in AB plasma. The plasma viscosity η = 2.19 centipoise was measured at 23°C. At least 5 erythrocytes of each bag were submitted to 5 velocities, varying from 50 to 250 μm/s. The drag cell image was analyzed with the Image-Pro Plus software (Media Cybernetics, Silver Spring, MD) to obtain the deformation as a function of velocity. At a velocity of 250 μm/s, the movement was suddenly stopped and the images were captured with a 30-frame/second rate to measure the length of the red blood cell as a function of time (in 1/30-second steps). Figure 1 shows the deformed red blood cells at 0 and 35 days of storage, with velocities varying from 120 to 210 μm/s.
Deformed red blood cells at 35-day and 0-day storage with velocities varying from 120 to 210 μm/s.
Deformed red blood cells at 35-day and 0-day storage with velocities varying from 120 to 210 μm/s.
The analysis of red blood cell deformation as a function of velocity in the model showed that the points compose a straight line (R2 = .9869). When we studied the cell length versus time at the moment when the cell returns to the initial morphology, we found an exponential decay curve. The Lovalue used to calculate the elasticity was the y-intercept value obtained from the straight line; Zeq was measured by the microscope micrometer, positioning the cell in the center of the Neubauer slip. Table 1 shows the results obtained for both fresh and stored red blood cells.
Results of Elasticity and Membrane Viscosity Obtained for 0-Day and 35-Day Stored Red Blood Cells
| . | Length . | μ . | η . |
|---|---|---|---|
| 0 day; 2 cells/bag | |||
| 1 | 9.91798 | 0.00042 | 0.03772 |
| 2 | 8.84906 | 0.00019 | 0.01971 |
| 3 | 9.59827 | 0.00014 | 0.01225 |
| 4 | 9.54423 | 0.00037 | 0.04169 |
| 5 | 10.4705 | 0.00028 | 0.02258 |
| 6 | 10.4752 | 0.00036 | 0.03578 |
| Average | 9.8092 | 0.00029 | 0.02829 |
| Standard deviation ς | 0.62116 | 0.00011 | 0.01173 |
| Standard deviation/average (%) | 6.33% | 37.99% | 41.47% |
| ς/square root (6) | 0.25359 | 4.5E-05 | 0.00479 |
| ς/(average ∗ square root (6)) [%] | 2.59% | 15.51% | 16.93% |
| 35 days; 2 cells/bag | |||
| 1 | 5.26143 | 0.00026 | 0.02505 |
| 2 | 5.58666 | 0.00042 | 0.04256 |
| 3 | 5.7949 | 0.00035 | 0.03438 |
| 4 | 5.56466 | 0.00029 | 0.03096 |
| 5 | 5.86073 | 0.00055 | 0.02725 |
| 6 | 6.13289 | 0.00063 | 0.02967 |
| Average | 5.70021 | 0.00042 | 0.03164 |
| Standard deviation ς | 0.29858 | 0.00015 | 0.00623 |
| Standard deviation/average (%) | 5.24% | 34.98% | 19.67% |
| ς/square root (6) | 0.12189 | 6E-5 | 0.00254 |
| ς/(average ∗ square root (6)) [%] | 2.14% | 14.28% | 8.03% |
| Average 0 day | 9.809199843 | 0.00029 | 0.02829 |
| Average 35 days | 5.700212313 | 0.00042 | 0.03164 |
| difference | 4.10898753 | 0.00013 | 0.00336 |
| Z = difference/ς/square root (6) | 16.2033726 | 2.11722 | 0.70138 |
| Probability of random difference | 0.00% | 1.71% | 24.15% |
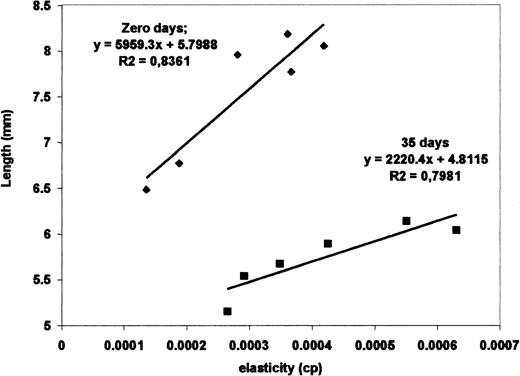
Figure 2 is a graphic from which we can verify the sensitivity of the method. The initial red blood cell length Lo is plotted against the measured elasticity for nonstored and stored cells. Considering different donors, the correlation decreases to .83. For the 6 different fresh red blood cells (4 of the same donor and the other from 2 different donors), the slope ranged from 0.012 to 0.021 μm/(μm/s) and the y-intercept (cell length with null velocity) varied from 6.5 to 8.3 μm, whereas for 35 stored cells (2 cells for each donor), the slope changed from 0.005 to 0.009 μm/(μm/s) and the y-intercept changed from 5.1 to 6.1 μm. From these data we verified that the slope variation among different red blood cells was around 25% for cells with same storage time, but there was a great difference of 240% between the fresh and 35-day stored cells. The same was observed for the size (y-intercept). There is a clear distinction of the curves for the fresh and the stored cells. Although the elasticity of 35-day stored cells is in the same range of the fresh ones, there is a statistically significant difference in their averages. Results in Table 1 show a 40% elasticity variation from cell to cell and a 44% variation between the average for fresh and stored cells, which is much larger than the 15% average variation expected for a random sample. Viscosity, in contrast to elasticity, did not present any correlation to storage time and remained practically constant.
Loss of posttransfusion viability is the major limitation of long-term red blood cell storage. To determine the cellular properties responsible for this loss, a number of investigators have examined changes in the various properties during storage and have reported that a progressive loss of lipid, spherocyte form occurs and that cells undergo a loss of deformability.6-8 When we analyzed the deformability as a function of velocity of fresh red blood cells, we found a deformability loss of a small population of red blood cells masked by the presence of a large percentage of normally deforming cells. In the 35-day stored red blood cells, we found that almost all cells had suffered an important deformability loss. Previously, Bronkhorst et al3 demonstrated that the use of optical tweezers is sensitive for studying shape recovery of red blood cells.
The evidence in this study of the applicability of this technique to monitor mechanical properties of membrane measuring elasticity and viscosity simultaneously should help clarify the relationship between deformability and viability of stored red blood cells for transfusion purposes. We concluded that it is a new method that could be used as an independent tool for the investigation of the biophysical behavior of abnormal red blood cell membranes.


This feature is available to Subscribers Only
Sign In or Create an Account Close Modal