

Abstract
The mechanisms by which pharmacologic agents stimulate γ-globin gene expression in β-globin disorders has not been fully established at the molecular level. In studies described here, nucleated erythroblasts were isolated from patients with β-globin disorders before and with butyrate therapy, and globin biosynthesis, mRNA, and protein-DNA interactions were examined. Expression of γ-globin mRNA increased twofold to sixfold above baseline with butyrate therapy in 7 of 8 patients studied. A 15% to 50% increase in γ-globin protein synthetic levels above baseline γ globin ratios and a relative decrease in β-globin biosynthesis were observed in responsive patients. Extensive new in vivo footprints were detected in erythroblasts of responsive patients in four regions of the γ-globin gene promoter, designated butyrate-response elements gamma 1-4 (BRE-G1-4). Electrophoretic mobility shift assays using BRE-G1 sequences as a probe demonstrated that new binding of two erythroid-specific proteins and one ubiquitous protein, CP2, occurred with treatment in the responsive patients and did not occur in the nonresponder. The BRE-G1 sequence conferred butyrate inducibility in reporter gene assays. These in vivo protein-DNA interactions in human erythroblasts in which γ-globin gene expression is being altered strongly suggest that nuclear protein binding, including CP2, to the BRE-G1 region of the γ-globin gene promoter mediates butyrate activity on γ-globin gene expression.
© 1998 by The American Society of Hematology.
EXTENSIVE INVESTIGATION has demonstrated that the clinical severity of the β-globin disorders can be ameliorated by increased expression of the fetal globin genes.1,2 Several pharmacologic agents stimulate fetal globin production in patients with β-globin disorders, including chemotherapeutic agents and growth factors.3-8 Most of these agents appear to act through altering erythroid growth kinetics. The cytotoxic agents that produce a hypoproliferative marrow are thought to induce γ-globin by selectively killing actively dividing erythroid precursors, leading to the subsequent recruitment of more primitive erythroid progenitors, which are programmed to produce higher levels of hemoglobin F (HbF).7 8
Butyrate and other short-chain fatty acids have been shown to stimulate fetal and embryonic globin gene expression in experimental models at the level of transcription. These models include preferential γ-globin expression from the β-globin locus transfected into Xenopus oocytes, embryonic ρ-globin expression in chickens treated with 5-azacytidine and butyrate, increased γ-globin expression in human fetuses developing in the presence of elevated levels of α-amino-n-butyric acid and in butyric acid-treated fetal sheep, nonhuman primates, and transgenic mice.9-13 Reporter gene assays have demonstrated that several fatty acids and an amide derivative, isobutyramide, stimulate γ-globin gene expression through a proximal region of the γ-globin gene promoter.14-16 In clinical studies, erythroid cells from patients have demonstrated increased fetal globin expression at the mRNA, protein, or cellular levels in patients treated with low-to-moderate, intermittent doses of arginine butyrate and phenylbutyrate,17-20 although prolonged high doses that inhibit cell growth are less effective.21 Neither arginine butyrate nor sodium phenylbutyrate produces the myelosuppression that is associated with administration of chemotherapeutic agents. Identification of the specific mechanisms of action of butyrates may therefore be useful in identifying potential combinations of therapeutic agents that have different and complementary mechanisms of action.
To investigate the molecular effects of butyrate on fetal globin expression, nucleated erythroblasts were purified from patients with β-globin disorders before and during butyrate treatment. In erythroid cells from patients in whom γ-globin protein was increased by butyrate therapy, increases in γ-globin mRNA and alterations in protein-DNA binding to regulatory sequences in the γ-globin gene promoter were observed. These changes were not detected in erythroblasts isolated from the single patient studied here who did not respond with an increase in γ-globin protein. These results suggest that one of the mechanisms by which butyrate increases γ-globin is to induce binding of transcription factors to specific cis-acting elements of the γ-globin gene promoter.
MATERIALS AND METHODS
Isolation of nucleated erythroblasts.
Peripheral blood samples were collected from patients in whom there was a high proportion of circulating nucleated erythroblasts, representing between 70% and 90% of the mononuclear cells. Mononuclear cells were isolated from the peripheral blood of 7 patients with β-thalassemia and from the bone marrow of 1 patient with sickle cell disease, before and during therapy with butyrate, and from 1 normal adult control by Ficoll-Paque (Pharmacia, Piscataway, NJ) density gradient centrifugation. For mononuclear cell preparations that had 80% or more nucleated erythroblasts, no further purification was performed and the cell preparations were used as erythroblast-rich fractions. For samples in which there were less than 80% erythroblasts, erythroblasts were further purified using murine antihuman CD45 antibody and culture flasks coated with goat antimurine IgG serum (Applied Immune Sciences, Santa Clara, CA). Because CD45 is expressed on all hematopoietic cells except erythroid cells,22 the CD45+ cells were removed by treating erythroblast-rich preparations with murine antihuman CD45 antibody according to the manufacturer’s directions. The purity of erythroblasts in the resulting nonadherent fractions was confirmed by morphology after Wright’s and benzidine staining. Collection of samples for these studies was approved by the Institutional Review Boards of the Boston Medical Center and the University of California at San Francisco, and informed consent was obtained from each patient.
For erythroid and nonerythroid controls, K562, Raji, and HeLa cells were cultured in RPMI 1640 media (GIBCO, Grand Island, NY) containing 10% fetal bovine serum (Gemini Bioproducts, Calabasas, CA), 100 IU/mL penicillin, and 100 IU/mL streptomycin (GIBCO) and incubation with or without butyric acid (Aldrich Chemical Co, St Louis, MO) at neutral pH in humidified 5% CO2 and 95% air at 37°C.
Isolation and analysis of globin mRNA.
Total cytoplasmic RNA was extracted from erythroblasts by the method of Chomoczynski and Sacchi.23 Globin mRNAs were analyzed by primer extension as previously described.24,25Oligonucleotides for γ-, β-, and α-globin mRNAs were 5′ end-labeled with T4 polynucleotide kinase and [γ-32P] ATP (New England Nuclear, Boston, MA) and were purified through Push columns (Stratagene, La Jolla, CA) as described previously.25 Five micrograms of total RNA was subjected to primer extension analysis. The extension products were analyzed in 8% urea-polyacrylamide gels. Autoradiography was performed by exposing gels to Kodak X-AR films (Eastman Kodak, Rochester, NY) overnight with an intensifying screen. The ratio of γ-globin mRNA to α-globin mRNA in patients with β-thalassemia or γ-globin mRNA to βs-globin mRNA in 1 patient with sickle cell disease was determined using PhosphorImager (Molecular Dynamics, Sunnyvale, CA). The DNA sequence of the oligonucleotide for α-globin mRNA was as follows: 5′-TTACCCCAGGCGGCCTTGACGTTGGTCTTGTCGG-3′ (34 mer); the sequences for γ- and β-globin mRNA were as described previously.25
Globin biosynthesis.
Heparinized venous blood containing nucleated erythroblasts was incubated in 20 mL of leucine-free minimal essential medium (GIBCO) with 100 μCi [3H] leucine (New England Nuclear) at 37°C for 6 hours. Globin was purified and globin chain synthesis was determined by column chromatography by the method of Clegg et al.26 Multiple samples were obtained before and after treatment and were assayed at least three times.
In vivo footprinting analyses.
In vivo methylation of cellular DNA was performed as described previously.27,28 Dimethyl sulfate (DMS) treatment (0.1% [vol/vol]) was performed for 90 seconds at room temperature. Extraction of genomic DNA from in vivo methylated cells was performed as described.25 In vitro methylation of naked DNA was performed as described previously.29Methylated DNAs were cleaved with piperidine and DNAs were dissolved in 1× TE (10 mmol/L Tris-HCl, pH 8.0/1 mmol/L EDTA) at a final concentration of 0.5 to 1 μg/μL.28 Ligation-mediated polymerase chain reaction (PCR) was next performed by the method of Mueller and Wold,27 with modifications.25Briefly, 3 to 7 μg of DNAs was suspended in 15 μL of solution A (40 mmol/L Tris-HCl, pH 7.7/50 mmol/L NaCl) containing 0.6 pmol of primer 1 (see below). First-strand synthesis was performed by adding 7.5 μL of solution B (20 mmol/L MgCl2/ 20 mmol/L dithiothreitol [DTT]/60 μmol/L dNTP) and 1.5 μL of 1:4 diluted Sequenase version 2.0 (US Biochemical, Cleveland, OH) in 1× TE at 50°C for 10 minutes. The reaction was quenched by heating at 68°C for 10 minutes, adding 6 μL of 310 mmol/L Tris-HCl (pH 7.7) and subsequently extracting with phenol/chloroform/isoamyl alcohol (25:24:1) and with ether. Ligation of the PCR common linker was performed as described by Mueller and Wold.27 DNA sequences were amplified by performing 16 to 18 cycles of PCR using 10 pmol each of primer 2 (see below) and the longer oligomer of the common linker.27 The amplified products were then digested with mung bean nuclease (New England Biolabs, Beverly, MA), as described previously.28 Primers 1, 2, and 3 were used for first-strand synthesis, PCR, and primer extension, respectively. Footprint ladders were visualized by performing a primer extension using 5′ end-labeled primer and subsequent analysis on 8% urea-polyacrylamide gels. Autoradiography was performed by exposing gels to Kodak X-AR films with an intensifying screen. The reproducibility of in vivo footprints was confirmed by scanning with PhosphorImager. The percentage of protection on each G residue and identification of hyperreactive G residues were defined as described previously.25-30
Electrophoretic mobility shift assays (EMSA).
Nuclear extracts used for gel mobility shift assays were prepared from purified nucleated erythroblasts as previously described.31Oligonucleotides were annealed to form double-stranded DNA, 5′ labeled with T4 polynucleotide kinase, and purified through Push columns (Stratagene, La Jolla, CA).24 A double-stranded oligonucleotide containing the TFIID consensus sequence (Promega, Madison, WI) was used as a control to verify the integrity of the nuclear extracts. Ten micrograms of nuclear extracts was mixed with 500 ng of poly[(dA-dT)] or poly[(dI-dC)] in 20 μL of binding buffer (25 mmol/L HEPES, pH 7.5/50 mmol/L KCl/12.5 mmol/L MgCl2/1 mmol/L DTT/10 μmol/L ZnSO4/5% [vol/vol] Glycerol/0.1% [vol/vol] NP-40) at room temperature for 30 minutes. After the addition of probe labeled with 5 × 10⁴ cpm, the mixture was incubated for 30 minutes at room temperature. Competition experiments were performed by adding a cold competitor at a 100-fold molar excess before the addition of a labeled probe. In these experiments, an oligonucleotide with sequences corresponding to αCP2 was used. Protein-DNA complexes were separated on 5% nondenaturing polyacrylamide gels in 0.5× TBE (1× TBE is 9 mmol/L Tris-borate/2 mmol/L EDTA) at 200 V for 90 minutes at room temperature. Gels were dried and exposed to Kodak X-AR films overnight. The DNA sequences of oligonucleotide probes used for these assays were as follows: BRE-G1, 5′-GAGTATCCAGTGAGGCCAAGGGGCCG GCGGCTGGCTAGGG-3′; mutant BRE-G1, 5′-GAGTATCCATTTAGGCCAAGGGGCCGGCGGCTGGCTAGGG-3′; αCP2, 5′-CCCTAACAAGTTTTACTGGGTAGAGCAAGCACAAACCAGCCAATGAG-3′32; and TFIID, 5′-GCAGAGCATATAAGGTGAGGTAGGA-3′.33
Plasmid constructions and reporter gene assays.
To construct the wild-type plasmid containing the human growth hormone gene driven by a γ-globin gene promoter, a 335-bp Alu fragment of theAγ-globin gene promoter extending from −299 to +36 with respect to the transcription initiation site was subcloned into the HindIII site of the plasmid p0GH (Nichols Institute, San Juan Capistrano, CA). A mutant plasmid was constructed with primer 5 MUT-1T, 5′-GAGTATCCATTTAGGCCAGGGGC CGGCGGCTGGCTAGGG-3′, which contains two mutations (G → T) introduced in the BRE-G1 sequence that eliminate the binding of proteins in nuclear extracts of patients’ erythroblasts observed during butyrate therapy, using a transformer site-directed mutagenesis kit (Clontech, Palo Alto, CA). The sequence of mutations were verified by dideoxy sequencing using the DNA polymerase sequencing kit (Clontech). All plasmid DNAs were prepared using Qiagen columns (Qiagen, Santa Clara, CA). For each transient transfection, 1 × 10⁷ K562 cells were electroporated with 50 μg of reporter construct in duplicate. The two duplicate sets of K562 cells transfected with each plasmid were pooled and then divided into two fractions. Sodium butyrate was added to one of the fractions at a final concentration of 1 mmol/L, and the cells were incubated for 72 hours at 37°C in 5% CO2 and air. Human growth hormone was assayed in the media 72 hours after transfection using the HGH-TGES Gene Expression kit (Nichols Institute) according to directions from the manufacturer. The assays were performed at least three times.
RESULTS
Increases in γ-globin mRNA and protein biosynthesis with butyrate treatment.
Characterization of the patients studied here and their responses to butyrate administration are shown in Table1. In 6 of the 7 β-thalassemia patients studied before and during or after butyrate therapy, the ratios of γ-globin mRNA to α-globin mRNA in erythroblasts increased above pretreatment levels in the same subjects by 2.8-to 6-fold (Fig 1). In erythroid cells from the patient with sickle cell anemia, γ-globin mRNA relative to βs-globin mRNA increased fivefold above the baseline ratio of γ:βs-globin (Fig 1). Increases in γ-globin mRNA were consistently associated with, on average, twofold increases above baseline in γ-globin protein synthesis in the thalassemic subjects, as shown in Fig 2. For example, in a pretreatment sample from patient no. 4, the ratio of non–α-globin (γ + β) to α-globin was 0.4 (Fig 2A). With a moderate dose of arginine butyrate (1,200 mg/kg/d), γ-globin increased, and the overall non-α:α-globin chain ratio was corrected to 0.84, with relative β-globin synthesis diminished compared with baseline (Fig 2B). Similar increases in γ-globin synthesis and decreases in β globin in β+ thalassemia subjects were observed in the other patients in whom γ-globin mRNA increased over baseline (data not shown). The modest doses studied (250 to 800 mg/kg for 3 to 4 days of 14 days total) have increased the hemoglobin F protein in two thirds of another group of adult sickle cell subjects to a mean of 22% hemoglobin F.20
Patients Studied
| Patient No. | Mutations | Age (yr) | Duration of Therapy When Analyzed | Non-α:α Globin Chain Synthesis | Fold Increase in γ Globin mRNA on Therapy* | |
|---|---|---|---|---|---|---|
| Baseline | Treatment | |||||
| 1 | β+ Thalassemia | 3 | 4 wk | 0.5 | 0.8 | 3.5 |
| IVSI-6 | ||||||
| codon 39 | ||||||
| 2 | β0 Thalassemia | 41 | 2 wk | 0.5 | 0.75 | 2.8 |
| Frameshift 41/42 | ||||||
| Frameshift 5 | ||||||
| 3 | β0 Thalassemia | 27 | 1 wk | 0.4 | 0.8 | 3.9 |
| IVS I-1 | ||||||
| IVS II-1 | ||||||
| 4 | β+Thalassemia | 21 | 6 wk | 0.4 | 0.5-151 | 1.0 |
| codon 39/? | ||||||
| 5 | β+ Thalassemia | 6 | 3 wk | 0.4 | 0.84 | 3.0 |
| −87/codon 39 | ||||||
| 6 | β+Thalassemia | 16 | 4 wk | 0.4 | 0.9 | 6.1 |
| IVS II 848 | ||||||
| 7 | β0 Thalassemia | 25 | 6 wk | 0.47 | 0.86 | 3.1 |
| Homozygous | ||||||
| codon 39 | ||||||
| 8 | Hb SS | 7 | 3 wk | 0.5-152 | 11.5-152 | 5.2-152 |
*α-Globin mRNA was used as internal control in the β-thalassemia subjects.
No changes were detected at the time that mRNA and nuclear extracts were analyzed.
Represents γ/γ + β × 100 and non-α:α-globin ratios were balanced.

Analysis of globin mRNAs by primer extension in 7 patients with β-thalassemia (patients no. 1 through 7), 1 patient with sickle cell anemia (patient no. 8), and a normal adult subject (NS). Samples obtained before therapy and during therapy are designated with − and + above the lane, respectively. Patient no. 5 was analyzed before therapy was completed (−), 24 hours after therapy was completed (+), and 44 hours after therapy ended (−*). Fold increases of γ-globin over the subject’s baseline are shown at the bottom of the lanes. Patient no. 4 was the single subject studied in whom an increase in γ-globin mRNA was not observed.
Analysis of globin mRNAs by primer extension in 7 patients with β-thalassemia (patients no. 1 through 7), 1 patient with sickle cell anemia (patient no. 8), and a normal adult subject (NS). Samples obtained before therapy and during therapy are designated with − and + above the lane, respectively. Patient no. 5 was analyzed before therapy was completed (−), 24 hours after therapy was completed (+), and 44 hours after therapy ended (−*). Fold increases of γ-globin over the subject’s baseline are shown at the bottom of the lanes. Patient no. 4 was the single subject studied in whom an increase in γ-globin mRNA was not observed.

Globin chain synthesis in a representative patient with β+ thalassemia (patient no. 5) who received butyrate therapy. (A) Baseline profile (pretreatment); (B) with butyrate (moderate dose, 1,200 mg/kg/d) therapy. The elution positions of the , β, γ, and acetylated γ (ACγ) are indicated. Non-: globin chain balance improved by approximately twofold with butyrate therapy due to an increase in acetylated γ-globin and γ-globin synthesis and despite a relative decrease in β-globin synthesis.
Globin chain synthesis in a representative patient with β+ thalassemia (patient no. 5) who received butyrate therapy. (A) Baseline profile (pretreatment); (B) with butyrate (moderate dose, 1,200 mg/kg/d) therapy. The elution positions of the , β, γ, and acetylated γ (ACγ) are indicated. Non-: globin chain balance improved by approximately twofold with butyrate therapy due to an increase in acetylated γ-globin and γ-globin synthesis and despite a relative decrease in β-globin synthesis.
New binding of transcription factors is observed in vivo during butyrate treatment.
To determine whether the increases in γ-globin mRNA observed with butyrate treatment are associated with changes in binding of transcription factors to the γ-globin gene promoter, in vivo footprinting analysis of established regulatory sequences for γ-globin gene expression was performed. Although in vitro DNA binding assays do not necessarily provide direct evidence for tissue-specific binding of transcription factors, in vivo footprinting has demonstrated protein-DNA interactions that are functionally relevant to tissue-specific gene expression.25,28,34 Furthermore, previous studies have shown that, in the γ-globin gene promoter, a DNA fragment extending up to −200 bp relative to the transcription start site is sufficient to direct efficient transcription of the γ-globin genes,14-16,35,36 although several potentially important regulatory sequences have also been identified at further upstream regions.37,38 We focused in vivo footprinting analysis for the γ-globin promoter on a region extending to −200 bp upstream of the mRNA cap site, which has demonstrated functional importance for butyrate-inducibility in previous reporter assays in three different laboratories.14-16 As shown in Fig 3, four promoter regions were newly and heavily footprinted, demonstrating protection on G residues with characteristic hyperreactive G residues adjacent to the protected bands in erythroblasts obtained from patients during butyrate treatment. These heavily footprinted sequences were demonstrated in at least four different subjects and were designated butyrate response elements G1-G4 (BRE-G1 to BRE-G4). These new footprints were not detected in the patient who did not respond to butyrate therapy. Erythroblasts isolated from β-thalassemic patients who responded to butyrate treatment demonstrated new detectable footprints consistently over BRE-G1 and BRE-G2, and sporadically over BRE-G3 and BRE-G4, during therapy. Several sites of point mutations that result in hereditary persistence of fetal hemoglobin (HPFH) were noted to be in close proximity of the BRE sequences.41 It should be noted that three G residues immediately 3′ of the CACCC sequence, which were footprinted in K562 cells as well as in human-murine erythroleukemia hybrid cell lines that express human γ-globin,25 28 were not footprinted in erythroblasts isolated from patients before or during butyrate therapy, indicating that the protein-DNA interactions of the γ-globin promoter are not identical between erythroleukemia cells and β-hemoglobinopathy patients’ erythroblasts. These in vivo footprinting analyses on erythroblasts isolated from multiple patients have clearly demonstrated that new nuclear protein binding to multiple regulatory sites of the γ-globin gene promoter develop during butyrate therapy in erythroblasts that respond by increasing γ-globin mRNA and protein.


In vivo footprinting analyses of the γ-globin gene promoter. (A) A sickle cell anemia patient (patient no. 8). Lane 1, hemin-induced K562; lane 2, before therapy; lane 3, during therapy; lane 4, naked DNA. (B) A β-thalassemia patient (patient no. 7). Lane 1, before therapy; lane 2, during therapy; lane 3, naked DNA. The location of the canonical elements is shown at the right of figures. (•) Footprinted G residues; (▴) G residues that showed hyperreactivity to DMS. The arrow indicates the location of three G residues that were footprinted in K562 cells but were not footprinted in patients’ samples.
In vivo footprinting analyses of the γ-globin gene promoter. (A) A sickle cell anemia patient (patient no. 8). Lane 1, hemin-induced K562; lane 2, before therapy; lane 3, during therapy; lane 4, naked DNA. (B) A β-thalassemia patient (patient no. 7). Lane 1, before therapy; lane 2, during therapy; lane 3, naked DNA. The location of the canonical elements is shown at the right of figures. (•) Footprinted G residues; (▴) G residues that showed hyperreactivity to DMS. The arrow indicates the location of three G residues that were footprinted in K562 cells but were not footprinted in patients’ samples.
EMSAs with BRE-G1.
To further characterize transcription factors binding to BREs, gel mobility shift assays using nuclear extracts prepared from patients’ erythroblasts before and during therapy were performed. We specifically focused on transcription factors binding to BRE-G1 of the γ-globin promoter, for two reasons. First, reporter gene assays in our laboratory and others have previously demonstrated that a small region of the γ-globin promoter, extending to −60 bp from the transcription start site, was adequate to respond to butyrate with upregulation of γ-globin gene transcription, although other upstream regions may augment this effect.11,14-16 Second, the stage selector element, which has been implicated in competitively silencing the β-globin gene in the fetal stage,39 40 has been mapped to a region 50 bp upstream of the γ-globin promoter cap site. Because the BRE-G1 region defined in this study spans −68 to −43 bp of the γ-globin promoter, it is possible that the BRE-G1 region includes these two regions of potential interest (Fig 4).

Summary of in vivo footprints of the γ-globin gene promoter observed with butyrate treatment. Canonical elements are boxed. Closed and stippled symbols are for sickle cell anemia and β-thalassemia, respectively. Symbols: circles, footprinted G residues; triangles, G residues hyperreactive to DMS. Asterisks indicate sites of mutations that result in HPFH. The transcriptional start site of the γ-globin gene is denoted by the arrow.
Summary of in vivo footprints of the γ-globin gene promoter observed with butyrate treatment. Canonical elements are boxed. Closed and stippled symbols are for sickle cell anemia and β-thalassemia, respectively. Symbols: circles, footprinted G residues; triangles, G residues hyperreactive to DMS. Asterisks indicate sites of mutations that result in HPFH. The transcriptional start site of the γ-globin gene is denoted by the arrow.
Binding activities of nuclear extracts prepared from cultured erythroid and nonerythroid cells were first examined. Nuclear extracts from uninduced K562 cells revealed several major protein-DNA complexes, which differed slightly from the binding protein pattern observed in extracts from butyrate-treated K562 cells (Fig 5A, compare lanes 1 and 2). With exposure to butyrate, the fastest migrating band decreased in intensity and two additional protein-DNA complexes (shown by the arrows) appeared. In contrast, nuclear extracts from nonerythroid cells, Raji and HeLa cells, produced patterns of shifted bands similar to extracts from untreated K562, and butyrate treatment of these nonerythroid cells did not change the patterns of shifted bands (data not shown). Because no in vivo footprints were detected in this region in these nonerythroid cell lines, these data suggest that nuclear factors forming some of the prominent complexes in vitro are derived from ubiquitous, not erythroid-specific, transcription factors.


EMSAs using the BRE-G1 sequence of the γ-globin gene promoter or TFIID as probe. (A) Nuclear extracts from uninduced K562 or a patient’s erythroblasts (patient no. 5) without treatment are shown by the −; butyrate-induced K562 cells or patient’s erythroblasts on treatment (patient no. 5) are designated by the +. Nuclear extracts prepared from erythroblasts of a normal subject are designated NS. Lane designations are as follows: lane 1, K562 (untreated); lane 2, K562 (butyrate-treated); lane 3, patient no. 5 (before treatment); lane 4, patient no. 5 (on butyrate treatment); lane 5, patient no. 5 (28 hours after treatment); lane 6, patient no. 5 (44 hours after treatment); lane 7, K562 (untreated); lane 8, patient no. 5 (on treatment); lane 9, normal subject (N.S.). Four major protein-DNA complexes, designated a through d, were detected. Arrows denote protein-DNA complexes that appeared in K562 extracts during butyrate treatment. The asterisk denotes a band that is diminished with exposure to butyrate. Nuclear extracts from patient no. 5 are shown before (−), during (+), and 28 and 44 hours after therapy (−28hr and −44hr) are shown. Three new shifted bands are demonstrated during butyrate therapy and persist for at least 44 hours, at which time globin protein synthesis is still altered with an increase in γ-globin and decrease in β-globin compared with baseline. (B) EMSA using a TFIID probe. The origins of nuclear extracts and addition of butyrate are shown on the top of figure. Lane designations are as follows: lane 1, patient no. 5 (before treatment); lane 2, patient no. 5 (on treatment); lane 3, patient no. 5 (28 hours after treatment); lane 4, patient no. 5 (44 hours after treatment); lane 5, K562 (untreated); lane 6, patient no. 5 (on treatment); lane 7, normal subject (N.S.). The arrow indicates the major protein-DNA complex observed with the probe. No new or shifted complexes are observed with butyrate treatment. (C) The wild-type γ-globin promoter probe (W) and a mutant probe (M) were used in EMSA. Probes and the cellular origin of nuclear extracts are shown above the lanes. The positions of the four major protein-DNA complexes, a through d, are shown on the right of figure. A decrease in binding of bands b and c was observed with the BRE-G1 sequence in which mutations were introduced, compared with binding of the normal sequence. (D) Competition assays with an CP2 sequence oligonucleotide. Assays were performed in the absence (lanes 1 and 3) or presence (lanes 2 and 4) of 100-fold molar excess of a cold competitor. Probes and the cellular origin of the nuclear extracts assayed are shown above the lanes. Binding of the top band was abolished in the presence of excess cold CP2.
EMSAs using the BRE-G1 sequence of the γ-globin gene promoter or TFIID as probe. (A) Nuclear extracts from uninduced K562 or a patient’s erythroblasts (patient no. 5) without treatment are shown by the −; butyrate-induced K562 cells or patient’s erythroblasts on treatment (patient no. 5) are designated by the +. Nuclear extracts prepared from erythroblasts of a normal subject are designated NS. Lane designations are as follows: lane 1, K562 (untreated); lane 2, K562 (butyrate-treated); lane 3, patient no. 5 (before treatment); lane 4, patient no. 5 (on butyrate treatment); lane 5, patient no. 5 (28 hours after treatment); lane 6, patient no. 5 (44 hours after treatment); lane 7, K562 (untreated); lane 8, patient no. 5 (on treatment); lane 9, normal subject (N.S.). Four major protein-DNA complexes, designated a through d, were detected. Arrows denote protein-DNA complexes that appeared in K562 extracts during butyrate treatment. The asterisk denotes a band that is diminished with exposure to butyrate. Nuclear extracts from patient no. 5 are shown before (−), during (+), and 28 and 44 hours after therapy (−28hr and −44hr) are shown. Three new shifted bands are demonstrated during butyrate therapy and persist for at least 44 hours, at which time globin protein synthesis is still altered with an increase in γ-globin and decrease in β-globin compared with baseline. (B) EMSA using a TFIID probe. The origins of nuclear extracts and addition of butyrate are shown on the top of figure. Lane designations are as follows: lane 1, patient no. 5 (before treatment); lane 2, patient no. 5 (on treatment); lane 3, patient no. 5 (28 hours after treatment); lane 4, patient no. 5 (44 hours after treatment); lane 5, K562 (untreated); lane 6, patient no. 5 (on treatment); lane 7, normal subject (N.S.). The arrow indicates the major protein-DNA complex observed with the probe. No new or shifted complexes are observed with butyrate treatment. (C) The wild-type γ-globin promoter probe (W) and a mutant probe (M) were used in EMSA. Probes and the cellular origin of nuclear extracts are shown above the lanes. The positions of the four major protein-DNA complexes, a through d, are shown on the right of figure. A decrease in binding of bands b and c was observed with the BRE-G1 sequence in which mutations were introduced, compared with binding of the normal sequence. (D) Competition assays with an CP2 sequence oligonucleotide. Assays were performed in the absence (lanes 1 and 3) or presence (lanes 2 and 4) of 100-fold molar excess of a cold competitor. Probes and the cellular origin of the nuclear extracts assayed are shown above the lanes. Binding of the top band was abolished in the presence of excess cold CP2.
Significant changes in existing patterns and new DNA-protein binding were detected comparing erythroid nuclear extracts from patients pretreated and during treatment. As shown in Fig 5A, erythroid nuclear extracts prepared from a representative butyrate-responsive thalassemic patient (patient no. 5) demonstrated two weak DNA-binding activities to the BRE-G1 element before therapy. Consistently, nuclear extracts prepared from erythroblasts of a normal adult who has not received butyrate therapy and does not express γ-globin exhibited a similar pattern of retarded bands to that seen with the patient off treatment (Fig 5A, lane 9). However, during and after butyrate therapy, three new, strong protein-DNA complexes were generated with the patients’ nuclear extracts. The integrity of the nuclear extracts was confirmed by performing an EMSA with a TFIID probe (Fig 5B). Although one new band (band a in Fig 5A) migrated in parallel with a protein-DNA complex detected in K562 nuclear extracts, two other new shifted bands (bands b and c in Fig 5A) from treated patients’ nuclear extracts migrated slightly, but consistently, more slowly than two similar bands formed with K562 nuclear extracts. These two distinct shifted bands were not detected in nuclear extracts from Raji and HeLa cells, even when treated with butyrate (data not shown). These results suggest that the nuclear factors forming two of the prominent complexes (bands b and c) during reactivation of γ-globin gene expression with butyrate therapy in vivo may be erythroid-specific, whereas the other complex is likely formed by a ubiquitous factor(s). To determine which band(s) are responsible for forming the in vivo footprints spanning a −60 to −70 region, we performed an EMSA using a probe in which the footprinted G residues of the region were mutated (G → T). As seen in Fig 5C, with the mutant probe, the top bands are intact but the intensities of the middle two bands are significantly decreased in both K562 and patients’ nuclear extracts, indicating that both bands b and c result from transcription factors binding to the −60 to −70 region. The binding activities for bands b and c were not competed away with oligonucleotides corresponding to AP1, AP2, SP1, or CREB (data not shown).
Because the wild-type oligonucleotide probe used for these EMSAs for BRE-G1 extended from −77 to −39 bp of the γ-globin promoter, it is possible that the stage selector protein complex, a heteromeric complex between αCP2 and a nuclear protein of 45 kD,40 binds to this oligonucleotide probe. To determine if any of the newly shifted bands result from a protein-DNA complex due to part of the stage selector protein complex, a competition assay using a cold αCP2 probe was performed. The top band (slowest-migrating complex) was completely abolished by the cold competitor, whereas three other bands were not affected (Fig 5D). This band was not detected in nuclear extracts prepared form a normal adult subject who did not express γ globin (see Fig 5A). This result strongly suggests that the slowest migrating complex induced during butyrate therapy results from the binding of at least one part of the stage selector protein complex, the transcription factor αCP2.
Reporter gene assays with BRE-G1.
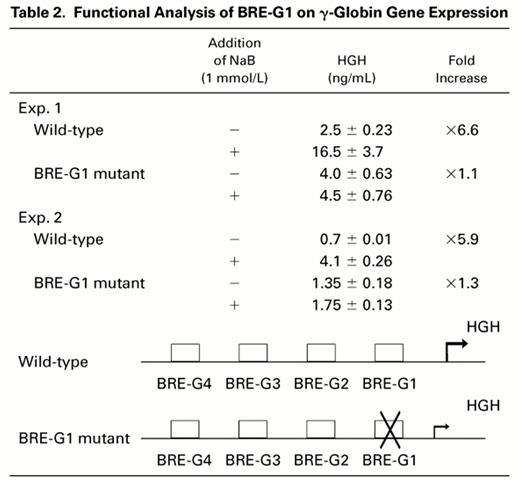
To evaluate a potential functional role of BRE-G1 in induction of γ-globin gene expression by butyrate, transient transfection assays were performed using DNA constructs containing a human growth hormone gene (HGH) as a reporter driven by a 335-bp fragment of the γ-globin gene promoter, which was previously found to be sufficient and necessary for induction by butyrate or isobutyramide.15Induction of HGH expression by butyrate was compared between constructs containing the wild-type promoter and a promoter in which mutations abolishing DNA-protein complex formation to BRE-G1 in EMSAs were introduced. The results are summarized in Table 2. Transfection of the wild-type construct into K562 cells and subsequent treatment of the transfected cells with 1 mmol/L sodium butyrate resulted in a sixfold increase in the reporter gene expression over the level of HGH expressed by untreated control cells. No change in HGH expression was observed when the mutant construct of BRE-G1 was treated with butyrate compared with the untreated mutant construct, indicating loss of butyrate responsiveness with the mutation in the BRE-G1 sequence.
DISCUSSION
Augmentation of γ-globin chain synthesis, Hb F, or F-reticulocytes and total hemoglobin and hematocrit has been demonstrated in some patients with β-globin disorders treated with sodium phenylbutyrate and with arginine butyrate intermittently.18-20 Substantial increases in γ-globin mRNA were also observed in 7 of 8 patients studied here who received variable doses of butyrate therapy. The increases in γ-globin mRNA and protein were found to be associated with alterations of transcription factors binding to regulatory sequences of the γ-globin gene promoter that differed from the DNA-binding protein patterns observed before treatment in the responsive patients.
This study has focused primarily on whether increases in γ-globin mRNA and protein of patients who received butyrate were associated with molecular changes that have been reported to affect transcription of the γ-globin gene in other experimental systems.14-17,25,37,39,42 Several changes in protein-DNA interactions were observed during and after treatment with butyrate in vivo, observed as prominent new footprints in the proximal γ-globin promoter, at sites that several laboratories have found to be functionally related to γ globin transcription.14-16 34-44 Of note, these changes in protein-DNA binding occurred only in patients who responded to butyrate therapy with an increase in γ-globin mRNA and protein and were not observed in cells of the one patient who did not demonstrate any changes in globin gene expression with therapy. This correlation strongly suggests that butyrate-responsiveness is mediated, at least partially, through the DNA-binding protein changes observed.
It is also noteworthy that nucleotide mutations that have been found in HPFH syndromes are located close to, or within, the DNA sequences of the BREs in the γ-globin promoter.41-44 Because the molecular mechanisms underlying high-level expression of the γ-globin gene in HPFH may represent a physiologic response, butyrate may result in an alteration of the developmental expression of globin genes in a manner similar to the physiologic response in HPFH. It is of interest that the G residues immediately 3′ to the CACCC sequence, which are footprinted in the human erythroleukemia cell line K562,25 28 are not footprinted in erythroblasts of patients who received butyrate therapy. Furthermore, BRE-G3 and BRE-G4 are not footprinted in K562, but were footprinted in patients’ erythroblasts during butyrate treatment. These findings suggest that the molecular mechanisms by which butyrate stimulates expression of γ-globin in patients appear somewhat distinct from those operative in K562 cells. Binding of these additional protein factors may contribute to the high level of γ-globin expression induced in these patients, compared with the low-level expression typical of K562 cells.
How the nuclear protein binding to these DNA sequences that is induced with butyrate treatment results in increased transcription of the γ-globin gene remains to be determined. Although BRE-G1 was found to be essential for butyrate responsiveness of the γ-globin gene in previous and current functional assays, additional promoter elements also increase basal transcription of the γ-globin gene.36-38 BRE-G2 was also footprinted in erythroblasts isolated from both β-thalassemic and sickle cell patients who received butyrate, as well as in K562 cells. Interestingly, BRE-G2 is composed of perfect direct-inverted repeats of 6-bp long (GCCTTGACAAGGC), suggesting that BRE-G2 is composed of two binding units. Other regulatory sequences of the β-globin locus may also contain elements which contribute to butyrate-responsiveness.16 38 Because a relative decrease in β-globin protein synthesis is frequently observed before increases in γ-globin protein synthesis during butyrate treatment, footprints of these other regions, particularly the locus control region that may amplify the effects of butyrate, should be examined to completely elucidate all the DNA-protein interactions that mediate globin gene switching in vivo in response to butyrate therapy.
These analyses demonstrate that a pharmacologic therapy that results in increased γ-globin expression in vivo is associated with changes in DNA-protein binding interactions between specific globin gene regulatory sequences and multiple DNA-binding proteins in erythroid cells from patients undergoing this therapy. Furthermore, these changes were observed solely in the nucleated erythroid cells of patients who responded with increased γ-globin expression and were not observed in a nonresponding patient. Changes in other specific binding proteins were not detected in these nuclear extracts. These findings may eventually contribute to a better understanding of the molecular mechanisms that govern the variable responsiveness of patients to pharmacologic therapy that alters globin gene expression. These regions may also provide molecular targets for development of additional fetal globin inducers or effective combinations of inducing agents with different mechanisms of action.
Supported by National Institutes of Health Grants No. HL-37118 and HL-15157, American Cancer Society Institutional Grant No. IN97-R, the American Heart Association Grant-in-Aid program, Cooley’s Anemia International, Inc, and the Cooley’s Anemia Foundation.
Address reprint requests to Tohru Ikuta, MD, PhD, Hemoglobinopathy-Thalassemia Research Unit and Cancer Research Center, Boston University School of Medicine, 80 E Concord St, L-911, Boston, MA 02118-2394.
The publication costs of this article were defrayed in part by page charge payment. This article must therefore be hereby marked "advertisement" is accordance with 18 U.S.C. section 1734 solely to indicate this fact.

This feature is available to Subscribers Only
Sign In or Create an Account Close Modal