Abstract
In many different murine models, the immunogenicity of tumor cells can be increased by transduction with a range of immunostimulatory genes, inducing an immune response that causes regression of pre-existing unmodified tumor cells. To investigate the relevance of these animal models to pediatric malignancy, we used autologous unirradiated tumor cells transduced with an adenovirus-IL-2 to immunize 10 children with advanced neuroblastoma. In a dose-escalation study, we found that this tumor immunogen induced a moderate local inflammatory response consisting predominantly of CD4+ T lymphocytes, and a systemic response, with a rise in circulating CD25+and DR+ CD3+ T cells. Patients also made a specific antitumor response, manifest by an IgG antitumor antibody and increased cytotoxic T-cell killing of autologous tumor cells. Clinically, five patients had tumor responses after the tumor immunogen alone (one complete tumor response, one partial response, and three with stable disease). Four of these five patients were shown to have coexisting antitumor cytotoxic activity, as opposed to only one of the patients with nonresponsive disease. These results show a promising correlation between preclinical observations and clinical outcome in this disease, and support further exploration of the approach for malignant diseases of children.
© 1998 by The American Society of Hematology.
THE IMMUNOGENICITY of neoplastic cells can be enhanced by transducing them with genes that encode cytokines or other immunostimulatory agents. In animal models, these transduced cells induce an immune response against unmodified tumor cells as well as against modified cells and may lead to eradication of even established solid tumors and hematologic malignancies.1-8Because the cytokines are produced locally by transduced tumor cells, they do not cause the adverse effects associated with administration of the high systemic doses of cytokines otherwise needed to induce antitumor responses. Clinical studies in adults using this approach have produced variable, but often limited systemic immunologic and antitumor effects.9 10
Neuroblastoma is the most common extracranial solid tumor of childhood. The tumor is derived from embryonic neuroectoderm and when it occurs in infants, it is frequently localized and responds well to therapy11 or undergoes spontaneous remission.12,13 In older children, the prognosis is far worse.14 Although patients with localized disease may still be cured by conventional therapy, 80% or more of those with disseminated tumor can be expected to have a relapse within 3 years, and virtually none of this subgroup will become long-term survivors.14-17 Over the past decade, attempts to improve the outcome of advanced neuroblastoma have focused on greater intensification of the induction and consolidation phases of chemoradiotherapy, with or without hematopoietic stem cell rescue.15,16,18 Although remission rates have risen, long-term survival rates have improved only marginally. This failure has prompted a resurgence of interest in alternative methods of disease eradication,19 particularly immune modulation.20 21
Several aspects of neuroblastoma tumor biology suggest that the immune system may be exploited to eradicate the tumor.12,13Because neuroblastoma is derived from embryonic neuroectoderm, it expresses antigens not widely detected in the comparatively “mature” tissues of children22-24 and may overexpress other cellular antigens,14 including some that are presented on the cell surface.25,26 Moreover, in animals and in man, neuroblastoma cells are susceptible in vitro and in vivo to cytotoxic effector mechanisms27-29 induced by cytokines such as IL-2,30 and to monoclonal antibodies (MoAbs) against neuroectoderm-restricted antigens such as GD2.31-36
We have, therefore, investigated the effects of transferring the IL-2 gene to malignant neuroblasts in children with advanced disease. Based on data from a murine model,37 we chose to use an adenoviral vector to introduce the gene into autologous neuroblasts, and to inject escalating doses of these gene-modified cells into patients with relapsed neuroblastoma. We found evidence not only of a local T-helper cell response associated with destruction of the injected tumor cells, but also of a systemic antitumor immune response that involved both helper and cytotoxic T lymphocytes and was associated with systemic tumor reduction. These results suggest that IL-2 transduction of neuroblasts provides an immunotherapeutic stimulus, and that adenoviral vectors are useful for this clinical approach.
MATERIALS AND METHODS
Patients.
A detailed clinical protocol has been described previously and was approved by our Institutional Review Board, the Food and Drug Adminstration (FDA), and the Recombinant DNA Advisory committee of the National Institutes of Health (NIH).38 Briefly, patients were eligible for study if they had neuroblastoma that had relapsed after one or more intensive courses of multiagent chemotherapy, with or without autologous stem cell rescue. Although the presence of measurable disease was not an entry criteria, all patients on study were potentially evaluable for disease response. Patients were enrolled not less than 4 weeks after any preceding therapy. Exclusion criteria included a serum creatinine >3 times normal for age, hepatic transaminases >3 times normal, Karnofsky score <60%, rapidly progressive disease, and/or a life expectancy <6 weeks (the evaluation period of the study). Although the presence of n-myc amplification was not a direct exclusion criterion, in fact none of the patients on study had this mutation. Patients were monitored for local and systemic toxicity by physical examination and blood chemistry analysis at weekly intervals. Patients received two injections of autologous neuroblasts 1-week apart, with the second dose 10-fold higher than the first injection. If both injections were tolerated, and there was no evidence of rapid progression, patients received two additional weekly injections at the higher dose. All injections were given subcutaneously. We used a dose-escalation study, giving between 104/105 and 106/107gene-modified neuroblastoma cells/kg, up to a maximum of 108 cells/child. Three children were entered at each of the first two dose levels, and four at the third (n=10).
Tumor response.
At 6 weeks, disease status was determined by clinical assessment, two-site bone marrow aspiration and biopsy, and by imaging (computed tomography [CT] or magnetic resonance imaging [MRI] scan of the chest and abdomen and/or isotope bone scans) where appropriate. Patients were reassessed at 3-month intervals or more frequently as clinically indicated. Immunologic assays were performed at 1- to 2-week intervals for 6 to 8 weeks after the first injection. A complete response (CR) was defined as complete resolution of all disease symptoms and signs and regression of all measurable disease. Very good partial response (VGPR) was defined as >90% reduction in measurable disease (determined from clinical examination and imaging), whereas partial response (PR) was defined as >50% but <90% reduction. Progressive disease was defined as >25% increase in the extent of established disease, or the appearance of new lesions. These response criteria have been described in detail elsewhere.38
Adenoviral vector.
The adenoviral vector Ad-IL-2 was constructed by recombining the plasmid pAVs6-IL2 (linearized with NotI), with the ClaI fragment of Ad-dl327, an E3 deletion mutant of human adenovirus serotype 5 that has been used in a cystic fibrosis protocol.39 We have described the structure, production, and activity of the adenoviral vector previously.39 40 Briefly, the vector lacks E1a, E1b, and E3 regions and thus is replication incompetent and devoid of genes able to inhibit immune responses.
Isolation and transduction of neuroblastoma cells.
Fresh neuroblastoma cells were obtained for transduction from 10 mL to 30 mL of bone marrow or from physically disrupted tumor biopsy specimens. Cells were initially allowed to adhere to tissue culture flasks (Collaborative Biomedical, Bedford MA) at a density of 106/cm2 in RPMI supplemented with 10% fetal calf serum (FCS). After 48 hours, nonadherent cells were discarded, and trypsinised adherent cells were stained with a panel of five MoAbs (UJ13A, UJ27.11, M340, Thy1, 5H11.1) that react with >95% of neuroblastoma cells from >90% of patients. The cells that bound the antibody were then separated by magnetic beads or by high-speed cell sorting. This technology allowed us to isolate large numbers of neuroblastoma cells of >90% purity. Cells obtained in this manner were transduced at a multiplicity of infection (m.o.i.) of 0.5 to 2 in EHS Matrix T-75 flasks (Collaborative Biomedical) at a cell density of 105/cm2, to induce IL-2 secretion at levels between 2,000 pg/106 cells/24 hours and 5,000 pg/106 cells/24 hours. After 24 hours, cells were washed in serum-free medium and cryopreserved. Detailed standard operating procedures for cell preparation and transduction are available on request.
Phenotyping of local lesions.
Six to eight μm cryostat sections were prepared from snap-frozen skin biopsies taken 1 week after each of the first two injections. Sections were fixed in acetone for 10 minutes at 20°C. After rehydrating in phosphate-buffered saline (PBS) MoAbs were added. These were anti-CD3 (Dako, Carpinteria, CA), -CD4 (Becton Dickinson, San Jose, CA), -CD8 (RDI, Flanders, NJ), -GD2 (produced in the laboratory from clone MoAb 126 obtained from the American Type Culture Collection, Rockville, MD), and the Diversi-T panel of anti-T-cell receptor variable regions V 5(a,b and c), V 6.7, V 8(a), V 12, Vα2 (T Cell Diagnostics, Cambridge, MA), or isotype-matched unreactive control antibodies (Dako). After 30 minutes of incubation, sections were washed in PBS for 10 minutes and incubated for another 30 minutes with goat antisera to mouse IgG conjugated to fluorescein isothyocyanate (FITC; Jackson Immunoresearch, West Grove, PA) or to mouse IgM conjugated to Texas Red (TXR; Southern Biotechnology Associates, Birmingham, AL). After a final wash in PBS, sections were mounted with a mixture glycerol:PBS 9:1 containing p-phenylenediamine (1 mg/mL; Sigma, St. Louis, MO) as antifading agent. Slides were examined with a Zeiss Axioplan (Zeiss, Thornwood, NY) immunofluorescence microscope equipped with blocking filter for FITC and TXR.
Measurement of antineuroblastoma antibody production.
Nontransduced neuroblastoma cells from each patient (obtained as described above) were incubated with 100 μL of autologous plasma obtained immediately before or 3 to 6 weeks after vaccination. Bound IgG was shown by biotinylated F(ab)2 fragments of donkey antihuman IgG (Jackson ImmunoResearch) then Neutralite-Avidin-R-PE (Southern Biotechnology Associates). All incubation steps comprised 10 minutes at room temperature. The two detection steps were repeated. A FACScan instrument (Becton Dickinson) was used to analyze 105 cells.
Phenotyping.
Peripheral blood mononuclear cells were phenotyped before and after immunization by flow cytometry analysis (FACScan, Becton Dickinson) using the following antibodies: HLA Class I A, B, and C (Olympus, Lake Success, NY); HLA Class II DR (Becton Dickinson); and CD4, CD8, CD25, and CD56 (Becton Dickinson). Cells were stained according to the manufacturers’ recommendations, and isotype-matched negative controls were used for all antibodies.
Cytotoxicity assays.
Two types of assay were used to measure the effects of AdIL-2-transduced neuroblasts on cytotoxic effector function:
- (A)
For direct killing by peripheral blood mononuclear cells (PBM), PBM were cocultured with Cr51-labeled target cells (autologous neuroblasts or K562 cells) at effector:target ratios of 40:1, 20:1, 10:1, and 5:1, in a V-bottomed microtiter plate (Corning/Costar, Acton, MA). After 4 hours of incubation at 37°C, the supernatant was harvested and radioactive release measured. Maximal release of the incorporated chromium was determined by detergent lysis of the neuroblastoma cells. Percent-specific cytotoxicity was determined from the formula: % specific cytotoxicity = (cpm experimental - cpm spontaneous)/(cpm maximum release - cpm spontaneous) × 100%. To analyze the contribution of major histocompatability complex (MHC) Class-I restricted cytotoxic T lymphocytes (CTL) to effector function, 20 ug/mL of the anti-Class-I MHC MoAb W6/32 or isotype control (Dako Aarhuis, Denmark) was added to the neuroblastoma cells 30 minutes before the cytotoxicity assays.
- (B)
In patients lacking direct cytotoxicity, we also measured CTL precursor frequencies before and after immunization, as described previously.41 In brief, PBM were seeded in 96-well plates at rates between 2.4 × 10⁵ and 750 cells per well, at a dilution factor of 2. Each well was stimulated with 6 × 10³ irradiated (40 Gy) neuroblastoma cells, and 8 × 10⁴ irradiated (30 Gy) autologous PBM added as feeder layers. After 6 weeks in culture, responder cells were divided two ways to analyze cytotoxic precursor frequency. Autologous neuroblastoma cells were labeled with 51Cr and wells were counted as positive if the mean spontaneous Cr51 release was exceeded by 3 standard deviation (SD). Precursor frequency was estimated from the slope of a regression plot of the log percentage of negative wells versus the number of responder lymphocytes. To distinguish MHC-restricted CTL killing from MHC-unrestricted (AK cell) cytotoxicity, we measured isotope release in matching wells with or without 20 ug/mL of the MoAb W6/32.
Statistical analysis.
Phenotypic data and cytotoxic activity before and during treatment were compared by paired t testing.
RESULTS
Patients
All patients in this study had relapsed neuroblastoma (patient details are listed in Table 1). AdIL-2 gene-modified neuroblast doses were escalated as described in Materials and Methods, so that each child received between 105 and 107 modified neuroblasts/kg per subcutaneous injection, up to a maximum of 108 cells per dose. Ten patients entered on the study.
Patient Characteristics
| Patient Number . | Age at Diagnosis (years) . | Stage at Diagnosis . | Time to First Relapse (months) . | Relapse Number . | Courses of Chemotherapy Before Vaccine* . | Disease Sites Before Treatment . |
|---|---|---|---|---|---|---|
| 1 | 9.3 | IV | 12 | 1 | 0 | Thoracic paraspinous mass, bone, bone marrow-151 |
| 2 | 13 | IV | 12 | 1 | 0 | Thoracic and lumbar-151paraspinous mass |
| 3 | 3.3 | IV | 16 | 2 | 2 | Right cervical and axillary nodes, bone, bone marrow-151 |
| 4 | 3.5 | IV | 14 | 1 | 0 | Left cervical node, bone marrow-151 |
| 5 | 7 | IV | 72 | 2 | 1 | Pleural, pulmonary nodules, bone marrow-151 |
| 6 | 11 months | II | 24 | 4 | 3 | Cervical nodes-151 |
| 7 | 11 | III | 39 | 2 | 0 | Thoracic nodes, bone marrow-151 |
| 8 | 3.5 | IV | 30 | 4 | 1 | Bone marrow-151 |
| 9 | 5.25 | IV | 9 | 1 | 1 | Bone, bone marrow-151 |
| 10 | 17 | III | 58 | 1 | 1 | Left cervical-151 retroperitoneal nodes |
*Chemotherapy courses counted after relapse, before entry into study.
Source of tumor cells for vaccine.
The injections produced minimal adverse effects. A grade 1-2 inflammatory response was consistently observed at the injection site in patients receiving 105 or more cells/kg, and all but two of these patients also developed myalgia, which persisted for up to 2 weeks after the last injection. One patient had a more severe, influenza-like illness (patient 9), but was found to have a rapidly progressive malignancy to which these symptoms might have been related. Replication-competent adenovirus was not cultured from any patient, and no adenovirus vector was detected in peripheral blood samples by polymerase chain reaction (PCR) analysis.
Local Immune Response
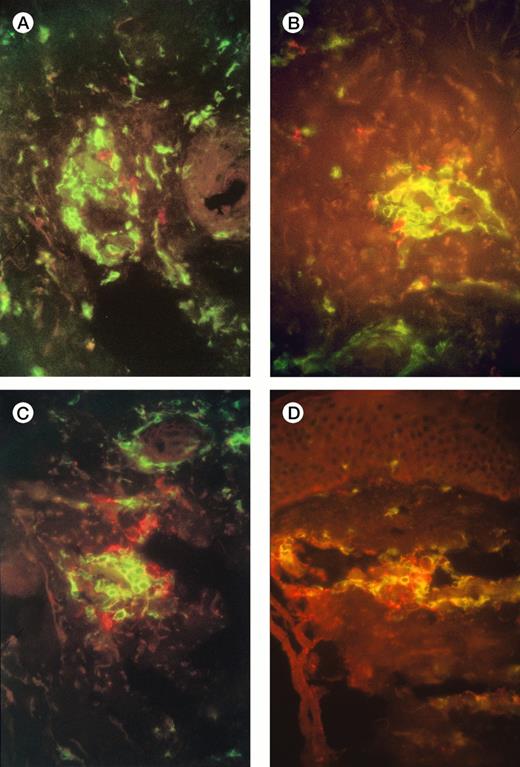
Examination of injection-site biopsies taken after 1 week showed a mild panniculitis with scanty infiltrating monocytes but a more apparent infiltration of CD3+ T cells around necrotic tumor cells. In 7 of the 10 patients the T-cell infiltrate was classified as moderate (10 to 100 cells/hpf: Fig 1A), in 2 it was light (<10 cells/hpf) , and in one heavy (>100 cells/hpf). Differential staining with CD4 and CD8 antibodies showed a preponderance of CD4+ T cells over CD8+, with a median ratio of 10:1 (range, 2:1 to 100:1) (Fig 1A and 1B). Staining with Vβ-specific antibodies (see Materials and Methods) showed that the infiltrate was polyclonal with no evidence of receptor skewing (data not shown). Finally, staining with the GD2 MoAb showed scanty, mainly necrotic, residual neuroblasts (Fig 1C, 1D)
Immunofluorescence studies of frozen sections of tissue taken from the injection sites of patients 3 and 7 one week after injection of IL-2-transduced autologous tumor cells. The figures show a moderate infiltration with T cells (A), and scanty surviving neuroblasts (B). (A,B) Patient 3 (A) and 7 (B) CD4+ T cells are green, and CD8+ T cells red; there is a preponderance of CD4+ cells. (C,D) Patient 3 (C) and 7 (D) CD4+ T cells are green, GD2+neuroblasts are red.
Immunofluorescence studies of frozen sections of tissue taken from the injection sites of patients 3 and 7 one week after injection of IL-2-transduced autologous tumor cells. The figures show a moderate infiltration with T cells (A), and scanty surviving neuroblasts (B). (A,B) Patient 3 (A) and 7 (B) CD4+ T cells are green, and CD8+ T cells red; there is a preponderance of CD4+ cells. (C,D) Patient 3 (C) and 7 (D) CD4+ T cells are green, GD2+neuroblasts are red.
Systemic Immune Response: Natural Killer (NK) Cells, T-Helper Lymphocytes, and Cytotoxic T-Lymphocytes
NK cell and T-lymphocyte populations.
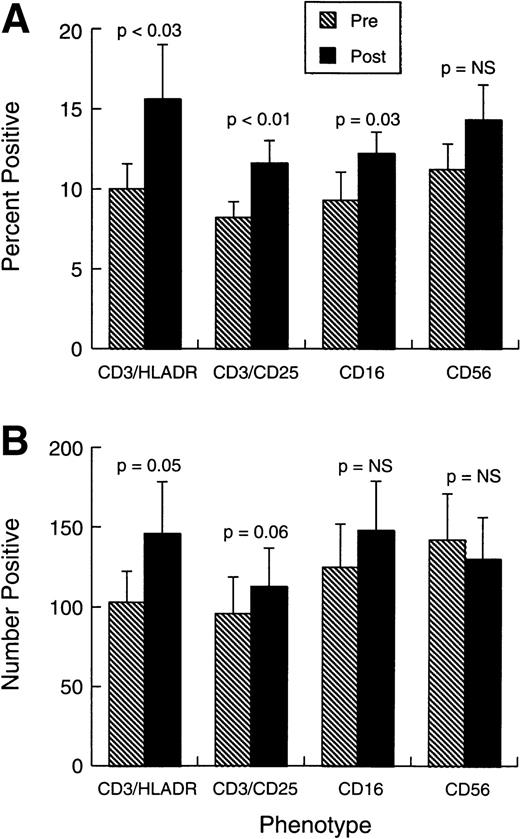
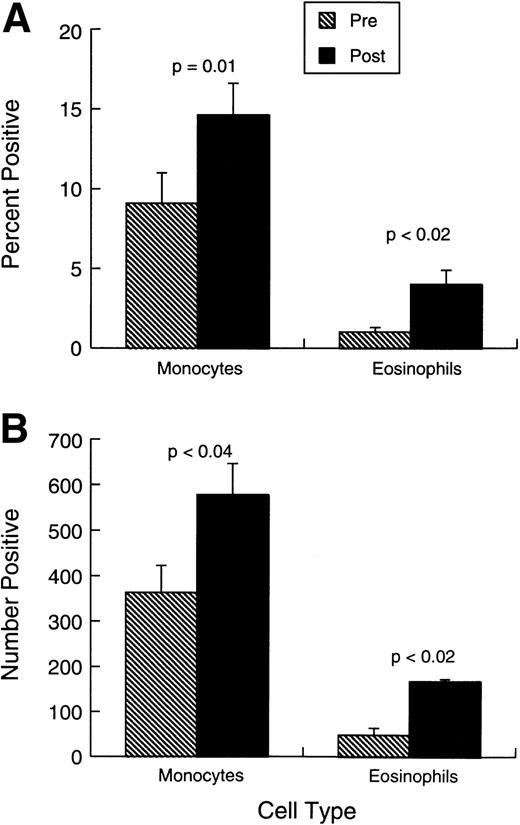
Changes observed in systemic immunity involved both NK cells and T lymphocytes. Phenotypically (Fig 2A and B), there was a modest but consistent and statistically significant rise in the proportions and absolute numbers of CD3+HLADR+ and CD3+CD25+ cells in the absence of any change in the overall proportions or numbers of CD3+ T cells. The mean proportion of CD3+CD4+ cells changed little during treatment (from 28.2% ± 4.9% standard error [SE] to 32% ± 5.3%), whereas CD3+CD8+ cells were similarly unaffected (from 21.4% ± 3.9% to 23.4% ± 4.2%). Figure 2A and B also shows that there was a small increase in the representation of CD16+ cells, but CD56 cell percentages and numbers were unaffected by the treatment. No shift was observed in Vb-receptor usage (data not shown), indicating the responses induced were likely polyclonal. There was also a significant rise in the proportions and absolute numbers of circulating eosinophils and monocytes (Fig 3A and B).
Phenotypic changes in patient cell populations before treatment and 0 to 7 days after last injection. (A) Bars represent the mean proportion ± SEM (n = 10) of cells positive for each marker combination at each study point. (B) Bars represent the absolute number (per μL) ± standard error of mean (SEM) (n = 10) of cells positive for each marker combination at each study point.
Phenotypic changes in patient cell populations before treatment and 0 to 7 days after last injection. (A) Bars represent the mean proportion ± SEM (n = 10) of cells positive for each marker combination at each study point. (B) Bars represent the absolute number (per μL) ± standard error of mean (SEM) (n = 10) of cells positive for each marker combination at each study point.
Changes in monocytes and eosinophils before treatment and 0 to 7 days after last injection. (A) Bars represent the mean proportion ± SEM (n = 10) of monocytes and eosinophils. each study point. (B) Bars represent the absolute number (per microliter) ± SEM (n = 10) of monocytes and eosinophils.
Changes in monocytes and eosinophils before treatment and 0 to 7 days after last injection. (A) Bars represent the mean proportion ± SEM (n = 10) of monocytes and eosinophils. each study point. (B) Bars represent the absolute number (per microliter) ± SEM (n = 10) of monocytes and eosinophils.
Tumor-specific responses.
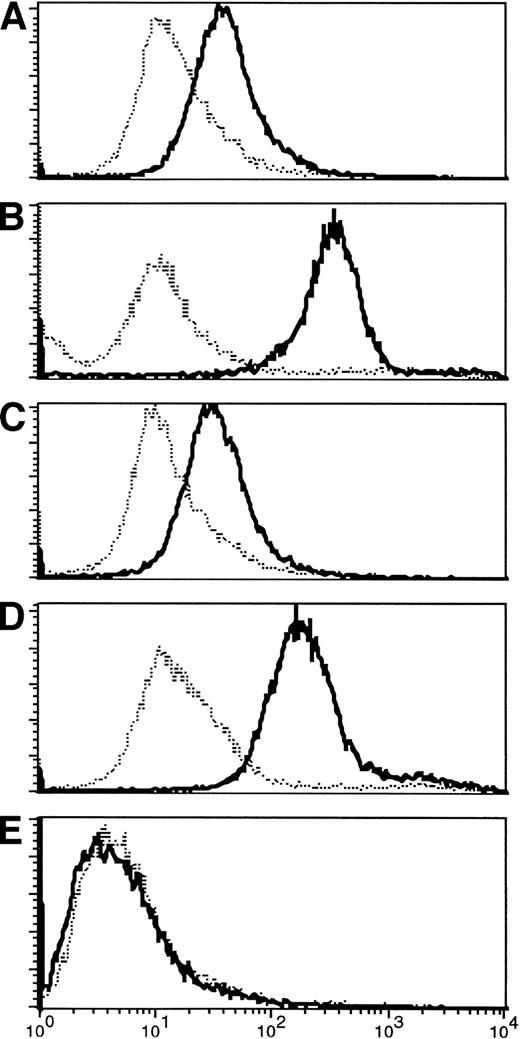
The limited phenotypic changes observed were associated with much more striking increases in the specific responses to the tumor. In the T-lymphocyte population, there was recruitment of both helper and cytotoxic T-cell responses with antitumor specificity. Helper T-cell activity was evident from the development of IgG antitumor antibodies postimmunization in four of nine immunologically evaluable patients (Fig 4).
(A-D) Appearance of IgG antibody to tumor cells after immunization. Pretreatment fluorescence in all patients was at the level of controls (normal human serum). Three to 6 weeks after the first immunization, four of the patients analyzed (numbers 1, 3, 5, 6) who are shown here had increased antibody binding to autologous tumor cells, shown by an increase in fluorescence activity. Increased activity persisted at least 3 months after completion of therapy. (E) For comparison, a nonresponding patient is shown.
(A-D) Appearance of IgG antibody to tumor cells after immunization. Pretreatment fluorescence in all patients was at the level of controls (normal human serum). Three to 6 weeks after the first immunization, four of the patients analyzed (numbers 1, 3, 5, 6) who are shown here had increased antibody binding to autologous tumor cells, shown by an increase in fluorescence activity. Increased activity persisted at least 3 months after completion of therapy. (E) For comparison, a nonresponding patient is shown.
We also investigated whether the adenovirus vector was able to generate an antiadenovirus response that might affect the efficacy or toxicity of the vaccine. We found no change in titers of antibody directed to adenovirus (Table 2), even in patients who were already highly immune to adenovirus.
Detection of Antiadenoviral IgG Antibodies
| Patient . | Immune Status . | |
|---|---|---|
| Pre . | Post . | |
| 1 | 9.2 | 11.6 |
| 2 | 11.6 | 12.4 |
| 3 | 3.4 | 3.6 |
| 4 | 3.8 | 11.9 |
| 5 | 8.5 | 6.5 |
| 6 | <2.0 | <2.0 |
| 7 | 4.5 | 4.3 |
| 8 | 8.8 | 9.1 |
| Patient . | Immune Status . | |
|---|---|---|
| Pre . | Post . | |
| 1 | 9.2 | 11.6 |
| 2 | 11.6 | 12.4 |
| 3 | 3.4 | 3.6 |
| 4 | 3.8 | 11.9 |
| 5 | 8.5 | 6.5 |
| 6 | <2.0 | <2.0 |
| 7 | 4.5 | 4.3 |
| 8 | 8.8 | 9.1 |
Detection of antiadenoviral IgG antibodies was performed by enzyme immunoassay. The results are reported as standard deviations above the mean of a reference group of nonimmune subjects: <2.0 = nonimmune; 2.0-2.9 = +/− immune; 3.0-5.0 = + immune; >5.0 = ++ immune. Pairedt testing showed no significant effect for immunization.
Longitudinal analysis of tumor-specific cytotoxicity.
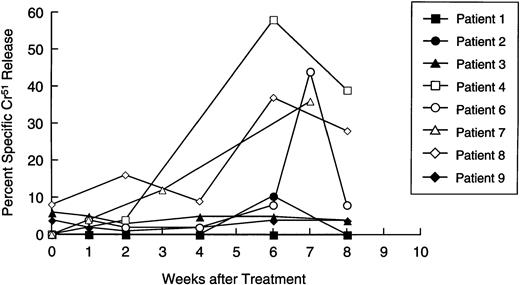
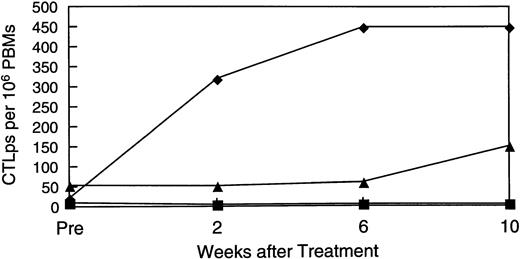
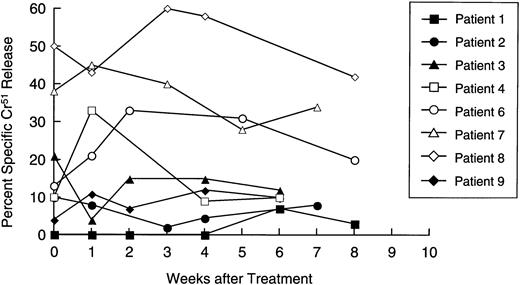
Availability of samples allowed us to make a longitudinal analysis of tumor-specific cytotoxic activity in eight patients. Initially, PBM were cultured with nontransduced neuroblasts in a standard 4-hour Cr51 release assay, to measure circulating tumor-specific CTL. Figure 5 shows that four patients (numbers 4, 6, 7, and 8) showed a significant and substantial rise in CTL activity against autologous targets. In patient 6, marked elevation was observed only at one time point. However, this cytotoxicity was titratable through all E:T ratios tested (from 51% to 11%). In all patients with measurable cytotoxicity, addition of anti-Class-I MHC antibody reduced killing by a mean of 57% (range, 23% to 91%;P< .001), suggesting that a significant proportion of the cells responsible for effector function were classical CTLs. Of the patients whose freshly isolated PBM showed no increased killing of tumor cells, one (patient 2) showed a 40-fold rise in neuroblastoma-specific CTL precursor frequency during treatment (Fig 6). Hence, five of the eight patients examined for a cytotoxic antitumor response showed a significant increase in activity during treatment. These shifts in tumor-specific response were not associated with any consistent alteration in NK activity (measured by killing of K562 cells), which remained essentially unchanged throughout the treatment period (Fig 7).
Longitudinal analysis of cytotoxic activity against autologous neuroblasts. Patient lymphocytes were cultured with51Cr-labeled autologous neuroblasts at an E:T ratio of 40:1, 20:1, and 10:1 at increasing time intervals after immunization. Each line shows specific isotope release from a single patient, at an E:T ratio of 40:1.
Longitudinal analysis of cytotoxic activity against autologous neuroblasts. Patient lymphocytes were cultured with51Cr-labeled autologous neuroblasts at an E:T ratio of 40:1, 20:1, and 10:1 at increasing time intervals after immunization. Each line shows specific isotope release from a single patient, at an E:T ratio of 40:1.
Rise in CTL precursor frequency. Patients who showed no increase in direct cytotoxic activity were examined for a rise in CTL precursor frequency of these individually. Patient 2 (shown here) showed a 40-fold rise over the treatment period.
Rise in CTL precursor frequency. Patients who showed no increase in direct cytotoxic activity were examined for a rise in CTL precursor frequency of these individually. Patient 2 (shown here) showed a 40-fold rise over the treatment period.
Longitudinal analysis of natural killer cell activity. Patient lymphocytes were cultured with 51Cr-labeled K562 cells at effector:target ratios of 20:1,10:1, and 5:1 at increasing time intervals after immunization. Each line shows specific isotope release from a single patient at an E:T ratio of 20:1.
Longitudinal analysis of natural killer cell activity. Patient lymphocytes were cultured with 51Cr-labeled K562 cells at effector:target ratios of 20:1,10:1, and 5:1 at increasing time intervals after immunization. Each line shows specific isotope release from a single patient at an E:T ratio of 20:1.
Tumor Response
Results are summarized in Table 3. At the initial 6-week evaluation, patient 7 showed regression of her paratracheal mass. Four additional patients (numbers 2, 4, 8, and 10) were initially classified as having stable disease at 6 weeks. Of these individuals, patient 8 with extensive marrow involvement subsequently entered complete remission and remains free of measurable disease >6 months after therapy, whereas patient 10 remains with stable disease. Patients 2 and 4 were treated with oral etoposide immediately after the evaluation period: patient 2 had a >90% tumor response, and patient 4 entered a complete remission that has been sustained for >319 days. Overall, 3 of 10 patients showed tumor responses (1 complete, 1 partial, 1 stable disease) to the vaccine alone, whereas 3 additional patients responded (1 complete, 2 partial) to therapy with a combination of vaccine followed by oral etoposide.
Response and Toxicity
| Patient No. . | Dose Level* . | Response (6 weeks) . | Therapy After 6-Week Evaluation . | Response to Subsequent Therapy . | Status (6 months) . | Current Status (Survival) in Days . |
|---|---|---|---|---|---|---|
| 1 | 1 | PD | Oral etoposide (8 courses) | VGPR | Well VGPR | DOD (350) |
| 2 | 1 | SD | Oral etoposide (12 doses) | VGPR | Well VGPR | AWD (485) |
| 3 | 1 | PD | None | PD | DOD | (94) |
| 4 | 2 | SD | Oral etoposide (3 courses) | CCR | CCR | CCR (319+) |
| 5 | 2 | MR | MIBG-radionucleide | SD | Well SD | DOD (222) |
| 6 | 2 | PD | Phenybuteral CPT11 | PD | AWD | AWD (283+) |
| 7 | 3 | PR | None | — | Well PR | AWD (300+) |
| 8 | 3 | SD | None | — | CCR | CCR (180+) |
| 9 | 3 | PD | Oral etoposide (1 course) | SD | TE | AWD (171) |
| 10 | 3 | SD | None | — | TE | AWD (150+) |
For definition of responses see text: Patients 2, 4, 7, 8, 10 were considered to have a response or disease stability after the tumor immunogen alone.
Abbreviations: PD, progressive disease; SD, stable disease; MR, mixed response; PR, partial response; VGPR, very good partial response; DOD, died of disease; AWD, alive with disease; TE, too early.
For cells given at each dose level see Materials and Methods.
Of the 5 patients who had stable disease or tumor regression at week 6 (patients 2, 4, 7, 8, and 10), 4 were evaluated for antitumor cytotoxic responses; all had coexisting activity (Figs 5 and 6); conversely, of the 4 patients with progressive disease, only 1 (patient 6) made an antitumor cytotoxic response. Of the 10 patients studied, 7 are alive 150 to 485 days after completing treatment; 6 have measurable residual disease.
DISCUSSION
Studies in various animal models have shown that tumor cells, including IL-2-transduced neuroblasts, can generate a systemic immune response capable of delaying the growth of unmodified tumor cells that express the same tumor-related or tumor-specific antigens.1-8 As we have shown, these observations can translate well into clinical practice. Both a local and a systemic antitumor immune response were generated in children given injections of autologous unirradiated neuroblastoma cells gene-modified to secrete IL-2. Although the local response consisted predominantly of CD4 T cells, the systemic antitumor response was more broadly based, and included both a T-helper cell response (manifested by antitumor antibody production) and increased cytotoxic T- lymphocyte activity directed against autologous tumor cells. CTL activity was discernible both by direct killing of autologous neuroblasts and by an increase in the specific CTL-precursor frequency. There was also evidence for limited recruitment of nonspecific effector mechanisms, with an increase in monocytes and eosinophils.
Although a potent increase in antitumor activity was observed after injection of IL-2-modified neuroblasts, there was no discernible increase in humoral antiadenoviral immune response, even in patients with prior adenovirus immunity. Presumably, the ex vivo transduction protocol did not transfer sufficient virus particles to induce a virion-specific response, whereas the E1/E3-deleted vector itself likely expresses too few adenovirus antigens in neuroblastoma cells to induce an adenovirus-specific antibody response through the endogenous antigen processing pathway.42,43 We were unable to obtain sufficient material from these pediatric patients to discover whether a cellular immune response to the adenovirus vector developed. If such a response does occur, it evidently does not destroy the infected cells so rapidly as to preclude a substantial antitumor response.42 43
Injection of the AdIL-2-transduced tumor cells was well tolerated apart from systemic myalgia. Because we did not detect an antiadenovector immune response, and because no patient released measurable adenovirus after treatment, we believe the systemic symptoms were a consequence of the immune activation induced by the gene-modified cells. Certainly, systemic recruitment of T cells and eosinophils requires release of a range of cytokines, including IL-1, TNF, IL-6, gamma interferon, and IL-2, any of which may have contributed to the patients’ symptoms. We are now investigating whether systemic cytokine release could account for the adverse effects.44
At the initial 6-week evaluation, four patients had stable disease and only one had shown a PR. Subsequently, however, one of the patients with stable disease progressed to a complete tumor response. Hence, in contrast to the relatively rapid responses usually observed after chemotherapy and radiotherapy, a clinically evident antitumor immune response may require many weeks, and evaluation should be correspondingly delayed. Our data also suggest a link between the development of antitumor immunity and the detection of a tumor response. Four of five patients with tumor regression or stable disease had a tumor-specific CTL response, whereas only one of the four patients with progressive disease had antitumor activity. In this last individual (patient 6), a lymph node taken from a site of disease progression was densely infiltrated with T cells, with only scanty residual tumor. Although these data are consistent with a link between CTL activity and tumor response, this connection will need to be confirmed in a larger study. It is less likely that modulation of NK cells contributed to the antitumor response. NK activity showed little or no change in response to immuniztion, and primary neuroblasts have only limited susceptibility to killing by this effector population.27 28 If a link between CTL activity and disease response is genuine, subsequent disease persistence or progression may be caused by either the gradual dwindling of the antitumor response or the emergence of antigenic loss variants of neuroblastoma. This distinction is an important one. If late relapse is due to a decline in immune responsiveness, then repeated immunization over a prolonged period may be required. If recurrence is due to the emergence of antigenic loss variants, the approach might best be limited to individuals with minimal residual disease in whom the risk of further tumor mutation would be lower.
We have shown that IL-2-transduced autologous neuroblasts can induce antitumor immune responses in patients with advanced neuroblastoma. How may the benefits of this approach be increased? One possibility is to transfer alternative immunostimulatory genes. Human tumor cells have been transduced with genes encoding many such molecules, and of these, granulocyte-macrophage colony-stimulating factor (GM-CSF) and HLA-B7 have been reported to induce localized antitumor immunity.9,10,45 We cannot directly compare the immunologic or antitumor potency of these alternative agents with our own approach, because none of the other studies were performed in children with neuroblastoma. Although other single immunostimulatory molecules may possibly produce an antineuroblastoma response superior to that of IL-2, we believe that to obtain the optimal T-cell immune response to human tumors from this approach will require combining different classes of immunostimulatory molecules. In animal models, for example, the combination of the T-lymphocyte chemokine lymphotactin and the T lymphocyte growth factor IL-2 enhance and accelerate antitumor responses as compared with any one agent alone.46 47Because current single-agent genetic immunotherapy approaches evidently produce effective systemic antitumor responses in humans, there is reason to hope that these molecular combinations will be successful in the clinical setting. To be effective, the combinatorial approach will require the availability of safe vectors that can rapidly and reliably transduce a high percentage of primary human tumor cells. For neuroblastoma at least, our results show that adenovirus vectors meet these requirements.
In conclusion, we have evidence that clinically effective antitumor immune responses can be safely produced in children with advanced neuroblastoma by adenovector-mediated transfer of the IL-2 gene. It will now be of interest to discover whether the immune response and antitumor response can be further enhanced by appropriate combinations of immunostimulatory molecules.48
ACKNOWLEDGMENT
We would like to thank Jing Feng Zhao, Marti Holladay, and Michael Khouri for technical assistance; Sharon Naron for scientific editing; and Tracie Keahey for word processing. We are grateful to all our medical colleagues who referred patients for this study.
Supported by National Institutes of Health Core Grants No. RO1 CA58211 and P30 CA21765, by the Assisi foundation, and by ALSAC (American, Lebanese, Syrian Associated Charities).
Address correspondence to Malcolm K. Brenner, Texas Children’s Hospital, 6621 Fannin MC 3-3320, Houston, TX 77030.
The publication costs of this article were defrayed in part by page charge payment. This article must therefore be hereby marked "advertisement" is accordance with 18 U.S.C. section 1734 solely to indicate this fact.

This feature is available to Subscribers Only
Sign In or Create an Account Close Modal