Abstract
Tissue inhibitors of metalloproteinases (TIMPs) have been shown to be multifunctional factors. Contrasting with their enzyme-inhibitory activity, TIMPs also promote cell growth. Previously, we have reported an enhanced expression of TIMP-1 by normal reactive B cells and high-grade lymphomas. In the present study, a series of Burkitt’s lymphoma (BL) cell lines were analyzed for their expression of TIMP-1. TIMP-1 expression correlates with upregulation of activation and survival markers. TIMP-1–negative cells express the phenotype associated with group I BL lines and Epstein-Barr virus (EBV)-negative, nonendemic BLs (CD10+, CD38+, sIg+, and CD77+). However, TIMP-1+ BL lines showed group II/III BL phenotype, downregulation of the above markers, and upregulation and secretion of the activation marker CD23. Also, TIMP-1+ cells have high levels of CD40 expression. To determine whether TIMP-1 is directly involved in the BL phenotype, an EBV-negative BL line JD38 was infected with timp-1–expressing retrovirus and analyzed. In the absence of EBV, upregulation of TIMP-1 is sufficient to induce the same phenotype seen in TIMP-1+, EBV+ BL lines (CD10−, CD38−, sIg−, CD77−, CD23+, CD40 bright). This study not only suggests a role for TIMP-1 in BLs, but also supports its value as a prognostic factor.
This is a US government work. There are no restrictions on its use.
THE EXTRACELLULAR matrix (ECM) integrates cell function in tissues at various levels by regulating cell growth, differentiation, and cell death.1-3 Likewise, deregulated cell response to ECM is a determinant of disease processes such as tumor invasion and metastasis.4 Tissue inhibitors of metalloproteinases (TIMPs) as components of ECM have been shown to be important in the control of metastasis by inactivating matrix metalloproteinases (MMPs).5,6 However, TIMPs have also been shown to exhibit other functions independent of their MMP inhibitory activity. TIMP-1 and TIMP-2 have erythroid potentiating activity (EPA) and promote cell growth in a wide range of cells, including fibroblasts and hematolymphoid cells.7-10 Moreover, cell lines infected with human T-cell leukemia virus type 1 (HTLV-1) and HTLV-2 show upregulated TIMP-1 expression, which is mediated by transactivator protein (TAX) transactivation of the TIMP-1 gene.11 We have recently reported on the high level of TIMP-1 expression by high-grade B-cell lymphomas as well as normal, activated B cells.12 Furthermore, TIMP-1 levels correlate with histological grade in B-cell non-Hodgkin’s lymphomas.13 We have shown that TIMP-1 expression in Burkitt’s lymphoma (BL) cell lines inhibits induction of apoptosis by Fas-dependent and independent pathways and upregulates BCL-XL.14 These studies support a role for TIMP-1 in the growth of hematolymphoid tumors.
BL is a highly malignant B-cell tumor originating from centroblasts in the germinal center of lymph nodes.15,16 This central area of the lymph node is characterized by a high rate of apoptosis and the close interaction with the microenvironment (including ECM) that promotes the normal process of B-cell maturation.15Although all Burkitt’s lymphomas display chromosomal translocations involving c-myc, they differ in their association with the Epstein-Barr virus (EBV), with a 95% incidence of infection being observed in the endemic or African type, whereas only 20% of sporadic or American cases are associated with EBV.16 Although EBV infection in BLs is not productive,17 most of the cell lines established in vitro from BLs show various degrees in the expression of latent EBV genes, and some of them acquire a lymphoblastic phenotype.16 Thus, phenotypic changes in these cell lines are believed to be dependent on latent viral gene expression and allow classification into groups I to III.16,17 Group I BL, as well as EBV-negative nonendemic BL lines, retain the phenotype of the original biopsy (CD10+, CD38+, sIg+, CD77+) and readily undergo apoptosis. Group II/III BL lines downregulate these markers, while acquiring a lymphoblastic phenotype, and are more resistant to apoptosis.17,18 Unlike group I, these latter lines are characterized by expression of the full complement of viral genes.17 Progression toward a lymphoblastic morphology and resistance to programmed cell death is also obtained in vitro as result of transformation of normal B cells by some EBV strains.19These results suggest that EBV gene expression controls not only phenotype in BL but also increases resistance to apoptosis.
BL cell lines have been widely used as a model to study both B-cell malignant transformation and normal mechanisms of the B-cell physiology.15,20 We have previously shown TIMP-1 expression by centroblast-like BL cell lines but not by follicular lymphoma cell lines, indicating that TIMP-1 may be operative at a specific stage in the germinal center.12 As phenotype reflects germinal center stage, as well as EBV latency group, we undertook the study of the effect of TIMP-1 expression in BL. In the present study, we have determined that TIMP-1 is not expressed by EBV-negative and group I BL lines. Furthermore, greater levels of TIMP-1 are shown by lymphoblastic BL lines. The data indicate that TIMP-1 expression is correlated with a blast phenotype. To determine whether TIMP-1 was involved in the phenotypic changes in the BLs, an EBV-negative Burkitt’s line transfected with human timp-1 was also analyzed. Results strongly suggest that TIMP-1 upregulation is sufficient to induce a more mature, activated phenotype in Burkitt’s lines even in the absence of EBV. This report further supports the importance of TIMP-1 expression in BLs and suggests that similar studies should be undertaken for other B-cell malignancies with the hope of determining the value of TIMP-1 as a prognostic factor and for formulating novel modalities of treatment.
MATERIALS AND METHODS
Cell cultures and treatments.
The BL cell lines JD38, DW6, AG876, ST846, and PA682 were kindly provided by Dr Ian Magrath21-23 from the Lymphoma Biology Section, National Cancer Institute; Jijyoe and Daudi were obtained from ATCC, Rockville, MD. The LXSN retroviral transduction was used to induce TIMP-1 expression in the TIMP-1–negative BL cell line JD38 as described.14 Briefly, TIMP-1 cDNA was obtained by polymerase chain reaction and subcloned into LXSN by using DNA recombinant techniques. Empty LXSN or TIMP-1–LXSNconstructs were transfected into packaging cell lines. Nonadherent JD38 cells were cocultured with adherent LXSN or LXSN–TIMP-1 packaging cells (GP+envAM12) for 48 hours. LXSN and TIMP-1–LXSN infected JD38 cells were then selected by using 2,500 mg/mL G418 (GIBCO-BRL, Grand Island, NY) for 10 days. Individual clones were selected by repeated limiting dilution. Clonality was confirmed by restriction enzyme digestion with Sma I and Southern blot analysis, with unique sites of integration detected in the JD38 cell clones used in this study. JD38 cell clones have been stable for TIMP-1 expression and phenotype for over 2 years. Cells were cultured in RPMI 1640 supplemented with 10% fetal bovine serum (FBS), 100 mg/mL penicillin G, 100 mg/mL streptomycin sulfate, and L-glutamine (GIBCO BRL, Rockville, MD) and incubated in 5% CO2, 95% humidity at 37°C. TIMP-1–JD38 (clone 24) cells (3 × 10⁵cells/mL) were also incubated in RPMI 1640 media containing 1% FBS and 5 μg/mL of anti–TIMP-1 neutralizing antibody (Oncogene Sciences, La Jolla, CA) or isotype control (Jackson ImmunoResearch, West Grove, PA). After 48 hours, cells were checked for phenotypic changes by immunostaining and flow cytometry. Three independent experiments were performed.
TIMP-1 enzyme-linked immunosorbent assay (ELISA) determination.
Secreted TIMP-1 was quantitated by using a Biotrak TIMP-1 ELISA kit (Amersham, Arlington Heights, IL) that detects free TIMP-1, as well as MMP-bound TIMP-1. Equal numbers of cells (5 × 10⁵/mL) were cultured in fresh medium. After 48 hours, cells were centrifuged and supernatants were tested for TIMP-1 following the manufacturer’s instructions. All ELISA determinations were performed three times, with triplicate samples within each determination.
Western blot analysis.
BL cell lines as well as TIMP-1–transfected and LXSN-control JD38 cell clones were cultured (5 × 10⁵ cells/mL) for 48 hours in serum-free RPMI media. Conditioned media was collected after centrifugation, and 20 to 40 μL was electrophoresed in a 4% to 20% (wt/vol), polyacrylamide/sodium dodecyl sulfate (SDS) gel at 100 V for 60 minutes at room temperature. Proteins were electroblotted onto polyvinylidine difluoride membrane (Novex, San Diego, CA). After blocking with Tris-buffered saline (TBS) containing 5% nonfat dry milk, membrane was washed and blotted with monoclonal anti–TIMP-1 antibody (Oncogene Sciences) with 1:1000 dilution. After repeated washes in TBS, the blots were developed with a horse radish peroxidase-conjugated goat antimouse antibody diluted 1:10000 (Pierce, Rockville, IL) and a chemiluminescence kit (DuPont, NEN, Boston, MA). Blots were exposed to luminescence detection film (Amersham, Arlington Heights, IL). Three independent analyses were performed.
TIMP-1 functional analysis.
Two independent TIMP-1–JD38 cell lines, clones 20 and 24, as well as control LXSN-JD38 cells (5 × 10⁵ cells/mL) were incubated in serum-free conditions for 24 hours. Supernatants (25 mL) were cleared from cells by centrifugation and concentrated 10 times by ultrafiltration. Equal amounts of total protein were separated and analyzed by reverse zymography as previously reported.24Briefly, electrophoresis was performed in a 15% acrylamide gel containing 2.25 mg/mL porcine gelatin (Sigma, St Louis, MO), 0.125% SDS and 160 ng/mL of progelatinase (gift from Dr William Stetler-Stevenson, the Extracellular Matrix Pathology Section, Laboratory of Pathology, National Cancer Institute) at 120 V for 1.5 hours. The reverse zymogram was removed and washed in 2.5% Triton-X for 3 hours and constant shaking. After incubation with activating enzyme buffer (50 nmol/L Tris, pH 7.5, 200 nmol/L NaCl, 5 mmol/L CaCl2, 0.02% Brij-35) at 37°C for 15 hours, zymogram was fixed in methanol/acetic acid and stained with 0.5% Coomassie blue. TIMP-1 was visualized as dark blue band of 28-kD mass by indication of the inhibition of gelatin digestion. Supernatant from HT1080 cells was used as positive control for the detection of TIMPs.
Immunostaining.
After washing twice in phosphate-buffered saline (PBS) containing 1% bovine serum albumin (BSA), 1 × 10⁶ cells were incubated with fluorochrome-conjugated monoclonal antibodies (MoAbs) against the following B-cell differentiation antigens: fluorescein isothiocyanate (FITC)-CD38, FITC-CD20, phycoerythrin (PE)-CD23, PE-CD5, FITC-CD45/PE-CD14, FITC-mouse IgG1, and Isotype controls FITC-IgG/PE-IgG2 (Dako, Carpenteria, CA); PE-CD19 and PE-CD38 (Becton-Dickinson, San Jose CA); FITC-antihuman IgG1, IgM, IgA, IgD (Tago, Burlingame, CA); PE-CD40 and unconjugated CD77 (Immunotech, Miami, FL); and FITC and PE-CD10 (Coulter, Miami, FL). After each incubation at 4°C in the dark, cells were rinsed with PBS and secondary antibody FITC goat-antimouse (Caltag, San Francisco, CA) was added, when necessary, for 30 minutes followed by washing twice with PBS. Five independent immunostaining analyses were performed.
Flow cytometry analysis.
Immunofluorescent-labeled cells were analyzed in a FACSCAN (Becton-Dickinson, San Jose, CA) with CellQuest software (Becton-Dickinson) to determine the percentage of positive cells. Fluorescence intensity was also calculated. After data acquisition, fluorescent calibrated beads (Flow Cytometry Standards, San Juan, PR) were used to standardize fluorescence intensity of different antigens and expressed as molecule equivalent of surface fluorochrome (MESF) units.
Determination of total IgM.
In addition to cell surface IgM, parental JD38 cells, as well asLXSN-JD38 and TIMP-1–JD38 cells, were also analyzed for their production of intracellular and secreted IgM. Equal number of cells (106 cells/mL) were incubated in fresh culture media. After 48 hours, supernatants were cleared by centrifugation. Cell pellets were rinsed with PBS and proteins extracted with RIPA buffer (150 mmol/L NaCl, 1% nonidet P-40 [NP-40], 0.1% SDS, 50 mmol/L Tris-HCL, pH 8.0) containing the protease inhibitors 1 mmol/L phenylmethylsulfonyl fluoride (PMSF), 0.23 U/mL aprotinin, and 10 mmol/L leupeptin. After 30 minutes incubation at 4°C, cell lysates were centrifuged in a microcentrifuge and postnuclear fractions were collected. IgM was measured in protein fractions as well as in tissue culture supernatants by a double-antibody ELISA. Plates for the IgM ELISA were prepared by the Diagnostic and Clinical Research Division of PharMingen (San Diego, CA). Determination of total IgM was performed in triplicate for three experiments.
Quantitation of secreted CD23.
Cells (1 × 10⁶) were cultured in 2 mL of media. After 48 hours, supernatants were cleared of cells by centrifugation. Concentration of secreted CD23 was determined by a double-antibody sandwich ELISA (Biosource, Camarillo, CA) and read at 450 nm optical density. Quantitation of secreted CD23 was performed in triplicate for three experiments.
Correlation analysis.
Association of TIMP-1 production and expression intensity of cell surface markers was analyzed by using Spearman rank correlation coefficients (Biostatistics and Data Management Section, National Cancer Institute).
RESULTS
BL phenotype and TIMP-1 expression.
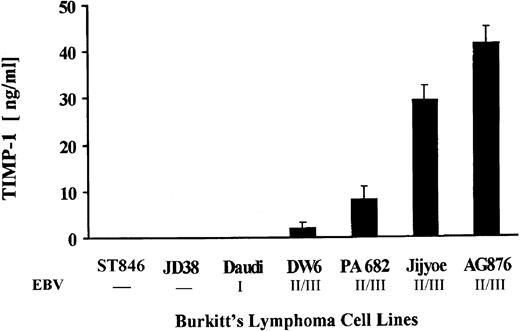
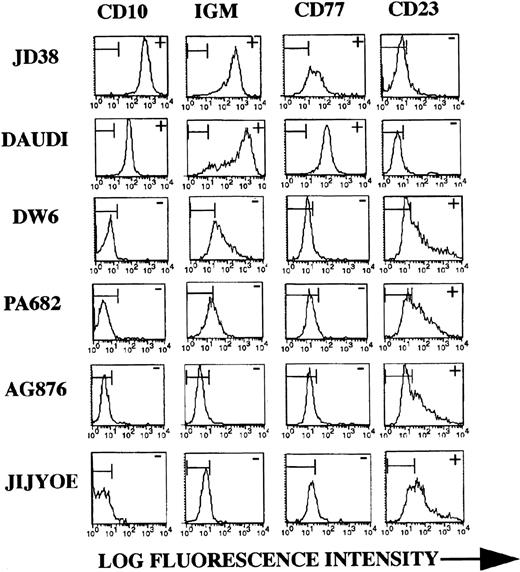
Both EBV-negative, as well as EBV-positive BL lines with differential viral latency expression were assessed for TIMP-1 secretion. Figure 1 shows production of TIMP-1 by the seven lines studied. Lines DW6, PA682, Jijyoe, and AG876 secrete TIMP-1. These cell lines also show advanced (ie, group II/III) EBV latency.21-23 Lack of TIMP-1 expression is seen by the group I line Daudi, as well as by the EBV-negative lines JD38 and ST846 (this confirms our previous results showing lack of TIMP-1 RNA expression in these cell lines).14 Phenotypic analysis of these cell lines shows changes in the cell surface markers typically seen in germinal center tumors. Figure 2shows representative flow cytometric analyses for two (JD38 and Daudi) of the three TIMP-1–negative tumors analyzed as well as for four (PA682, AG876, Jijyoe, and DW6) TIMP-1–positive lines. TIMP-1–negative BL lines express CD10, CD77, and cell surface IgM, whereas TIMP-1–positive BL lines show downregulation of these markers accompanied by upregulation of the activation marker CD23. These results not only indicate that TIMP-1 expression correlates with EBV latency group in BL cell lines but is also associated in these tumors with changes in the germinal center phenotype that occurs with the generation of lymphoblasts. All cell lines were CD5 negative and expressed the same levels of CD20, CD19, and CD45 (data not shown).
TIMP-1 production by BLs. Cell lines were assayed for TIMP-1 secretion by ELISA analysis of conditioned media. Number below cell lines indicate negative or EBV latency grade. The X-axis shows BL cell lines studied. The Y-axis shows TIMP-1 in ng/mL. Data represent triplicate determinations ± standard deviation (SD) of three experiments.
TIMP-1 production by BLs. Cell lines were assayed for TIMP-1 secretion by ELISA analysis of conditioned media. Number below cell lines indicate negative or EBV latency grade. The X-axis shows BL cell lines studied. The Y-axis shows TIMP-1 in ng/mL. Data represent triplicate determinations ± standard deviation (SD) of three experiments.
BL phenotype and TIMP-1 expression. Representative flow cytometric analysis of cell lines with differential TIMP-1 secretion as shown in Fig 1. JD38 and Daudi are negative for TIMP-1 whereas DW6, PA682, AG876, and Jijyoe express variable levels. TIMP-1–negative BL lines express high-level CD10, surface IgM, and CD77 (similar results obtained with all three TIMP-1–negative lines studied). TIMP-1+ BL lines show downregulation of the follicular center markers CD10, surface IgM, and CD77 along with upregulation of activation marker CD23 seen with all four TIMP-1–positive BL lines studied. The X-axis shows log fluorescence intensity. The Y-axis shows the number of cells. Horizontal bars in histograms indicate nonantibody binding as determined by irrelevant isotype control antibodies. Data are representative of five independent experiments.
BL phenotype and TIMP-1 expression. Representative flow cytometric analysis of cell lines with differential TIMP-1 secretion as shown in Fig 1. JD38 and Daudi are negative for TIMP-1 whereas DW6, PA682, AG876, and Jijyoe express variable levels. TIMP-1–negative BL lines express high-level CD10, surface IgM, and CD77 (similar results obtained with all three TIMP-1–negative lines studied). TIMP-1+ BL lines show downregulation of the follicular center markers CD10, surface IgM, and CD77 along with upregulation of activation marker CD23 seen with all four TIMP-1–positive BL lines studied. The X-axis shows log fluorescence intensity. The Y-axis shows the number of cells. Horizontal bars in histograms indicate nonantibody binding as determined by irrelevant isotype control antibodies. Data are representative of five independent experiments.
TIMP-1 levels and B-cell differentiation.
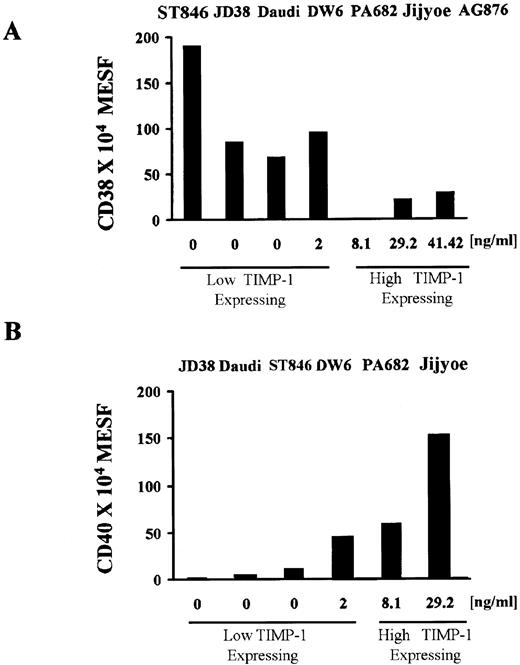
We next determined whether TIMP-1 expression was related to differentiation state in BL cell lines. Immunoglobulin (sIg) and CD38 antigen expression both vary during B-cell development and can be used to determine B-cell differentiation.25 Downregulation of surface IgM in the TIMP-1+ cell lines indicates that these tumors may be more mature (Fig 2). During B-cell maturation, the level of CD38 expression decreases from the early B cell, which is a high expressing cell, to the mature B cell (low expressing), and then levels are again elevated on terminally differentiated plasma cells. Figure 3A shows intensity of fluorescence of CD38 by various BL lines in relation to their TIMP-1 expression. The TIMP-1–negative cell lines (ST846, JD38, and Daudi) and low level TIMP-1 secreting line DW6 express CD38 in the range of 1 × 10⁶ to 2 × 10⁶ fluorescence (MESF) units, whereas cell lines expressing levels higher than 2 ng/mL TIMP-1 are either negative for CD38 or show one log decrease in fluorescence intensity. These results, in conjunction with the other phenotypic findings, are consistent with TIMP-1–negative BL lines representing earlier stages of B-cell differentiation than high TIMP-1–expressing cells. Although the highest TIMP-1–positive cell lines, AG876 and Jijyoe, show no sIgM (Fig 2) and, therefore, are more mature cells, these tumors express lower CD38 levels than those usually seen in plasmacytoid cells. Association of TIMP-1 and CD38 intensity of expression shows a moderate inverse correlation (r = −.70, P2 = .08). Therefore, these lines can be described as mature, activated B cells in a preplasma stage.
TIMP-1 levels are associated with intensity of CD40 and CD38 expression. (A) CD38 expression in BL lines shows a moderate inverse correlation (r = −.70, P2 = .08) with TIMP-1 production, BL lines expressing higher TIMP-1 levels (<2 ng/mL) are either CD38 negative or show significantly lower CD38(dim) intensity. The X-axis shows secreted TIMP-1 as determined by ELISA. The Y-axis shows CD38 expression as determined by flow cytometry and expressed in MESF as explained in the Materials and Methods. (B) A direct strong correlation (r = .88, P2= .02) between TIMP-1 production and intensity of CD40 is observed among BL cell lines. The X-axis shows secreted TIMP-1. The Y-axis shows CD40 fluorescence units expressed as MESF as explained in the Materials and Methods. Data represent duplicate MESF determinations of three experiments. ELISA detection of TIMP-1 levels were performed in triplicates for three experiments.
TIMP-1 levels are associated with intensity of CD40 and CD38 expression. (A) CD38 expression in BL lines shows a moderate inverse correlation (r = −.70, P2 = .08) with TIMP-1 production, BL lines expressing higher TIMP-1 levels (<2 ng/mL) are either CD38 negative or show significantly lower CD38(dim) intensity. The X-axis shows secreted TIMP-1 as determined by ELISA. The Y-axis shows CD38 expression as determined by flow cytometry and expressed in MESF as explained in the Materials and Methods. (B) A direct strong correlation (r = .88, P2= .02) between TIMP-1 production and intensity of CD40 is observed among BL cell lines. The X-axis shows secreted TIMP-1. The Y-axis shows CD40 fluorescence units expressed as MESF as explained in the Materials and Methods. Data represent duplicate MESF determinations of three experiments. ELISA detection of TIMP-1 levels were performed in triplicates for three experiments.
Apoptosis plays a central role during B-cell development. We have previously shown that expression of TIMP-1 in BL cell lines inhibits apoptosis induced by various treatments including fas activation, serum starvation, and gamma radiation.14 TIMP-1 upregulates BCL-XL and the inhibitor of NF-kB, IkB, but does not affect BCL-2.14 CD40 has been shown to regulate apoptosis in B cells. Ligation of CD40 with MoAb causes inhibition of cell death of both germinal center B cells and immature B cells.26 Also, cytokines such as interleukin-13 (IL-13) have been shown to affect cell survival through upregulation of CD40 in peripheral B cells.27 Expression of CD40 in BLs also shows a strong correlation (r = .88, P2 = .02) with TIMP-1 levels (Fig 3B). Unlike TIMP-1–negative cell lines, DW6, PA682, and Jijyoe express up to 2 logs higher fluorescence units of CD40. Furthermore, induction of TIMP-1 expression in JD38 cells upregulates CD40 expression (Fig 5B). These results indicate an association between TIMP-1 levels and CD40 expression intensity and provide an additional mechanism by which TIMP-1 may inhibit apoptosis.
Effects of TIMP-1 transfection on the phenotype of JD38 BL cells.
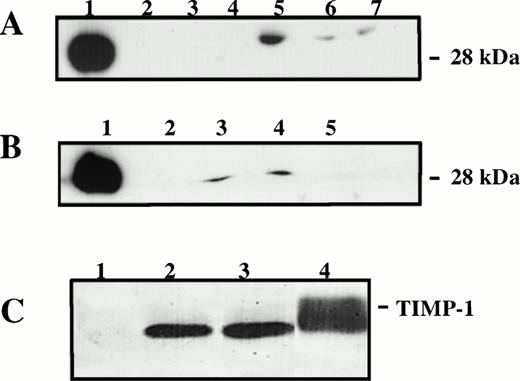
The pattern of gene expression we observe in TIMP-1+Burkitt’s cell lines has been previously reported as controlled by EBV proteins. For instance, CD23 is increased by nuclear antigen-2 (EBNA-2) and latent membrane protein-1 (LMP-1) in Burkitt’s cell lines with type-III latency.28 To determine whether TIMP-1 expression was also dependent on EBV state of latency, we analyzed the EBV–negative BL cell line JD38 transfected via retroviral infection with the human timp-1. TIMP-1 secretion by two independent TIMP-1–JD38 cell clones (20 and 24) was similar to the TIMP-1 expression by EBV-positive BL lines, whereas control LXSN-JD38 and parent JD38 cells are negative for TIMP-1 as analyzed by Western blot (Fig 4A and B). Functional MMP inhibitory activity of TIMP-1 secreted by transfected JD38 cells was confirmed by reverse zymography (Fig 4C).
Detection and functional analysis of TIMP-1. (A) Western blot analysis of unconcentrated TIMP-1 in conditioned media of various BL lines: lane 1, rTIMP-1 (300 ng) positive control; lane 2, JD38; lane 3, ST846; lane 4, Daudi; lane 5, AG876; lane 6, PA682; lane 7, DW6. JD38 cells were transfected with human timp-1 or emptyLXSN vector as described in the Materials and Methods. (B) Western blot analysis of TIMP-1 by TIMP-1–JD38 cell clones: lane 1, rTIMP-1 (300 ng) positive control; lane 2, parental JD38 cells; lane 3, TIMP-1–JD38 cell clone 20; lane 4, TIMP-1–JD38 cell clone 24; lane 5, LXSN-JD38 cells. (C) Reverse zymogram of TIMP-1 in the concentrated conditioned media of transfected JD38 cells: lane 1, LXSN-JD38 cells; lane 2, TIMP-1–JD38 cell clone 20; lane 3, TIMP-1–JD38 cell clone 24; lane 4, positive control HT1080 cells. Representative results of three independent analyses.
Detection and functional analysis of TIMP-1. (A) Western blot analysis of unconcentrated TIMP-1 in conditioned media of various BL lines: lane 1, rTIMP-1 (300 ng) positive control; lane 2, JD38; lane 3, ST846; lane 4, Daudi; lane 5, AG876; lane 6, PA682; lane 7, DW6. JD38 cells were transfected with human timp-1 or emptyLXSN vector as described in the Materials and Methods. (B) Western blot analysis of TIMP-1 by TIMP-1–JD38 cell clones: lane 1, rTIMP-1 (300 ng) positive control; lane 2, parental JD38 cells; lane 3, TIMP-1–JD38 cell clone 20; lane 4, TIMP-1–JD38 cell clone 24; lane 5, LXSN-JD38 cells. (C) Reverse zymogram of TIMP-1 in the concentrated conditioned media of transfected JD38 cells: lane 1, LXSN-JD38 cells; lane 2, TIMP-1–JD38 cell clone 20; lane 3, TIMP-1–JD38 cell clone 24; lane 4, positive control HT1080 cells. Representative results of three independent analyses.
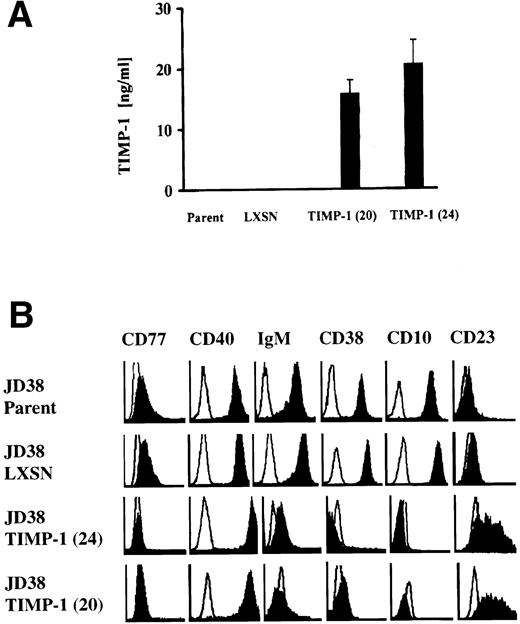
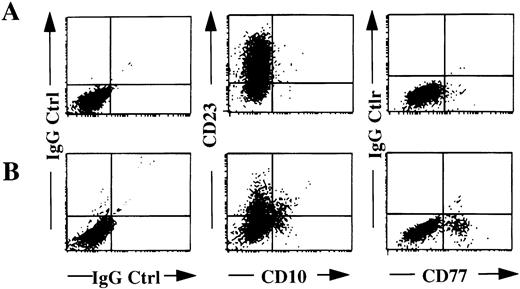
Figure 5A shows TIMP-1 production by TIMP-1–JD38 cell clones (20 and 24) but not by those cells carrying empty vector LXSN or parental JD38 cells. Flow cytometry analysis of these cell lines shows downregulation of CD10, CD38, CD77, and sIgM in the TIMP-1–JD38 cells. Upregulation of TIMP-1 expression also induces CD23 expression and increased CD40 as shown by an enhanced fluorescence intensity signal when compared with parental JD38 cells and LXSN-JD38 cells (Fig 5B). Incubation of TIMP-1–JD38 clone 24 with anti–TIMP-1 antibody inhibited the observed phenotypic changes. Unlike treatment with control antibody, treatment with anti–TIMP-1 antibody decreases the percentage of cells expressing CD23 while increasing the percentage of cells expressing CD10 and CD77 (Fig 6). These results indicate that the observed phenotypic changes in the TIMP-1–JD38 clone are secondary to the secreted TIMP-1 protein. This is consistent with our previous observations that secreted TIMP-1 inhibits apoptosis in BL cell lines.14
Effects of induced TIMP-1 in the phenotype of the EBV-negative JD38 cells. (A) TIMP-1 secretion shown by two independent TIMP-1–JD38 cell clones (20 and 24) compared with JD38 cells transfected with vector alone (LXSN) and JD38 parental cells (parent). The Y-axis shows secreted TIMP-1 as determined by ELISA of conditioned media. Data represent triplicate determinations ± SD of three experiments. (B) Flow cytometry analysis of TIMP-1–transfected JD38 cell clones 20 and 24 shows downregulation of follicular markers and upregulation of CD23 and CD40 compared with parental JD38 and LXSN-JD38 control cells. The X-axis shows log fluorescence intensity. The Y-axis shows the number of cells. Every plot shows staining with irrelevant isotype control antibodies (empty histograms). Data represent five independent flow cytometric determinations.
Effects of induced TIMP-1 in the phenotype of the EBV-negative JD38 cells. (A) TIMP-1 secretion shown by two independent TIMP-1–JD38 cell clones (20 and 24) compared with JD38 cells transfected with vector alone (LXSN) and JD38 parental cells (parent). The Y-axis shows secreted TIMP-1 as determined by ELISA of conditioned media. Data represent triplicate determinations ± SD of three experiments. (B) Flow cytometry analysis of TIMP-1–transfected JD38 cell clones 20 and 24 shows downregulation of follicular markers and upregulation of CD23 and CD40 compared with parental JD38 and LXSN-JD38 control cells. The X-axis shows log fluorescence intensity. The Y-axis shows the number of cells. Every plot shows staining with irrelevant isotype control antibodies (empty histograms). Data represent five independent flow cytometric determinations.
Flow cytometric analysis of TIMP-1–JD38 cells treated with TIMP-1 neutralizing antibody. TIMP-1–JD38 clone 24 cells were treated with an isotype control (A) or anti–TIMP-1 antibody (B) as explained in the Materials and Methods. Two-color flow cytometry shows anti–TIMP-1 treatment decreases percentage of CD23 positive cells from 89.7% (A) to 27.4% (B), and increases both the percentage of cells expressing CD10 from 0.55% (A) to 17.8% (B), and CD77 from 1.2% (A) to 13.6% (B), respectively. Isotype control plots (IgG Ctrl) are also shown. Data are representative results of three independent determinations.
Flow cytometric analysis of TIMP-1–JD38 cells treated with TIMP-1 neutralizing antibody. TIMP-1–JD38 clone 24 cells were treated with an isotype control (A) or anti–TIMP-1 antibody (B) as explained in the Materials and Methods. Two-color flow cytometry shows anti–TIMP-1 treatment decreases percentage of CD23 positive cells from 89.7% (A) to 27.4% (B), and increases both the percentage of cells expressing CD10 from 0.55% (A) to 17.8% (B), and CD77 from 1.2% (A) to 13.6% (B), respectively. Isotype control plots (IgG Ctrl) are also shown. Data are representative results of three independent determinations.
To further determine TIMP-1 effect on immunoglobulin production, parental and both TIMP-1–JD38 cell clones were analyzed for their intracellular as well as secreted IgM expression. Table 1 shows a significant decrease in the total IgM production by the two TIMP-1 overexpressing clones (20 and 24) compared with control JD38 cells. In contrast to parental and LXSN-JD38 cells, TIMP-1–JD38 cells downregulate cell surface immunoglobulin (Fig 5B). Thus, the downregulation in the surface IgM by TIMP-1–JD38 cell clones does not result in intracellular accumulation or augmented IgM secretion (Table 1). On the contrary, TIMP-1 upregulation resulted in a 50% reduction in the intracellular IgM levels and an 80% decrease of secreted IgM. These results clearly show that in the absence of EBV, induction of TIMP-1 in BLs is sufficient to modulate immunoglobulin expression.
IgM Production in JD38 Cell Lines
| Cells . | Intracellular IgM (lysate) . | Culture Supernatant IgM . |
|---|---|---|
| JD38 | 2,993.0 ± 105.2-150 | 1,249.7 ± 164.6 |
| LXSN | 2,654.5 ± 278.8 | 1,441.5 ± 77.6 |
| TIMP-1(20) | 1,107.1 ± 4.5 | 239.9 ± 20.3 |
| TIMP-1(24) | 968.4 ± 46.0 | 273.7 ± 21.5 |
| Cells . | Intracellular IgM (lysate) . | Culture Supernatant IgM . |
|---|---|---|
| JD38 | 2,993.0 ± 105.2-150 | 1,249.7 ± 164.6 |
| LXSN | 2,654.5 ± 278.8 | 1,441.5 ± 77.6 |
| TIMP-1(20) | 1,107.1 ± 4.5 | 239.9 ± 20.3 |
| TIMP-1(24) | 968.4 ± 46.0 | 273.7 ± 21.5 |
TIMP-1 over-expressing JD38 cell clones 20 and 24 as well as vector control and parental JD38 cells were analyzed by ELISA for intracellular (lysate column) and secreted IgM levels in culture supernatants. A significant decrease in total IgM production is shown by TIMP-1 cell clones compared with controls. TIMP-1–JD38 cells also show downregulation of cell surface IgM (Fig 5B). Data represent triplicate determinations ± SD of three experiments.
IgM concentration (ng/mL) ± SD.
The CD23, also known as low affinity receptor for IgE (FceRII), is a multifunctional 45-kD membrane glycoprotein that is cleaved into a biologically active 37-kD soluble fragment (sCD23).29 In activated B cells, upregulation of membrane CD23 is usually accompanied by CD23 secretion.30 TIMP-1 transfected JD38 cells were also tested by ELISA for their expression of secreted CD23 and compared with JD38 control cells as well as with TIMP-1+ and TIMP-1− BL lines. Table 2shows percentage of positive cells for membrane-CD23 as determined by flow cytometry and units/mL of secreted CD23 as assayed by ELISA. The TIMP-1–negative BL cell lines fail to express CD23 whereas the TIMP-1–positive lines show secretion and cell surface expression of CD23. Induction of TIMP-1 expression in JD38 cells resulted in upregulation of CD23 expression and secretion compared with parental and LXSN-JD38 controls. In addition, in all TIMP-1–positive BL cell lines studied, a higher level of CD23 secretion correlated inversely with surface CD23, indicating a higher CD23 cleavage by these.
Induction of CD23 by TIMP-1
| Cells . | Secreted CD23 (U/mL) . | Cell Surface CD23 (%) . |
|---|---|---|
| ST846 | neg | neg |
| JD38 | neg | neg |
| LXSN-JD38 | neg | neg |
| TIMP-1(24)-JD38 | 68.0 ± 2.8 | 91.8 |
| TIMP-1(20)-JD38 | 56.4 ± 4.3 | 89.3 |
| PA682 | 78.5 ± 2.0 | 65.6 |
| AG876 | 368.2 ± 34.3 | 57.4 |
| Jijyoe | 353.2 ± 21.0 | 46.8 |
| DW6 | 457.7 ± 28.5 | 38.3 |
DISCUSSION
The extracellular matrix has been shown to regulate various functions in hematolymphoid cells.30 Soluble components such as metalloproteinases and their inhibitors have been reported to be involved in proteolytic cleavage of receptors and ligands important for the survival and/or growth of hematolymphoid cells.31-33 Additionally, we have recently reported on the expression of matrix metalloproteinases and TIMPs by human normal and neoplastic lymphoid cells.12 In this study, TIMP-1 expression in B-cell lymphomas did not correlate with expression of matrix metalloproteinases. Furthermore, TIMP-1 was expressed by the centroblast-like BL cell lines but not by the follicular lymphoma lines studied. The observation of discordant TIMP-1 production in B cells and germinal-center–specific expression prompted us to investigate the role of TIMP-1 expression in BL cell lines. Previously, we have shown that TIMP-1 upregulation in Burkitt’s cell lines inhibits apoptosis and induces BCL-XL.14 In the present study, TIMP-1 was secreted by BL lines previously described as group II/III, which corresponds to advanced stage in EBV latency. Unlike the latter cell lines, BL cells retaining the original biopsy phenotype (CD10+, CD38+, CD77+, and sIg+) did not secrete TIMP-1. Additionally, TIMP-1 was associated with upregulated expression intensity of the survival antigen CD40 as well as expression and secretion of the activation marker CD23.
These results together with the observations of CD38 expression and IgM production suggest that higher TIMP-1 levels are associated with a mature, activated B cell phenotype in EBV+ BLs. However, the present report also shows that inducing TIMP-1 expression in the EBV-negative JD38 was sufficient to generate the same phenotypic changes as those seen in EBV+ lymphomas. That this is a TIMP-1–specific effect is indicated by the observed reversal of these phenotypic changes by TIMP-1 neutralizing antibody. These results suggest that TIMP-1 expression may be an important factor in the maturational or activation state of B cells. The TIMP-1 upregulated expression of the B-cell survival factor, CD40, may also contribute to the inhibition of apoptosis. Our data suggest that TIMP-1 expression could convey a poor prognosis in these high-grade lymphomas.
Considering that the germinal center is the origin of BL and that important steps of B-cell differentiation also occur in the germinal center, numerous studies have been directed to describe B-cell subpopulations in this region of the lymph node.34,35 CD77 expression is highly restricted to germinal-center B lymphocytes.36 This antigen is a neutral glycolipid expressed by a subset of B lymphocytes that readily enter programmed cell death.37,38 Apoptosis in these cells is prevented by CD40 engagement and by soluble CD23.39 Rescue from apoptosis by CD40 is mediated by a Bcl-2–independent mechanism.40 Based on these previous studies, a model of B-cell maturation has been proposed in which ligation of CD40 drives cells to lose CD77 and express membrane and soluble CD23, which in turns acts as an autocrine factor. Unlike these studies in which normal B lymphocytes were infected with an EBV strain, the present report shows that in the absence of EBV, upregulation of TIMP-1 induces the same changes, probably through similar mechanisms used by EBV. Thus, TIMP-1 may play a role in the normal development of the B cells in that it may provide an ECM signal to prevent programmed cell death. The phenotypic changes observed here normally occur in the germinal center during the interaction of B cells and T cells and in close proximity to the extracellular matrix in the germinal center stroma.39,41,42 Moreover, TIMP-1 expression has been observed in this stroma.43 The outcome of this interaction depends on the affinity of B-cell receptors for antigens, either resulting in death by apoptosis of B cells expressing low affinity receptors or survival of memory B cells. TIMP-1 by upregulating expression of CD40 and decreasing CD77 could be implicated in the survival of both differentiating normal and neoplastic B cells. This is supported by previous results from our laboratory showing that TIMP-1 expression in B cells confers resistant to apoptosis.14TIMP-1–mediated rescue of differentiated cells from apoptosis and restoration of normal development of the mammary gland has been previously reported in a transgenic huTIMP-1 mouse model.44The present study further supports a role for TIMP-1 as survival factor in differentiated B cells. Future studies are indicated to determine not only the prognostic value of TIMP-1 in B-cell neoplasias, but also its clinical significance in other malignancies.45 46Gaining insights into the mechanism of TIMP-1 action may show new therapeutic approaches to the treatment of lymphomas as well as solid tumors.
ACKNOWLEDGMENT
The authors thank Susan Wormsley (PharMingen Inc) for her valuable help determining IgM levels by ELISA, Dr Seth M. Steinberg (Head, Biostatistics and Data Management, National Cancer Institute) for statistical analysis, Chris Benton (Amersham) for providing the TIMP-1 ELISA kit. The authors also thank Drs William G. Stetler-Stevenson, Susan Hoegie, and Megan Lim for their valuable comments.
Address reprint requests to Maryalice Stetler-Stevenson, MD, PhD, Building 10, Rm 2A33, National Cancer Institute, National Institutes of Health, Bethesda, MD 20892.
The publication costs of this article were defrayed in part by page charge payment. This article must therefore be hereby marked "advertisement" is accordance with 18 U.S.C. section 1734 solely to indicate this fact.

This feature is available to Subscribers Only
Sign In or Create an Account Close Modal