Abstract
Recombinant human antithrombin (rhAT) produced in transgenic goat milk was purified to greater than 99%. The specific activity of the rhAT was identical to human plasma–derived AT (phAT) in an in vitro thrombin inhibition assay. However, rhAT had a fourfold higher affinity for heparin than phAT. The rhAT was analyzed and compared with phAT by reverse phase high-performance liquid chromatography, circular dichroism, fluorophore-assisted carbohydrate electrophoresis (FACE), amino acid sequence, and liquid chromatography/mass spectrography peptide mapping. Based on these analyses, rhAT was determined to be structurally identical to phAT except for differences in glycosylation. Oligomannose structures were found on the Asn 155 site of the transgenic protein, whereas only complex structures were observed on the plasma protein. RhAT contained a GalNAc for galactose substitution on some N-linked oligosaccharides, as well as a high degree of fucosylation. RhAT was less sialylated than phAT and contained both N-acetylneuraminic and N-glycolylneuraminic acid. We postulate that the increase in affinity for heparin found with rhAT resulted from the presence of oligomannose-type structures on the Asn 155 glycosylation site and differences in sialylation.
ANTITHROMBIN (AT) is a serine protease inhibitor that inhibits thrombin and factor Xa and, to a lesser extent, factors IXa, XIa, XIIa, tPA, urokinase, trypsin, plasmin, and kallikrein.1-4 Human AT, which is synthesized in the liver, is normally present in plasma at levels of 14 to 20 mg/dL.5,6 It has a molecular weight of approximately 58,000 Da and contains 432 amino acids, three disulfide bridges, and four carbohydrate side chains, which account for 15% of the total mass.7,8 Decreased levels of AT may be found in the serum of individuals who have either a hereditary deficiency of AT or an acquired deficiency, which can result from a number of pathological conditions.3
AT circulates in a form with low inhibitory activity.9,10The addition of heparin increases the inhibitory capacity of AT for thrombin by 1,000- to 5,000-fold or greater11-13 The AT binds to a well defined pentasaccharide on the heparin chain.13-16 The interaction between AT and thrombin then produces a tightly bound TAT (thrombin:antithrombin) complex17 that is essentially irreversible18and cleared quickly from circulation. Therapeutic use of heparin as an anticoagulant works through activation of endogenous AT. Patients whose AT levels are very low can become refractory to heparin therapy.19,20 Although circulating AT provides an anticoagulant effect with exogenously administered heparin, the heparan sulfate glycosaminoglycans on the endothelial layer lining the blood vessels may be the physiological site of action for circulating AT.21-24
We have previously shown that human proteins can be made in the milk of transgenic goats25,26 and that transgenic production of large quantities of recombinant protein is feasible.27 We have now produced recombinant human antithrombin (rhAT) in this production mode focusing on large-scale production. The current yearly production of plasma-derived AT is estimated at approximately 100 kg worldwide. Because AT is glycosylated7 and glycosylation is important for half-life and sometimes function28 of glycoproteins, a mammalian expression system was favored for recombinant production of this glycoprotein for therapeutic use. Assuming the highest level of recombinant protein production in mammalian cell culture is 100 mg/L of culture media and 50% recovery through the purification process, 2,000,000 L of culture media would be required to produce 100 kg of purified rhAT. At 2 g/L expression level in goat's milk, 100,000 L of milk from approximately 150 goats would be sufficient, assuming similar recovery. We present here the initial characterization of human AT transgenically produced in the milk of goats (rhAT) and its comparison with human plasma–derived AT (phAT).
MATERIALS AND METHODS
Production of the transgenic animal.
Transgenic goats expressing rhAT in their milk, under control of the β-casein promoter, were made essentially as described previously.27 The goats were developed in collaboration with Dr Karl Ebert of Tuft's University School of Veterinary Medicine (Boston, MA). The goat β-casein gene was cloned as previously described by Roberts et al.29 The coding region between exons 2 and 7 was removed and replaced with an Xho I restriction site.27,30 The human AT cDNA was derived from a modified pΒAT6 plasmid,31 which allows excision of the cDNA as an Xho I to Sal I fragment. The XhoI/Sal I human AT cDNA was ligated between exons 2 and 7 of the goat β-casein gene to form a goat β-casein–human AT cDNA transgene.
Embryos were collected, microinjected, and transferred to recipient female goats as previously described.27 A founder (F0) transgenic goat, a male was identified by analyzing genomic DNA from both a sample of ear tissue and blood by polymerase chain reaction (PCR)32 and by Southern blot analysis.27 This founder male was bred to nontransgenic females and produced transgenic female and male offspring. Transmission of the transgene was analyzed in genomic DNA isolated from blood by PCR and Southern blot analysis. The milk from two of the (F1) transgenic female goats was pooled and used in this study.
Purification.
Milk from AT transgenic goats was stored frozen at −40°C before use. For purification, milk was thawed, proprietary chemicals were added to enhance filtration, and the milk was clarified through a 500-kD tangential flow membrane filtration unit (AG Technology Corp, Needham, MA). The permeate from the filter was loaded directly onto a Heparin Hyper-D (Biosepra, Marlborough, MA) affinity chromatography column. The column was equilibrated in 40 mmol/L sodium phosphate, 135 mmol/L NaCl, pH 6.9, washed with 20 mmol/L sodium phosphate, 400 mmol/L NaCl, pH 7.0 and eluted with 20 mmol/L sodium phosphate, 2.5 mol/L NaCl, pH 7.0.
The heparin column eluate was concentrated and diafiltered against 20 mmol/L sodium phosphate, 65 mmol/L NaCl, pH 7.0 by ultrafiltration to reduce the conductivity. This solution was applied to an ANX Sepharose Fast Flow column (Pharmacia, Piscataway, NJ) equilibrated with 20 mmol/L sodium phosphate, 65 mmol/L NaCl, pH 7.0. The column was washed with equilibration buffer and eluted with 20 mmol/L sodium phosphate, 320 mmol/L NaCl, pH 6.7. The anion exchange eluate was adjusted to 1.26 mol/L citrate by addition of sodium citrate and loaded onto a Methyl HyperD column (Biosepra) equilibrated with 1.26 mol/L sodium citrate, 7.7 mmol/L citric acid, pH 7.0. The column was washed with equilibration buffer and eluted with 0.9 mol/L sodium citrate, 5.5 mmol/L citric acid, pH 7.0. The rhAT was then concentrated to 25 mg/mL by tangential flow ultrafiltration and formulated.
Analytical methods.
A commercially available (Thrombate; Miles Inc, Elkart, IN) preparation of human plasma AT was used for comparison with rhAT. The lyophilized product (Lot # 03B002 B) was reconstituted with 10 mL of high-performance liquid chromatography (HPLC) grade water and aliquots (53.3 IU/mL) frozen at −80°C. Goat plasma AT was isolated from goat plasma by an adaptation of the methods shown for the recombinant AT.
The expression level of the AT in the milk was determined by using a two-stage colorimetric endpoint assay in a microplate format, which measures the degree of thrombin inhibition. This assay is a modified AT/heparin cofactor assay.33 34 In this method, AT was added to an excess of porcine heparin (Grade I-A #H3393; Sigma, St Louis, MO) followed by the addition of a constant amount of thrombin. After a period of incubation, thrombin activity was measured by the addition of a thrombin-specific chromogenic substrate (S2238, Chromogenics, Mölndal, Sweden).
Inhibitory activity of purified rhAT and phAT was measured with respect to thrombin in a similar manner by using the S2238 substrate and an excess of heparin (55.5 nmol/L). The concentration of thrombin (Calbiochem #605190, La Jolla, CA) was 243 mU/mL for this assay, with a substrate concentration of 337 μmol/L. Inhibitory activity with respect to factor Xa was measured in an equivalent assay, but with the substitution of factor Xa (Calbiochem #233526; 6.46 mU/mL in the assay) for thrombin, and using the S2765 substrate from Kabi. In both assays the enzyme was added to a mixture of AT and heparin for a 10-minute preincubation at 37°C before the initiation of the reaction by addition of substrate. Reaction volumes were 0.6 mL, and all reactions were stopped after a period of 10 minutes by the addition of glacial acetic acid. The reaction rate was shown to be linear for this 10-minute period. Heparin cofactor activation of thrombin inhibition was measured using multiple subsaturating concentrations of heparin in the assays with AT at 3 nmol/L.
Total protein was determined by using a modified Bradford protein assay (Pierce, Rockford, IL) with bovine serum albumin as standard. The concentration of the purified protein was confirmed by amino acid analysis as previously described.35 Recovery of rhAT after each purification step was determined by a rapid reverse-phase HPLC (RP-HPLC) chromatography method performed by using a Hewlett Packard (Wilmington, DE) 1100 series HPLC equipped with detection at 214 nm. Samples were analyzed on a POROS R2/H column (2.1 × 30 mm; Perseptive Biosystems, Framingham, MA) equilibrated with 0.1% trifluoro acetic acid (TFA) in HPLC grade water at a flow rate of 2.0 mL/min. rhAT was eluted from the column by using 0.08% TFA in acetonitrile. Test sample concentrations were determined by rhAT peak area comparisons to a standard quantitated by amino acid analysis.
Polyacrylamide gel electrophoresis was performed according to the Laemmli method36 by using gradient gels (10% to 20%) (Integrated Separations Systems, Natick, MA). Gels were stained with silver by the method of Morrissey.37 Purity was determined by scanning the gels with an LKB Model 2202 laser densitometer (LKB Inst, Uppsala, Sweden). BIORAD molecular weight standards were used for molecular weight estimation. Western blot analysis was performed by using a modification of the method of Burnette.38 The labeling antibody was affinity purified sheep anti-hAT-HRP (SeroTec, Oxford, UK). Development was with the enhanced chemiluminescence (ECL) system (Amersham, Princeton, NJ).
Protein purity was assessed by RP-HPLC on a Hewlett Packard 1090 HPLC equipped with photodiode array detection. Samples were diluted to 80 μg/mL in 0.1% TFA and 250 μL aliquots analyzed on a Vydac C4 column (2.1 × 250 mm) equilibrated in 0.1% TFA. The column was developed with a complex gradient at a flow rate of 0.3 mL/min. Solvent A was 0.1% TFA and solvent B was 0.08% TFA in acetonitrile; 0 to 2 minutes = 0% solvent B; 2 to 22 minutes = 0% to 40% solvent B; 22 to 27 minutes = 40% to 45% solvent B; 27 to 34.5 minutes = 45% to 60% solvent B; 34.5 to 40 minutes = 60% to 90% solvent B; and 40 to 42 minutes = 90% solvent B. Peaks were integrated at 215 nm and a purity value was calculated.
For peptide mapping, samples of AT were reduced and pyridylethylated and the modified protein was desalted by RP-HPLC on a C4 column. Digestions of both the native and reduced/pyridylethylated protein were performed with Lys-C protease at pH 8.5 at an enzyme:substrate ratio of 1:50 for 18 hours at 37°C. Resultant digests were quenched and peptide mapping was performed on a Vydac C8 reverse phase column (2.1 × 150 mm). Peptides were eluted in an acetonitrile/TFA gradient.
For LC/MS analysis, eluant from the chromatography column was introduced directly into the electrospray interface of the mass spectrometer and spectra acquired over m/z range of 200 to 4,000 at a 3-second scan rate. Electrospray mass spectrometry was performed on a Finnigan TSQ 700 triple quadrupole mass spectrometer equipped with a Finnigan Electrospray source. Chromatography was performed on a Michrom UMA HPLC at a flow rate of 50 μL/min.
Amino terminal sequence analysis was performed by using an Applied Biosystems (Foster City, CA) 477 sequencer. Phenylthiohydantoin (PTH) amino acid analysis was performed with an on-line Applied Biosystems 120A PTH analyzer equipped with an Applied Biosystems 2.1 × 220-mm PTH C-18 column.
Monosaccharide analysis was performed according to the method of Hardy et al39 by using a Dionex HPLC (Sunnyvale, CA) equipped with a pulsed amperometric detector. Sialic acid determination was performed by using the thiobarbituric acid method as modified by Powell and Hart40 by using a Hewlett Packard 1090 HPLC. Monosaccharide standards were purchased from Phanstiel Laboratories Inc (Waukegan, IL).
Oligosaccharide content was examined by using the fluorophore-assisted carbohydrate electrophoresis (FACE) system (Glyko, Novato, CA) and LC/MS analysis of glycopeptides. FACE was performed on oligosaccharides released from glycoproteins by using N-Glycanase (Genzyme, Framingham, MA). Proteins were denatured with 0.15% sodium dodecyl sulfate (SDS), 65mmol/L β-mercaptoethanol at 100°C for 5 minutes. SDS binding was displaced with 1.2% Nonidet-40 after cooling on ice for 5 minutes. N-Glycanase was added at 150 U/mg AT and samples incubated overnight at 37°C. The released oligosaccharides were labeled overnight at 37°C with the fluorescent label 8, aminonaphthalene-1,3,6-trisulfonate (ANTS) by using reagents and protocol included in the Oligosaccharide Labelling Reagent Pack (Glyko). Labeled samples were loaded onto precast oligosaccharide profiling gels from Glyko. Gels were run at 15 mA/gel for 85 minutes. Gels were imaged by using an SE1000 Imager (Glyko) and quantitated by using FACE Analytical Software (Glyko).
Heparin binding of purified AT was assessed by fractionation on a TSK-Gel Heparin 5PW affinity column (5 mm internal diameter [ID] × 50 mm; TosoHaas, Montgomeryville, PA) on a Hewlett Packard 1050 HPLC. Samples were applied to the column equilibrated in 50 mmol/L Tris-Cl, 10 mmol/L sodium citrate, pH 7.4 at a flow rate of 0.5 mL/min. The column was washed for 10 minutes with equilibration buffer and eluted with a linear gradient of 0 to 3 mol/L NaCl in equilibration buffer over 20 minutes. Protein was monitored by absorbance at 215 nm. Absorbance of a blank run was subtracted to give the final chromatograms.
Heparin binding of AT was also assessed by measuring the change in fluorescence of Trp according to Fan et al.41 Samples of AT were diluted to 20 nmol/L in 20 mmol/L sodium phosphate, 100 mmol/L NaCl, 100 μmol/L EDTA, pH 7.4 containing 0.1% PEG-4000 (Fluka, Buchs, Switzerland). Fluorescence was measured on a Spex FluoroMax fluorometer (Spex Industries, Edison, NJ) by using an excitation wavelength of 280 nmol/L (5-nm bandwidth) and an emission wavelength of 340 nmol/L (10-nm bandwidth). Heparin (Sigma Grade I-A #H3393; porcine) was added sequentially in 1-μL aliquots to up to 16 μL total added volume.
Circular dichroism spectroscopy was performed on a Jasco J-720 spectropolarimeter (Jasco Inc, Easton, MD). The instrument was calibrated with (+)-10-camphorsulfonic acid. Measurements were made at room temperature by using cylindrical cuvettes with path lengths 0.01 cm (far ultraviolet, 170 to 260 nm) and 1.0 cm (near ultraviolet, 250 to 360 nm). Data analysis was performed on the average of at least 45 scans. The average spectrum was smoothed by Fourier transformation and corrected for the baseline. The sample was in 133 mmol/L glycine, 135 mmol/L NaCl, 10 mmol/L sodium citrate buffer at pH 7.0.
RESULTS
Expression of rhAT.
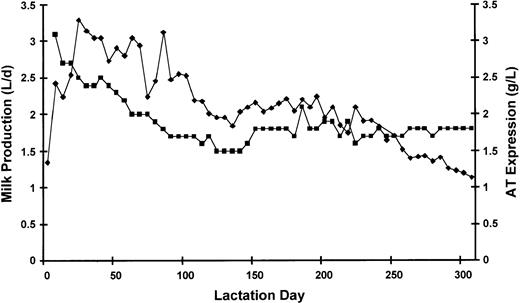
A graphic presentation of rhAT expression in transgenic goat milk during a full lactation cycle is shown in Fig 1. The rhAT expression level remained relatively constant throughout the full lactation cycle, which lasted over 300 days with a fairly constant yield throughout the lactation. The purification process (see Materials and Methods) provided a cumulative yield of greater than 50% (Table 1) with high step recoveries at all stages during the process.
Milk production and rhAT expression level of a typical lactation cycle from one female goat. (⧫), milk volume in L/d; (▪), rhAT level in g/d.
Milk production and rhAT expression level of a typical lactation cycle from one female goat. (⧫), milk volume in L/d; (▪), rhAT level in g/d.
Compilation of the Percent Recovery for Each Step of Purification and Overall for the Process
| Step . | Total ATIII (g) . | Step Recovery . | Overall Yield . |
|---|---|---|---|
| Diluted milk | 115.0 | — | 100% |
| Heparin eluate | 87.3 | 76% | 76% |
| Ultrafiltration | 86.0 | 98% | 75% |
| DEAE eluate | 84.7 | 98% | 74% |
| Methyl eluate | 67.3 | 80% | 59% |
| UF/Formulation | 61.0 | 91% | 53% |
Data represent the average of 3 runs at this scale.
Purity.
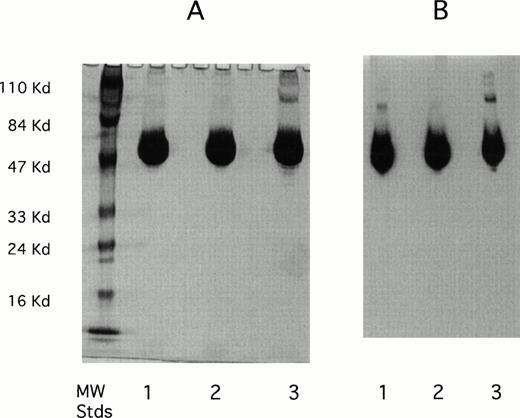
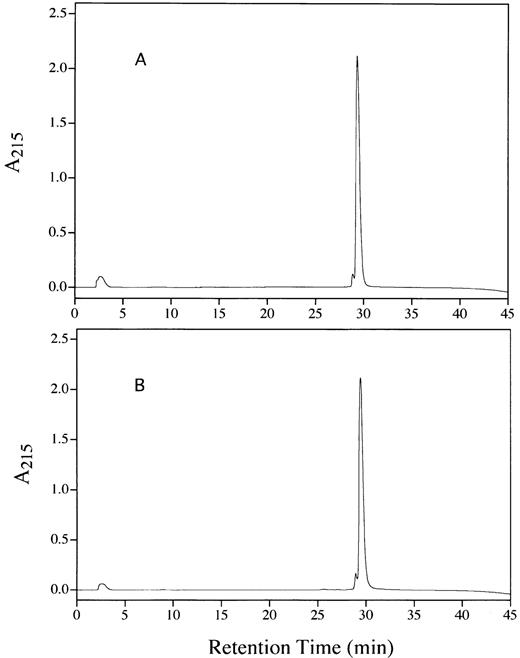
The purity of the rhAT was greater than 99% and was at least equivalent to that observed for the commercial phAT as judged by sodium dodecyl sulfate-polyacrylamide gel electrophoresis (SDS-PAGE; Fig 2A). No protein bands other than AT (determined by Western blot; Fig 2B) were evident with silver staining at a high protein load (Fig 2A). The higher molecular weight bands in all cases appeared to be multimers of AT with the major oligomeric form in the phAT having the apparent molecular weight of a dimer. Based on this gel, the rhAT has a lower level of oligomerization than the phAT. Purity as assessed by RP-HPLC was determined to be greater than 99% (Fig 3). The chromatographic profile and retention time of the rhAT was similar to the plasma-derived protein. Analysis of the leading shoulder areas (seen in both samples) by peptide mapping coupled with mass spectrometry, identified these peaks as AT molecules that are partially oxidized (data not shown).
SDS-PAGE gel (A) and Western blot (B) of rhAT (lane 1), rhAT assay standard (lane 2), and phAT (lane 3). Molecular weight markers are shown on the silver stained gel (A). Twenty micrograms of protein were applied to each sample lane (lanes 1, 2, and 3). The SDS-PAGE gel (A) was developed with the Morrissey silver stain, and the Western blot (B) was developed with a sheep antihuman AT-HRP antibody (SeroTec) and color development was the ECL system (Amersham).
SDS-PAGE gel (A) and Western blot (B) of rhAT (lane 1), rhAT assay standard (lane 2), and phAT (lane 3). Molecular weight markers are shown on the silver stained gel (A). Twenty micrograms of protein were applied to each sample lane (lanes 1, 2, and 3). The SDS-PAGE gel (A) was developed with the Morrissey silver stain, and the Western blot (B) was developed with a sheep antihuman AT-HRP antibody (SeroTec) and color development was the ECL system (Amersham).
RP-HPLC chromatograms showing the purity of rhAT (A) and phAT (B). Chromatography was performed with 20 μg of protein applied to a Vydac C4 column (2.1 × 250 mm) with a series of linear gradients (see Materials and Methods). Detection was by absorbance at 215 nm.
RP-HPLC chromatograms showing the purity of rhAT (A) and phAT (B). Chromatography was performed with 20 μg of protein applied to a Vydac C4 column (2.1 × 250 mm) with a series of linear gradients (see Materials and Methods). Detection was by absorbance at 215 nm.
Assessment of activity and heparin binding.
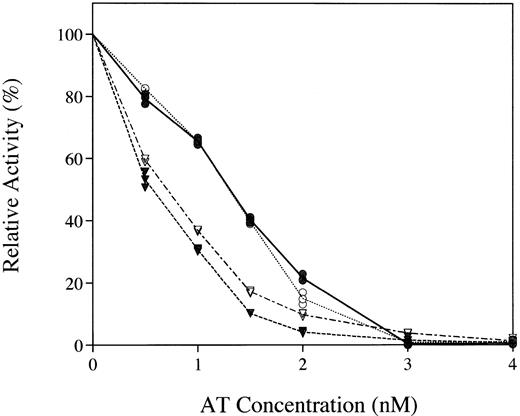
The transgenically produced rhAT was found to have a specific activity of 6 IU/mg protein, equivalent to that of the phAT, by using an assay that measured inhibition of thrombin in an excess of heparin. The inhibitory capacity of rhAT and phAT in both thrombin and factor Xa activity assays was examined (Fig 4). Equivalent inhibition was observed with both the major known targets of AT.
Comparative inhibition of thrombin (circles) and factor Xa (inverted triangles) by rhAT (• and ▾) and phAT (○ and ∇) with a saturating concentration of heparin.
Comparative inhibition of thrombin (circles) and factor Xa (inverted triangles) by rhAT (• and ▾) and phAT (○ and ∇) with a saturating concentration of heparin.
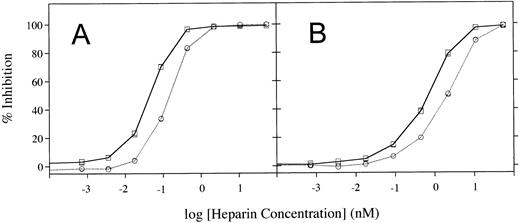
Heparin cofactor activation of rhAT was examined by varying the amount of heparin used in inhibition assays of either thrombin or factor Xa (Fig5). These assays showed that rhAT requires a lower concentration of heparin than phAT for inhibition of both enzymes. The heparin concentrations required for half-maximal inhibition of thrombin by rhAT and phAT were 0.045 nmol/L and 0.151 nmol/L, respectively. For inhibition of factor Xa, these values were 0.71 nmol/L and 2.22 nmol/L for rhAT and phAT. In both cases, rhAT required a threefold to fourfold lower concentration of heparin for activation of the inhibitor.
Heparin cofactor activation assays measured by using increasing concentrations of heparin. (A) Activation of thrombin inhibition. (B) Activation of factor Xa inhibition. (□), rhAT; (○), phAT.
Heparin cofactor activation assays measured by using increasing concentrations of heparin. (A) Activation of thrombin inhibition. (B) Activation of factor Xa inhibition. (□), rhAT; (○), phAT.
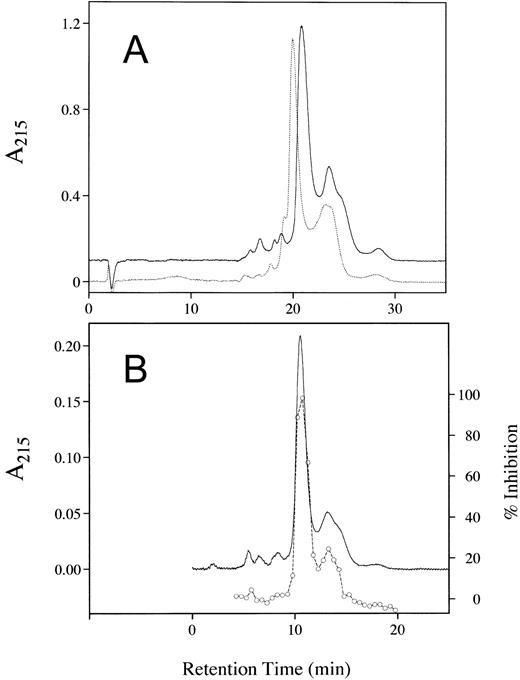
Analysis of the binding characteristics of each AT was also examined with a solid-phase heparin affinity column (Fig 6). The complexity observed in the elution profile (Fig 6A) was caused by both the heterogeneous population of heparin used to make the column and the presence of the higher affinity β-isoform of AT, which lacks glycosylation at Asn 135. The α isomer eluted as two peaks, at 21 and approximately 25 minutes for rhAT and 20 and approximately 24 minutes for phAT. The β-AT form also eluted as two peaks at 24 and 28.5 minutes for rhAT and 23 and 28 minutes for phAT. Both the major and minor peaks associated with rhAT required a higher salt concentration for elution compared with the coordinate peaks of phAT indicating a higher heparin affinity for all forms of the transgenically produced AT. Because the first β-isoform peak coeluted with the second α-isoform peak, quantitation of the forms from this method was not possible. Examination of the thrombin inhibitory activity across the elution pattern of the rhAT (Fig 6B) indicated that all of the fractions detected as having protein also had activity.
Chromatography of rhAT and phAT on a TSK-Gel Heparin-5PW affinity column. Sample load was 175 μg (A) and 25 μg (B). AT was eluted with a 0- to 3-mol/L NaCl gradient in equilibration buffer with detection at 215 nm. For (A), the dotted line represents phAT and the solid line represents rhAT. For (B), the solid line represents rhAT protein and the circles represent thrombin inhibition activity. The difference in retention times between panels resulted from a 10-minute wash preceding the elution gradient in (A) that was not used in (B).
Chromatography of rhAT and phAT on a TSK-Gel Heparin-5PW affinity column. Sample load was 175 μg (A) and 25 μg (B). AT was eluted with a 0- to 3-mol/L NaCl gradient in equilibration buffer with detection at 215 nm. For (A), the dotted line represents phAT and the solid line represents rhAT. For (B), the solid line represents rhAT protein and the circles represent thrombin inhibition activity. The difference in retention times between panels resulted from a 10-minute wash preceding the elution gradient in (A) that was not used in (B).
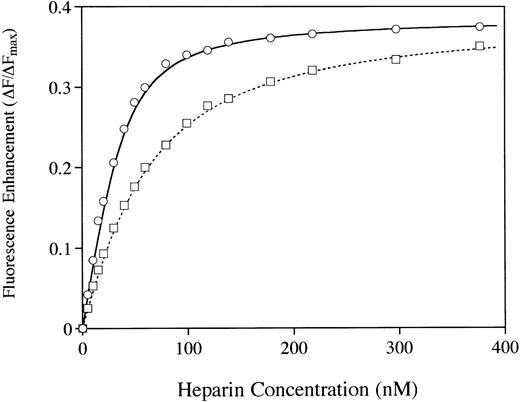
Examination of heparin binding affinity by using the Trp fluorescence assay41 provided additional evidence that the two molecules differ in their affinity for heparin (Fig7). A fourfold higher affinity for heparin was observed with the rhAT when compared with the phAT. The calculated binding constants (Kd values) were 10.3 nmol/L and 41.2 nmol/L for rhAT and phAT, respectively. However, the Fmax (fluorescence at saturating heparin) values were indistinguishable for rhAT and phAT. Dissociation constants were calculated by using nonlinear least squares analysis as described by Fan et al41 assuming a mean molecular weight of 13,500 D for heparin.42
The binding of AT to heparin was analyzed by protein fluorescence enhancement.41 rhAT (○) and phAT (□) were diluted to 20 nmol/L in 20 mmol/L sodium phosphate, 100 mmol/L NaCl, 100 μmol/L EDTA, 0.1% PEG, and pH 7.4. Heparin was added in 1-μL aliquots, and fluorescence was measured with excitation at 280 nm and emission at 340 nm.
The binding of AT to heparin was analyzed by protein fluorescence enhancement.41 rhAT (○) and phAT (□) were diluted to 20 nmol/L in 20 mmol/L sodium phosphate, 100 mmol/L NaCl, 100 μmol/L EDTA, 0.1% PEG, and pH 7.4. Heparin was added in 1-μL aliquots, and fluorescence was measured with excitation at 280 nm and emission at 340 nm.
Structural characterization.
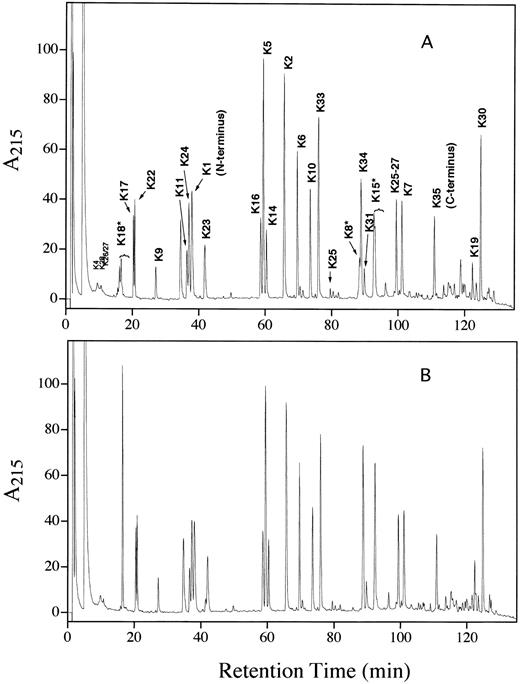
A detailed biochemical characterization was performed in an effort to determine the basis for the increased heparin affinity in the transgenic protein. N-terminal sequence analysis confirmed that the rhAT had the correct N-terminal sequence. A minor sequence lacking the first two residues and beginning with serine was observed in both the rhAT and phAT, with a slightly lower percentage (8% v 13%) of this form present in the rhAT. The reduced and pyridylethylated peptide map of rhAT was essentially identical to that of phAT (Fig 8). The only differences observed were in the regions of the three glycopeptides (K8, K15, and K18). The peptide containing the Asn 135 glycosylation site (K12) is a tripeptide and was not retained on the chromatographic column used. The differences observed in the glycopeptides were caused by the increased glycosylation heterogeneity present in the transgenic protein.
Lys C peptide maps of reduced and alkylated rhAT (A) and phAT (B). The K# designation corresponds to the peptide produced by Lys C digestion as shown in Table 2.
Lys C peptide maps of reduced and alkylated rhAT (A) and phAT (B). The K# designation corresponds to the peptide produced by Lys C digestion as shown in Table 2.
The primary sequence of rhAT was confirmed by on-line LC/MS analysis of an endoproteinase Lys-C digest. By using this procedure, 27 of the 35 theoretical Lys-C peptides were identified (Table 2). Seven of the eight unidentified peptides had masses of less than 375 D, which would result in a doubly charged ion below the 200 mass/charge ratio (m/z) lower mass range used in these studies. The eighth peptide (K26) was observed as an incomplete cleavage product because of the presence of a proline C-terminal to the lysine. The only post-translational modifications detected were at the known N-glycosylation sites with no evidence of any other modifications on either the rhAT or the phAT.
Lys C Peptide Number, the Residues in Each Peptide With Each Theoretical Mass, and the Masses Observed for rhAT and phAT by LC/MS
| Peptide . | Residues . | Theoretical . | Observed Mass . | |
|---|---|---|---|---|
| rhAT . | phAT . | |||
| K1 | 1-11 | 1,232.44 | 1,232.3 | 1,232.2 |
| K2 | 12-28 | 2,152.61 | 2,152.5 | 2,152.6 |
| K3 | 29-29 | 146.20 | — | — |
| K4 | 30-39 | 1,093.08 | 1,093.2 | 1,093.0 |
| K5 | 40-53 | 1,698.95 | 1,698.9 | 1,698.9 |
| K6 | 54-70 | 1,957.14 | 1,957.2 | 1,957.2 |
| K7 | 71-91 | 2,299.60 | 2,299.7 | 2,299.7 |
| K8* | 92-107 | 3,976.18 | 3,976.6 | 4,121.9 |
| K9 | 108-114 | 838.92 | 838.7 | 838.7 |
| K10 | 115-125 | 1,340.51 | 1,340.4 | 1,340.5 |
| K11 | 126-133 | 1,170.46 | 1,170.2 | 1,170.3 |
| K12* | 134-136 | 331.38 | — | — |
| K13 | 137-139 | 320.35 | — | — |
| K14 | 140-150 | 1,219.42 | 1,219.2 | 1,219.2 |
| K15* | 151-169 | 3,557.63 | 3,558.2 | 4,385.3 |
| K16 | 170-176 | 860.03 | 859.8 | 859.7 |
| K17 | 177-188 | 1,330.43 | 1,330.3 | 1,330.3 |
| K18* | 189-193 | 2,693.63 | 2,693.6 | 2,839.2 |
| K19 | 194-222 | 3,248.78 | 3,249.1 | 3,249.9 |
| K20 | 223-226 | 502.62 | 502.3 | 502.3 |
| K21 | 227-228 | 233.28 | — | — |
| K22 | 229-236 | 978.08 | 978.0 | 977.9 |
| K23 | 237-241 | 698.83 | 698.7 | 698.4 |
| K24 | 242-257 | 1,799.00 | 1,799.0 | 1,798.9 |
| K25 | 258-275 | 2,209.59 | 2,209.4 | 2,209.5 |
| K26 | 276-287 | 1,314.62 | — | — |
| K27 | 288-290 | 372.43 | — | — |
| K28 | 291-294 | 417.51 | 417.2 | 417.1 |
| K29 | 295-297 | 374.45 | — | — |
| K30 | 298-332 | 4,260.98 | 4,261.5 | 4,261.0 |
| K31 | 333-348 | 1,849.10 | 1,849.2 | 1,848.7 |
| K32 | 349-350 | 233.28 | — | — |
| K33 | 351-370 | 2,202.46 | 2,202.4 | 2,202.5 |
| K34 | 371-403 | 3,448.85 | 3,448.8 | 3,449.1 |
| K35 | 404-432 | 3,421.20 | 3,420.9 | 3,421.3 |
*Glycopeptide.
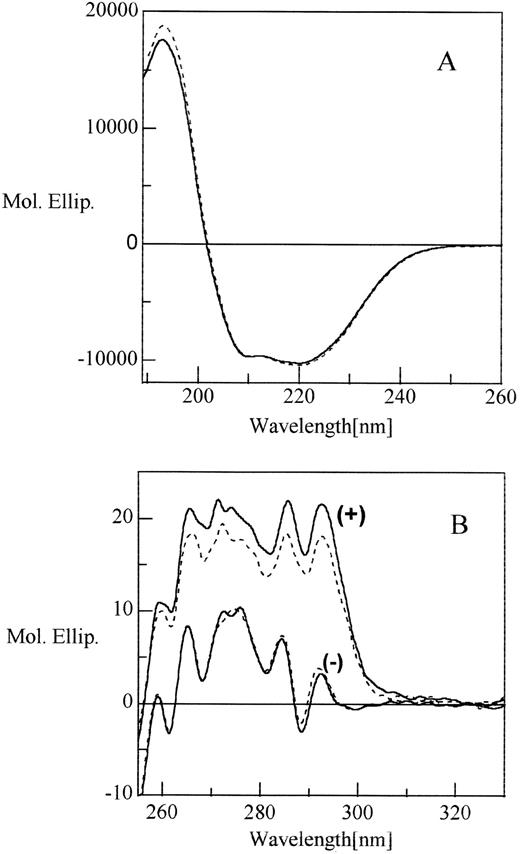
Peptide mapping under nonreducing conditions (data not shown) confirmed that the three disulfide linkages occurred between cysteines 8 to 128, 21 to 95, and 247 to 430 as reported previously.43 The conformation of rhAT was further analyzed by CD spectroscopy (Fig 9). The AT far ultraviolet circular dichroism (CD) spectrum was similar for both proteins and was characterized by two negative bands at 220 to 222 nm and 210 nm and an intense positive band around 193 nm. The two negative minima and a positive maximum were indicative of the presence of both α-helix and β sheet in the protein, which was consistent with the crystal structure data of phAT.44 The near ultraviolet spectrum of both proteins was also similar with a number of positive and negative peaks between 260 nm and 300 nm (Fig9B). These data were in excellent agreement with the previously published spectra of AT derived from human and bovine plasma.45
Circular dichroism spectra of rhAT (solid line) and phAT (broken line) in the far ultraviolet (A) and near ultraviolet (B) with (+) and without (−) heparin. The molar ratio between protein and heparin was 1:7. Molar ellipticity is expressed in deg × cm2 × dmol −1.
Circular dichroism spectra of rhAT (solid line) and phAT (broken line) in the far ultraviolet (A) and near ultraviolet (B) with (+) and without (−) heparin. The molar ratio between protein and heparin was 1:7. Molar ellipticity is expressed in deg × cm2 × dmol −1.
We also monitored changes in the CD of AT in the presence of a saturating level of heparin (Fig 9B). In the far ultraviolet spectrum, the addition of heparin produced little change (data not shown), which suggested that secondary structures were not altered. However, the near ultraviolet spectrum showed a dramatic increase in band intensity across the whole region when heparin was added. This marked enhancement in chiral absorption can be attributed mainly to the perturbation of buried and exposed tryptophan residues. This CD result also indicated that for the same protein concentration, the increase in CD intensity was higher for rhAT than for phAT, which again indicated that the heparin affinity of the rhAT was higher than that of phAT.
Carbohydrate analyses.
The oligosaccharide structures at all four N-linked glycosylation sites on phAT have been reported to be similar and to contain primarily biantennary disialylated complex oligosaccharides without fucose.7 The monosaccharide composition obtained for phAT (Table 3) was consistent with such a glycosylation pattern. The monosaccharide composition obtained for rhAT indicated that the glycosylation was significantly different from that of phAT. The key differences were the presence of fucose and GalNAc, a higher level of mannose, a lower level of galactose and sialic acid. No evidence of O-linked glycosylation was observed during LC/MS analysis of the rhAT peptide map, which suggested that the GalNAc is present on N-linked oligosaccharides. The increased level of mannose also suggested the presence of oligomannose structures on the recombinant protein.
Monosaccharide Compositions of the Sugars Found on rhAT and phAT
| . | Moles Sugar/Mole Protein . | |||||
|---|---|---|---|---|---|---|
| Fucose . | GalNAc . | GlcNAc . | Galactose . | Mannose . | Sialic Acid . | |
| rhAT | 2.61 ± 0.15 | 1.53 ± 0.03 | 10.78 ± 0.17 | 4.40 ± 0.03 | 14.71 ± 0.25 | 2.84 ± 0.12 |
| phAT | 0.00 | 0.00 | 13.08 ± 0.01 | 7.72 ± 0.01 | 11.03 ± 0.01 | 5.38 ± 0.28 |
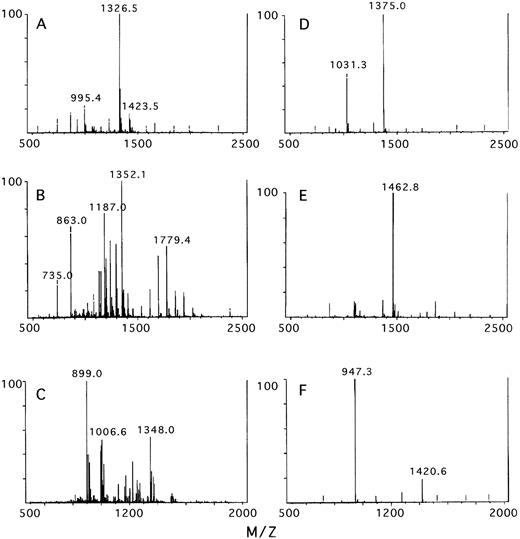
The glycosylation heterogeneity of phAT and rhAT was further analyzed by LC/MS analysis of the individual glycopeptides (Fig 10). By using the LC/MS technique, the monosaccharide composition of the oligosaccharide structures present at each site were deduced by subtracting the amino acid mass from the total mass of the glycopeptide. The predominant oligosaccharide observed at each site is presented in Table 4. The glycopeptide containing the Asn 135 site of both phAT and rhAT could not be analyzed in this manner because of its poor retention on the chromatography column. Other LC/MS data indicated that the Asn 135 site of rhAT was greater than 80% glycosylated with the complex oligosaccharide types noted below (data not shown). In humans, AT lacking glycosylation at the Asn 135 site (the β-isoform) was measured at 5% to 15% of the total AT found in plasma.46 47
The mass spectrum obtained for the glycopeptides containing Asn 96, Asn 155, and Asn 192 for rhAT (A, B, and C) and phAT (D, E, and F), respectively.
The mass spectrum obtained for the glycopeptides containing Asn 96, Asn 155, and Asn 192 for rhAT (A, B, and C) and phAT (D, E, and F), respectively.
Major Oligosaccharide Structures of Glycosylation Sites Deduced From LC/MS Data of Glycopeptides
| Site . | Peptide Mass . | Observed Mass . | Observed CHO Mass . | Theoretical CHO Mass . | Composition . |
|---|---|---|---|---|---|
| rhAT | |||||
| Asn 96 | 1,915.3 | 3,976.5 | 2,061.2 | 2,060.9 | HexNAc4,Hex5, Fuc1,NANA1 |
| Asn 155 | 2,178.4 | 3,558.0 | 1,379.6 | 1,379.2 | HexNAc2,Hex6 |
| Asn 192 | 632.7 | 2,694.0 | 2,061.3 | 2,060.9 | HexNAc4,Hex5, Fuc1,NANA1 |
| phAT | |||||
| Asn 96 | 1,915.3 | 4,122.0 | 2,206.7 | 2,206.0 | HexNAc4,Hex5, NANA2 |
| Asn 155 | 2,178.4 | 4,385.4 | 2,207.0 | 2,206.0 | HexNAc4,Hex5, NANA2 |
| Asn 192 | 632.7 | 2,838.9 | 2,206.2 | 2,206.0 | HexNAc4,Hex5, NANA2 |
For all three phAT glycopeptides analyzed, the major oligosaccharide species had a mass of 2,206 to 2,207 D. This mass corresponded to a monosaccharide composition of HexNAc4, Hex5,NANA2, which was consistent with a biantennary disialylated structure. This assessment was in agreement with the published data of Franzen et al.7
In contrast, the mass spectra obtained for the rhAT glycopeptides are more complex. The mass spectrum obtained for the glycopeptide containing the Asn 96 site (K8) of rhAT (Fig 10A) had a major peak at 1,326.5 m/z corresponding to the 3+ charge state of the glycopeptide with a fucosylated biantennary monosialylated oligosaccharide structure. The peak at 995.4 m/z corresponded to the 4+ charge state of the same species. The peak at 1,423.5 m/z corresponded to the fucosylated biantennary disialylated oligosaccharide. Additional minor peaks were observed surrounding the major peaks, which could be accounted for by monosaccharide substitutions. The substitution of an N-glycolyl neuraminic acid (NGNA) for a N-acetyl neuraminic acid (NANA) resulted in a 16-D mass increase, and the substitution of a HexNAc (GalNAc) for Hex (Gal) resulted in a 42-D mass increase. The presence of N-glycolyl neuraminic acid was confirmed by chromatographic analysis. The GalNAc/Gal substitutions accounted for the lower level of galactose and presence of GalNAc in the monosaccharide compositional analysis of rhAT. The spectrum for the phAT Asn 96 glycopeptide (Fig10D) was less complex with the two major peaks at 1,375 and 1,031.3 m/z corresponding to the 3+ and 4+ charge states of the glycopeptide containing a biantennary disialylated structure.
The mass spectrum of rhAT Asn 155 containing glycopeptide (K15) (Fig10B), was more heterogeneous than that of the Asn 96 site. This spectrum was dominated by two series of peaks, one centered around the m/z of 1,779.4 (2+ charge) and one around m/z 1,187 (3+ charge) and corresponded to a series of masses differing by 162 D representing oligomannose-type oligosaccharides ranging from mannose 3 to mannose 9. The peak with an m/z value of 1,352.1 (3+ charge) corresponded to the peptide Asn 155 with a hybrid oligosaccharide structure. The peaks with m/z values of 735 and 863 arose from earlier eluting peptides K33 and K34, respectively. In contrast the phAT spectrum for this glycopeptide (Fig10E) had a single main peak with an m/z value of 1,462.8, again corresponding to a glycopeptide containing a biantennary disialylated oligosaccharide structure. Additionally, treatment of rhAT with endoH to remove oligomannose-type oligosaccharides produced a shift in the peptide map peak containing Asn 155 (K15) (data not shown).
The predominant oligosaccharide at the Asn 192 glycosylation site of rhAT (K18) (Fig 10C) was a fucosylated biantennary monosialylated structure giving an m/z of 899.0 for the 4+ and 1,348.0 for the 3+ charge states. The series of peaks around m/z 1,006.6 corresponded to fucosylated biantennary disialylated structures. The heterogeneity observed around these peaks also arose from the monosaccharide substitutions described for the Asn 96 glycopeptide (above). The phAT spectrum (Fig 10F) contained two major peaks at an m/z of 947.3 and 1,420.6 corresponding to the 3+ and 2+ charge states of the glycopeptide containing a biantennary disialylated oligosaccharide structure.
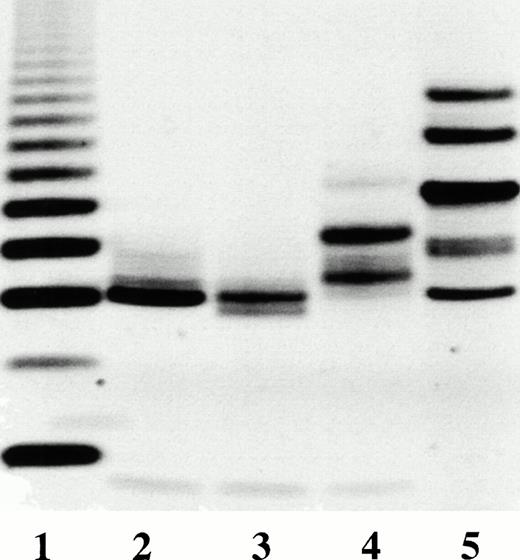
FACE analysis of oligosaccharides released from rhAT and phAT confirmed that the predominant oligosaccharide present on the recombinant protein was a monosialylated biantennary fucosylated structure (Fig 11, lane 4). Fucose on the rhAT oligosaccharides made the oligosaccharide slightly larger (slower mobility) than the nonfucoslyated form. The lack of a single sialic acid retarded the mobility of charged oligosaccharides (Fig 11, lane 4) in which the upper major band was identified as the monosialylated and the lower band disialylated. Adding sialic acid to rhAT with sialyltransferase resulted in a FACE gel pattern with shift in intensity from the upper to the lower band (data not shown). The FACE analysis also showed the increased oligosaccharide heterogeneity present on rhAT compared with both phAT and goat plasma AT although the method did not clearly resolve the oligomannose structures in the rhAT sample. That the FACE profile of goat AT was similar to that of phAT suggested that the increased fucosylation and heterogeneity, as well as the presence of oligomannose structures, was a result of expression in the mammary gland and did not arise because of goat/human glycosylation differences.
FACE analysis of phAT (lane 2), goat plasma AT (lane 3), and rhAT (lane 4) N-glycanase released oligosaccharides. Lane 1 contains dextran polymers of varying length beginning with a trimer at the bottom of the gel and increasing by one sugar for each band to the top. Lane 5 contains a series of standard oligosaccharides (Dionex Corp) from bottom to top: disialylated biantennary, trisialylated triantennary, asialo biantennary, asialo triantennary, and asialotetraantennary complex oligosaccharides.
FACE analysis of phAT (lane 2), goat plasma AT (lane 3), and rhAT (lane 4) N-glycanase released oligosaccharides. Lane 1 contains dextran polymers of varying length beginning with a trimer at the bottom of the gel and increasing by one sugar for each band to the top. Lane 5 contains a series of standard oligosaccharides (Dionex Corp) from bottom to top: disialylated biantennary, trisialylated triantennary, asialo biantennary, asialo triantennary, and asialotetraantennary complex oligosaccharides.
DISCUSSION
Production of rhAT in the mammary gland of transgenic goats has provided a means for high level (>1 g/L) expression of this therapeutic protein. This report provides the first detailed structural and functional analysis of a human therapeutic protein produced in the milk of a transgenic animal to be used in human clinical studies. In fact, rhAT was successfully evaluated in phase I and phase II human clinical studies designed to test the ability of rhAT to maintain hemostasis during coronary artery bypass graft surgery.
The rhAT isolated from the milk of transgenic goats was indistinguishable from phAT with the exception of its heparin-binding affinity and the nature of its glycosylation. The rhAT and phAT exhibited equivalent activity in in vitro thrombin and factor Xa inhibition assays and were structurally comparable in RP-HPLC binding characteristics, LC/MS peptide mapping profiles (except for the glycopeptides) and near and far ultraviolet circular dichroism spectra. The major differences in glycosylation noted were that the rhAT was less sialylated, more fucosylated, and contained GalNAc for Gal substitutions and some NGNA as well as NANA as terminal sugars when compared with phAT.
These differences in glycosylation between the rhAT and phAT are presumed responsible for the difference in heparin binding. Previous reports by Zettlmeissl et al48 described site mutation experiments on individual glycosylation sites of rhAT produced in Chinese hamster ovary (CHO) cells, which resulted in higher affinity for heparin when compared with phAT. A current report,49using similar techniques, corroborated the above study and further showed that the presence of glycosylation on the Asn 155 site was responsible for generating the lower affinity glycoform of the fully glycosylated AT made in CHO cells. The nature of the oligosaccharides present was not determined. In another study, Garone et al50 reported that fucosylation at the Asn 155 site reduced the heparin affinity of a variant of rhAT made in baby hamster kidney cells in which Asn 135 was mutated to Gln 135. Neither the phAT nor the rhAT examined here had fucosylated oligosaccharides at the Asn 155 site. The main difference observed between phAT and rhAT at Asn 155 was in the nature of the glycosylation: phAT had a charged oligosaccharide and rhAT had a noncharged oligosaccharide. Because of the different expression systems used and differences in glycosylation at sites other than the Asn 155 site, it is difficult to directly compare the results we have obtained with these other studies. However, it is apparent that glycosylation differences at the Asn 155 site are important in determining the overall heparin affinity of AT.
The data presented above indicated that both the α and β isoforms of rhAT bound more tightly to heparin than the α and β isoforms of phAT. Because all of the sites of the α form are fully glycosylated, the increase in heparin affinity observed must have been caused by the nature of the glycosylation present not the degree of site occupancy. As noted above, rhAT exhibited an overall lower level of sialylation than phAT and a very different glycoform distribution at the Asn 155 site. Initial studies suggested that removal of sialic acid from phAT resulted in a higher affinity for heparin (data not shown). The prevention of glycosylation on the individual sites increased heparin affinity48 49 purportedly by reducing steric hindrance to heparin binding. Alternatively, the prevention of glycosylation by site mutation also prevented potential sialylation, which could exert a charge repulsion effect with negatively charged heparin sulfate. Whether the absence of sialic acid on specific glycosylation sites would impart any enhancement of heparin binding will require further study.
The fact that transgenically produced rhAT had a higher heparin affinity may have relevance to its clinical use. The importance of an increased affinity of AT for heparin in vivo may lie in the fact that heparin and heparin-like glycosaminoglycans are receptors for AT and thrombin and that these glycosaminoglycans are found in the vascular endothelium and extravascular spaces, not circulating in the blood stream. AT is activated by binding to heparan sulfate proteoglycans on endothelial cells,17,21,51,52 and clearance of AT from blood occurs by redistribution into the extravascular space and binding to the endothelial surfaces.24,51 53
The control of thrombin activity locally may be the initial step in preventing disseminated intravascular coagulation (DIC) by controlling the occurrence of coagulatable sites in blood vessels and organs.21 Thrombin was implicated in stimulating the vascular endothelium to synthesize prostacyclin,54 tissue plasminogen activator,55 and tissue plasminogen activator inhibitor56 besides its activation of coagulation. AT was shown to inhibit thrombin-induced prostacyclin induction in HUVEC cells.57 Thrombin was also found to enhance the adhesion of neutrophil leukocytes to endothelial cells.58 59
A recent study showed that AT at high dose, without added heparin, was an effective and safe therapy for disseminated intravascular coagulation with organ failure in four children.60 Thus, enhancing the ability of AT to inhibit thrombin locally may provide a better way to control not just coagulation but other thrombin-induced events. rhAT, with its higher affinity for heparin, could provide more AT at sites of insult or inflammation to help control DIC and other events stimulated by the presence of thrombin. Studies to ascertain differences in the biodistribution and efficacy because of increased heparin affinity are in progress.
ACKNOWLEDGMENT
We thank Paul DiTullio, currently of Midas Biologicals Inc, (Grafton, MA) for his extensive efforts in making this program possible. We also thank Karen Albee, Karen Lee, and Robert Segalla of the Structural Protein Chemistry Group for providing expert analytical support.
Address reprint requests to Edward S. Cole, PhD, Cell and Protein Therapeutics Department, Genzyme Corp, 1 Mountain Rd, Framingham, MA 01701-9322.
The publication costs of this article were defrayed in part by page charge payment. This article must therefore be hereby marked "advertisement" is accordance with 18 U.S.C. section 1734 solely to indicate this fact.

This feature is available to Subscribers Only
Sign In or Create an Account Close Modal