Abstract
Translocations involving the mixed lineage leukemia gene (MLL ), the human homolog of the Drosophila gene trithorax, are one of the most common genetic alterations in human acute leukemias. Each translocation involving MLL results in loss of one functional copy of MLL and the generation of a chimeric fusion protein with potential dominant negative or neomorphic activity. Mll is a positive regulator of Hox genes, which have been implicated in both axial skeleton patterning and hematopoietic development. Previous studies indicated that Hox gene expression is altered in Mll heterozygous (+/−) and homozygous (−/−) deficient mice. To study the role of Mll in hematopoiesis and to obtain insights into leukemogenesis, we have examined the effects of haplo-insufficiency or absence of Mll by in vitro differentiation of Mll +/+, +/−, and −/− yolk sac progenitor cells. Mll −/− colonies were fewer in number, took longer to develop, and contained fewer cells than their wild-type and heterozygous counterparts. Formation of colony-forming unit-granulocyte, erythroid, macrophage, megakaryocyte (CFU-GEMM), colony-forming unit-macrophage (CFU-M), and burst-forming unit-erythroid (BFU-E) was markedly decreased in Mll −/− cultures, while numbers of colony-forming unit-erythroid (CFU-E), colony-forming unit-granulocyte (CFU-G), and colony-forming unit-granulocyte macrophage (CFU-GM) were essentially unaffected. Despite the decreased numbers of colonies present, Mll −/− cultures showed all cell types without morphologic evidence of maturation arrest. These studies indicate that Mll is required for normal numbers of hematopoietic progenitors and their proper differentiation, especially along the myeloid and macrophage pathways.
REARRANGEMENTS of the mixed lineage leukemia gene (MLL ) are associated with both acute lymphoblastic leukemia (ALL) and acute myelogenous leukemia (AML). The most common alterations of MLL are the t(4; 11) and t(11; 19) translocations that are present in 7% to 10% of ALL and more than 70% of acute leukemias in infants. Infants with translocations involving the 11q23 locus have a markedly worse survival than those with germline 11q23.1,2 The leukemic blasts in infant ALL usually express the B-cell marker CD19, as well as HLA-DR and TdT, but are often common acute lymphoblastic leukemia antigen (CALLA) and cytoplasmic immunoglobulin negative (early precursor B-ALL). In addition, the cells usually express the myelomonocytic marker CD15. The mixed lineage of these blasts has led to speculation that the MLL-AF4 protein that is formed by the t(4; 11) translocation, and other MLL fusion proteins, transforms a multipotential stem cell or disturbs differentive cell fate. This concept is further supported by the finding that MLL rearrangements are one of the common genetic alterations in acute myelogenous leukemia.3 In all, more than 20 different translocation partners have been identified, which are predominantly associated with either lymphoid or myeloid leukemias.
Sequence analysis of MLL shows homology to the Drosophila gene trithorax (trx ) in three regions including two putative zinc finger domains and a highly homologous carboxyl terminus that shows 60% identity with trx over a 220 amino acid region.4-7Trithorax positively regulates Hox gene expression in that Drosophila trx mutants show loss or abnormal patterns of Hox gene expression that result in defects in segment identity.8,9 Analysis of Mll null mice generated in our laboratory indicates that Mll functions like trx to positively regulate Hox gene expression. The ability of Mll to regulate Hox gene expression suggests that its role in both hematopoiesis and leukemogenesis may be mediated by altering patterns of Hox gene expression. A rapidly expanding body of literature shows that specific groups of Hox genes are expressed in specific hematopoietic lineages.10Hox genes in the 3′ end of the cluster tend to be expressed in hematopoietic progenitors, while expression of the more 5′ genes persists in more differentiated cells.11 Altered expression of specific Hox genes by gene targeting or antisense oligonucleotides has been shown to inhibit differentiation along specific lineages. For example, increased expression of Hox2B has been shown to inhibit erythroid differentiation.12 Increased expression of specific Hox genes has also been implicated in both murine and human leukemias. Overexpression of Hox a7 and Hox a9 by proviral integration appears to play an etiologic role in myeloid leukemias in BXH-2 mice.13 Remarkably, the t(7; 11)(p15; p15) translocation found in some human acute myeloid leukemias has been shown to result in fusion of the HOXA9 gene to the nucleoporin NU98.14 15 Given the apparent importance of Hox genes in controlling hematopoiesis, it seemed likely that deficiency of MLL, a known regulator of Hox genes, would result in disordered hematopoiesis. Furthermore, analysis of hematopoiesis in Mll null embryos might yield important clues to the mechanism of Mll-mediated leukemogenesis.
In this study, we show that Mll is expressed in T and B lymphocytes and in myeloid cells, but is not expressed in mature erythroid cells. Analysis of yolk sac hematopoiesis from Mll +/+, +/−, and −/− mice16 showed marked differences in the kinetics of colony formation and in the size of hematopoietic colonies obtained. The number and size of myeloid (CFU-M, CFU-GM) and mixed (CFU-GEMM) colonies was markedly decreased, and the number of BFU-E was moderately decreased in Mll null embryos. Histologic examination of in vitro cultures showed identical cell types present in Mll +/+, +/−, and −/− colonies, with no evidence of a maturation block. These data suggest that Mll affects early events in hematopoiesis such as hematopoietic progenitor proliferation or recruitment, but is not required for the terminal stages of hematopoietic differentiation.
MATERIALS AND METHODS
Cytochemical and flow cytometric analysis of Mll expression.Air dried bone marrow smears from Mll +/+ and +/− mice were fixed for 10 minutes in phosphate-buffered saline/2% neutral buffered formalin and were then stained overnight at 37°C for β-galactosidase activity in the presence of NP-40 and sodium deoxycholate.17 β-Galactosidase activity in bone marrow and spleen cells was analyzed using flow cytometric detection of fluorescein di-β-D-galactopyranoside (FDG) (Sigma, St Louis, MO). Single cell suspensions (150 μL) in hypotonic buffer were stained for 10 minutes at 37°C with an equal volume 2 mmol/L FDG dissolved in FDG solvent (eight parts H2O: 1 part dimethyl sulfoxide: one part ethanol). The FDG-loaded cells were then stained with either biotinylated (Gr-1, CD3) or phycoerythrin-conjugated (Ter-119, CD11b, B220) monoclonal antibodies (Pharmingen, San Diego, CA) and were then analyzed using a FACscan flow cytometer (Becton Dickinson, San Jose, CA).
RNA in situ hybridization analysis.In situ hybridization on paraformaldehyde-fixed spleen sections was performed as previously described16 using an antisense Mll probe riboprobe generated from an EcoRI-Xba I cDNA subclone that was linearized with EcoRI and transcribed using T7 RNA polymerase (Boehringer Mannheim, Indianapolis, IN) and 33P-uridine 5′-triphosphate (Amersham, Arlington Heights, IL). Sense probes were generated by linearizing the same template with Xba I and transcribing with T3 RNA polymerase (Boehringer Mannheim).
Analysis of yolk sac hematopoiesis.Yolk sacs from E10.5 embryos were dissected and were then incubated in 0.1% collagenase/phosphate-buffered saline/20% fetal bovine serum for 30 minutes. Following incubation, the yolk sacs were dispersed by aspiration through 25 and then 30 gauge hypodermic needles and were then plated in methylcellulose media containing recombinant growth factors (Stem Cell Technologies, Inc, Vancouver, BC, Canada). Cells from each yolk sac were plated in duplicate in 2 mL of methylcellulose media (alpha MEM/0.9% methylcellulose/10 μg/mL bovine pancreatic insulin/200 μg/mL human transferrin/2 mmol/L glutamine/10 ng/mL recombinant murine interleukin-3 [IL-3]/10 ng/mL recombinant human IL-6/50 ng/mL stem cell factor/15% fetal bovine serum) with or without added erythropoietin (30/mL). For quantitation of colony-forming unit-erythroid (CFU-E), dissociated cells representing one half of a yolk sac were plated in 2 mL methylcellulose media containing 3 U/mL recombinant erythropoietin and without added insulin, transferrin, or recombinant growth factors. For quantitation of colony-forming unit-granulocyte, erythroid, monocyte, megakaryocyte (CFU-GEMM), colony-forming unit-granulocyte macrophage (CFU-GM), colony-forming unit-granulocyte (CFU-G), and colony-forming unit-macrophage (CFU-M), one half of the cells from each dissociated yolk sac were plated in methylcellulose media containing insulin, transferrin, and recombinant IL-3, IL-6, and stem cell factor, either with or without added erythropoietin. Colonies were scored according to published criteria for human cells.18 CFU-E were scored after 3 days in culture, while the other colony types were scored after 7 days in culture. The morphology of colonies and of bulk cultures was examined by diluting the aspirated colony or dish in phosphate-buffered saline, washing the cells and then preparing cytospin and smear preparations that were then Wright-Giemsa stained. The number of cells in individual colonies was determined by aspirating individual colonies, diluting in known volumes of phosphate-buffered saline, and then counting cell numbers by trypan blue exclusion using a hemocytometer. Embryos corresponding to each yolk sac were genotyped by polymerase chain reaction (PCR) analysis of DNA prepared from the tail of each embryo by PCR using the primer set ST2B+ (5′-GAACAGCAGATTCAGCGCCACG-3′) and ST2B-(5′-GGACGCTCCAGAAGAAG TTCGATTA-3′), which flanks the third exon of Mll and generates an 840-bp PCR product for the wild-type allele and the primer set ST2B+ and ST2lacZ-(5′-GAACAAACGGCGG ATTGACCGTAATG-3′), which generates a 504-bp PCR product in the targeted Mll allele.
Flow cytometric analysis of cell surface marker expression.Thirteen-day yolk sac methylcellulose cultures were diluted and washed with phosphate-buffered saline and were stained with phycoerythrin-conjugated monoclonal antibodies (CD11b, c-kit) (Pharmingen) and were then analyzed by flow cytometry as described above.
Reverse transcriptase (RT)-PCR analysis of yolk sac cultures.Yolk sac cultures grown in methycellulose media containing IL-3, IL-6, stem cell factor and erythropoietin (b) were harvested after 7 days and RNA was prepared using RNeasy (Qiagen Inc, Chatsworth CA). cDNA was synthesized from 1.25 × 10⁵ cell equivalents of RNA using 500 U SuperScript II RT (GIBCO-BRL, Gaithersburg MD) in a volume of 50 μL first-strand synthesis buffer (50 mmol/L TRIS pH 8.3/75 mmol/L KCl/3 mmol/L MgCl2 /10 mmol/L dithiothreitol (DTT)/200 μg/mL random hexamers/0.125 mmol/L deoxyribonucleoside triphosphates/4,000 U/mL RNAse inhibitor (Promega Corp, Madison WI). Reactions were incubated at 25°C for 10 minutes, 42°C for 60 minutes, 70°C for 15 minutes, and 4°C for 5 minutes. A total of 25 μL of cDNA was used for each PCR reaction. Reactions were done using 2.5 U Amplitaq polymerase (Roche Molecular Systems Inc, Branchberg NJ) in a volume of 40 μL (10 mmol/L TRIS pH 8.3/50 mmol/L KCl/1.5 mmol/L MgCl2 /0.001% gelatin/0.125 mmol/L dNTPs/0.06% dimethyl sulfoxide (DMSO)/500 ng each of 5′ and 3′ primers). Reactions were run for 35 or 40 cycles with a melt temperature of 94° × 1 minute, annealing temperature of either 55°C or 58°C × 1 minute, and extension temperature of 72°C × 1.5 minutes.
PCR primers and product sizes were: CD34 (237 bp),19,20 GATA-2 (720 bp),21 GM-CSF-R (598 bp),22 M-CSF-R (448 bp),23 CD11b (622 bp),22 CD18 (426 bp),22 CD64 (510 bp),22 α-globin (331 bp),24 β-major–globin (578 bp),21 and β-actin (568 bp).25 εy globin primers (5′-GACAGCTTTGGGAACTTGTCC-3′ forward, 5′-TCAGCTGTGAATTCATTGCCG-3′ reverse were a gift from Tim Ley (Division of Stem Cell Biology, Washington University School of Medicine, St Louis, MO). The intensity of the β-actin PCR product was comparable for each sample.
RESULTS
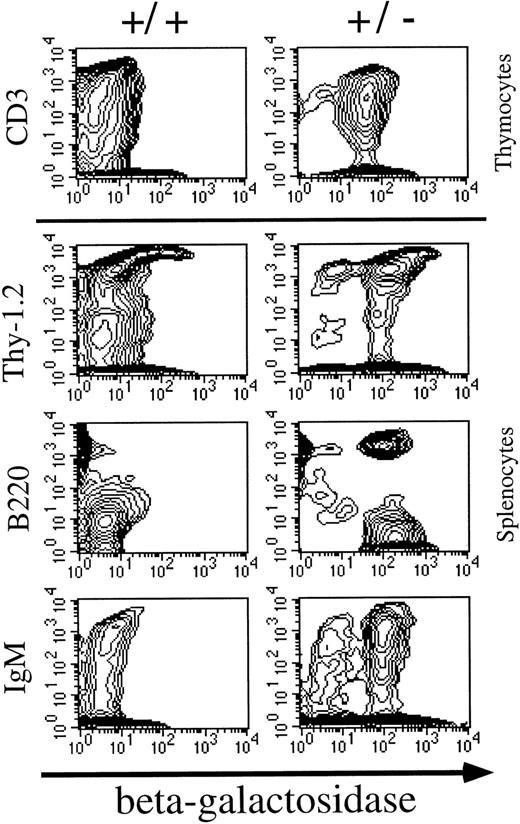
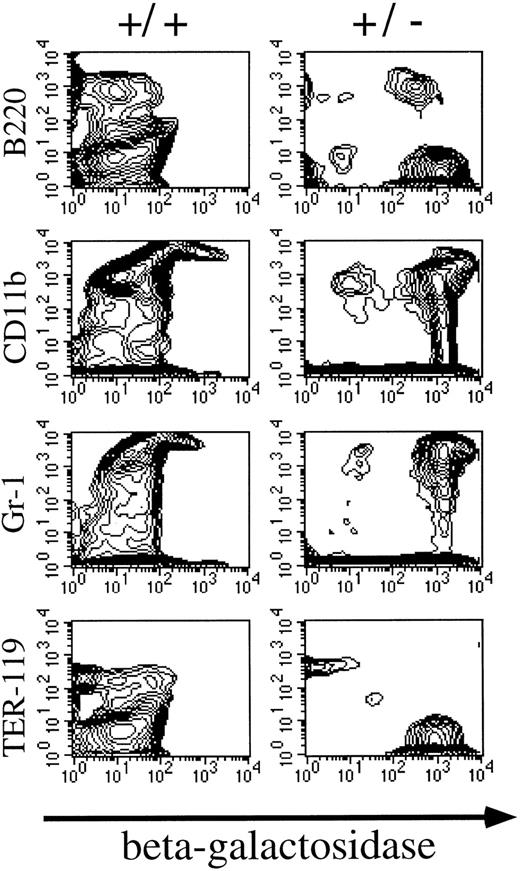
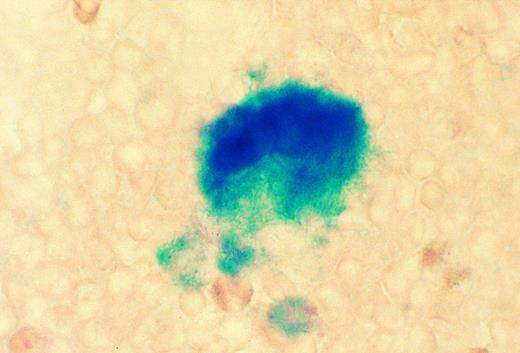
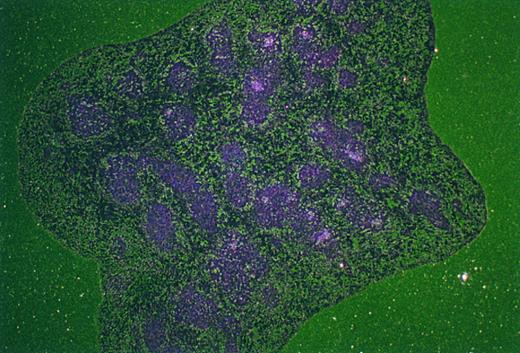
Patterns of Mll expression in hematopoietic cells. Mll +/− mice are mildly anemic and thrombocytopenic, although their red and white blood cell morphology appears to be normal.16 In addition, flow cytometric analysis showed mildly decreased numbers of B lymphocytes in heterozygous animals. Heterozygous mice were analyzed to determine the normal expression pattern of Mll in hematopoietic cells. The targeting vector used to disrupt Mll introduced lacZ in frame with Mll so that lacZ expression provides a convenient way of measuring levels of Mll expression. Flow cytometric detection of the fluorescent β-galactosidase substrate FDG showed that Mll was expressed in the majority of thymocytes (CD3 positive) (Fig 1). Mll was also expressed in the majority of B lymphocytes in bone marrow and in spleen (Figs 1 and 2). In addition, flow cytometric analysis of bone marrow showed that Mll was expressed in maturing myeloid or monocytic cells (Gr-1 and CD11b positive), but not in late erythroid cells (Ter 119 positive) (Fig 2). Air-dried bone marrow smears stained with X-Gal and counterstained with eosin showed intense staining of megakaryocytes and myeloid cells, with the strongest staining seen in neutrophils (Fig 3). β-Galactosidase staining of small intestine showed intense staining of lymphoid follicles within Peyer's patches (data not shown). In situ hybridization analysis of tissue sections of spleen confirmed that Mll is expressed at high levels in the lymphocytes of the white pulp with a pattern of expression that appears to be highest in germinal centers (Fig 4).
Flow cytometric analysis of β-galactosidase expression in thymocytes and splenocytes. Mll is expressed in both CD3low and CD3high thymocytes. A small population of CD3 high thymocytes was β-galactosidase negative. Most B220 positive cells expressed Mll and the majority of IgM positive cells expressed Mll.
Flow cytometric analysis of β-galactosidase expression in thymocytes and splenocytes. Mll is expressed in both CD3low and CD3high thymocytes. A small population of CD3 high thymocytes was β-galactosidase negative. Most B220 positive cells expressed Mll and the majority of IgM positive cells expressed Mll.
Flow cytometric analysis of β-galactosidase expression in bone marrow. Mll is expressed in B lymphocytes (B220 positive), and myeloid cells (Gr-1 and CD11b positive), but is not expressed in erythroid cells (Ter 119 positive).
Flow cytometric analysis of β-galactosidase expression in bone marrow. Mll is expressed in B lymphocytes (B220 positive), and myeloid cells (Gr-1 and CD11b positive), but is not expressed in erythroid cells (Ter 119 positive).
Cytochemical staining for β galactosidase in bone marrow smear from an 8-week-old Mll +/− mouse. A megakaryocyte and several neutrophils are strongly positive. No staining was seen in wild-type marrow (original magnification × 810).
Cytochemical staining for β galactosidase in bone marrow smear from an 8-week-old Mll +/− mouse. A megakaryocyte and several neutrophils are strongly positive. No staining was seen in wild-type marrow (original magnification × 810).
In situ hybridization analysis of Mll expression in spleen. RNA in situ hybridization was performed on cryostat sections of paraformaldehyde-fixed spleen as described in Materials and Methods. High level Mll expression is confined to the splenic white pulp (original magnification × 21).
In situ hybridization analysis of Mll expression in spleen. RNA in situ hybridization was performed on cryostat sections of paraformaldehyde-fixed spleen as described in Materials and Methods. High level Mll expression is confined to the splenic white pulp (original magnification × 21).
In contrast to heterozygous mice, Mll null mice were embryonic lethal and showed severe developmental abnormalities including branchial arch and neuronal defects (B.D.Y. and S.J.K., manuscript in preparation). Viable embryos could be recovered up to E10.5. Histologic sections of the Mll null embryos showed abundant erythropoiesis, with pooling of erythroid cells in the coelomic cavity. No intracranial hemorrhages suggestive of thrombocytopenia were observed. Touch preparations of cord blood in −/− embryos showed predominantly nucleated red blood cells and platelets.
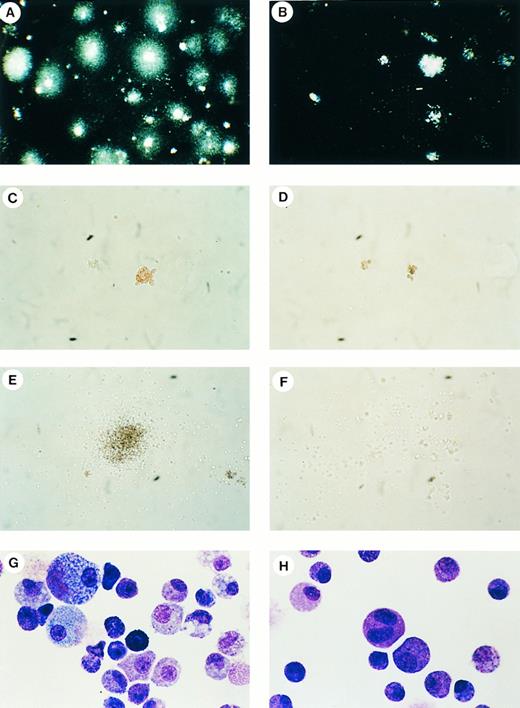
Analysis of Mll yolk sac hematopoiesis.The early lethality of Mll null embryos at about E11 precedes the time at which the predominant site of hematopoiesis shifts from yolk sac to liver (E11.5-E12.5). At E10.5, liver primordia undergoing extensive karyorrhexis could be identified in −/− embryos, which were too poorly preserved to assess hematopoietic function. Therefore, colony assays were performed on dissociated yolk sacs to study the role of Mll in hematopoiesis. Yolk sacs dissected from E10.5 embryos from +/− × +/− matings were dissociated and plated in methylcellulose media containing recombinant growth factors to support both erythroid and myeloid differentiation. Under these conditions, the colonies formed are of definitive hematopoieticorigin.26 In these preliminary experiments, several differences were noted between hematopoiesis in the −/− yolk sac cultures and in the +/+ cultures. First, the total number of colonies formed was decreased by more than 75% compared with +/+ cells. This decrease was due in part to a decreased number of cells in −/− yolk sacs (1.2 × 10⁵ ± 4.4 × 10⁴ cells in +/+ [n = 5] compared with 5.1 × 10⁴ ± 3.2 × 10⁴ in −/− [n = 3]), however the number of colonies obtained was decreased a further 30% when normalized to the number of cells plated. Secondly, the −/− colonies were smaller than wild-type colonies. For example, after 4 to 5 days in culture, macroscopically visible colonies were present in +/+ and +/− cultures, but were absent from the −/− cultures. The macroscopically visible colonies that eventually formed in −/− cultures were smaller and were less cohesive than in the +/+ and +/− cultures (Fig 5). From these preliminary experiments, it appeared that committed erythroid progenitors (cells corresponding to CFU-E that gave rise to hemoglobinized colonies at 3 days in culture) were largely unaffected in Mll −/− yolk sacs, whereas the number of myeloid (ie, nonhemoglobinized colonies) was markedly decreased.
E10.5 Yolk sac hematopoiesis. (A and B) Dark-field illumination of Mll +/+ (A) or Mll −/− (B) colonies from dissociated yolk sacs cultured for 9 days in methylcellulose media containing IL3, IL-6, and stem cell factor (original magnification × 3.7). (C and D) Colonies with CFU-E morphology in Mll +/+ (C) or Mll −/− (D) cultures grown for 5 days in methylcellulose media containing recombinant erythropoietin (original magnification × 134). (E and F ) Colonies with CFU-GM morphology in Mll +/+ (E) or Mll −/− (F ) cultures grown for 5 days in methylcellulose media containing recombinant IL3, IL6, and stem cell factor. The Mll −/− colony is small and poorly formed (original magnification × 67). (G and H) Maturing myeloid elements and macrophages in Wright-Giemsa–stained smear preparations from Mll +/+ (G) and Mll −/− (H) cultures after 10 days in culture (original magnification × 810).
E10.5 Yolk sac hematopoiesis. (A and B) Dark-field illumination of Mll +/+ (A) or Mll −/− (B) colonies from dissociated yolk sacs cultured for 9 days in methylcellulose media containing IL3, IL-6, and stem cell factor (original magnification × 3.7). (C and D) Colonies with CFU-E morphology in Mll +/+ (C) or Mll −/− (D) cultures grown for 5 days in methylcellulose media containing recombinant erythropoietin (original magnification × 134). (E and F ) Colonies with CFU-GM morphology in Mll +/+ (E) or Mll −/− (F ) cultures grown for 5 days in methylcellulose media containing recombinant IL3, IL6, and stem cell factor. The Mll −/− colony is small and poorly formed (original magnification × 67). (G and H) Maturing myeloid elements and macrophages in Wright-Giemsa–stained smear preparations from Mll +/+ (G) and Mll −/− (H) cultures after 10 days in culture (original magnification × 810).
Quantitation of Colony Types in Yolk Sac Hematopoiesis Cultures
| . | CFU-E . | BFU-E . | CFU-GEMM . | CFU-GM . | CFU-G . | CFU-M . | Mean No. Cells per Colony . |
|---|---|---|---|---|---|---|---|
| A. | |||||||
| +/+ | 142.5 ± 138.7 | 34.3 ± 29.7 | 124.3 ± 4.1 | 108.0 ± 34.6 | 12.3 ± 7.5 | 71.8 ± 0.5 | |
| (n = 8) | (121.8 ± 122.8) | (31.8 ± 25.5) | (113.5 ± 83.6) | (99.4 ± 32.7) | (11.6 ± 7.2) | (75.9 ± 49.6) | 1.3 × 104 × 1.1 × 104 (n = 48) |
| +/− | 150.66 ± 94.58 | 25.0 ± 11.1 | 43.0 ± 33.2 | 86.6 ± 37.6 | 13.0 ± 14.7 | 21.0 ± 8.5 | |
| (n = 6) | (168.4 ± 159.2) | (21.0 ± 25.6) | (45.6 ± 41.0) | (82.0 ± 36.8) | (10.4 ± 8.8) | (19.2 ± 5.6) | 1.4 × 10⁴ ± 9.5 × 10³ (n = 48) |
| −/− | 112.34 ± 82.1 | 3.0 ± 3.5 | 2.0 ± 2.2 | 53.3 ± 22.54 | 5.7 ± 4.3 | 5.0 ± 4.1 | |
| (n = 6) | (202.0 ± 125.0) | (6.0 ± 5.2) | (2.4 ± 2.6) | (77.0 ± 44.4) | (6.8 ± 4.8) | (5.4 ± 3.4) | 3.2 × 10³ ± 2.2 × 10³ (n = 48) |
| B. | 51.0 ± 14.06 | 43.0 ± 25.4 | 38.0 ± 14.2 | 71.0 ± 27.6 | 9.0 ± 4.8 | 31.5 ± 17.5 | ND |
| +/− | |||||||
| (n = 4) | (54.2 ± 17.6) | (23.5 ± 17.2) | (20.3 ± 9.5) | (36.5 ± 9.8) | (4.6 ± 2.3) | (17.4 ± 12.3) | |
| −/− | 78.0 ± 17.3 | 8.0 ± 3.5 | 4.7 ± 3.1 | 86.0 ± 61.0 | 2.0 ± 2.0 | 4.7 ± 1.2 | ND |
| (n = 3) | (198.9 ± 25.4) | (10.3 ± 4.3) | (5.7 ± 5.9) | (73.3 ± 52.1) | (4.8 ± 5.0) | (6.2 ± 2.6) |
Numbers represent number of colonies of particular morphology per yolk sac. Numbers in parentheses represent numbers of colonies per 105 yolk sac cells plated. CFU-E were scored 3 days after plating in methylcellulose media containing only erythropoietin as an added growth factor. The other colony types were scored after 7 days in culture in methylcellulose media containing IL-3, IL-6, and stem cell factor (A) or IL-3, IL-6, stem cell factor and erythropoietin (B).
Abbreviation: ND, not determined.
To further investigate these differences, the number of CFU-E was determined by plating dissociated yolk sacs in media containing only erythropoietin as an added growth factor, while the number of CFU-GEMM, CFU-GM, CFU-G, and CFU-M was determined by plating in methylcellulose media containing insulin, IL-3, IL-6, and stem cell factor with or without erythropoietin as added growth factors. The number of CFU-E was comparable in −/−, +/− and +/+ cultures (Table 1). In contrast, a moderate decrease in the number of BFU-E and marked decreases were seen in the number of colonies with CFU-GEMM and CFU-M morphology were seen in the −/− cultures. Marked decreases in the number of CFU-GEMM and CFU-M were also seen in “complete” media containing erythropoietin (Table 1B). The number of cells per colony was decreased more than 60% in the −/− cultures. The mean number of cells per colony in media containing IL-3, IL-6, and stem cell factor was 4.9 × 10³ (±5.3 × 10³) cells for −/− compared with 1.3 × 10⁴ (±1.0 × 10⁴) for +/+ and 1.3 × 10⁴ (±9.9 × 10³) for +/− colonies. Histologic examination of cytospin and smear preparations from the +/+, +/−, and −/− yolk sac cultures showed maturing myeloid elements, erythroid elements including occasional anucleated red blood cells, and rare megakaryocytes in cultures from all genotypes. Differential counts performed on Wright-Giemsa stained smears showed similar proportions of cell types, except for a striking decrease in the number of monocytes and macrophages in the Mll −/− cultures (Table 2). Large phagocytic macrophages were notably rare in the −/− cultures.
Quantitation of Cell Types in Yolk Sac Hematopoiesis Cultures
| . | +/+ . | +/− . | −/− . |
|---|---|---|---|
| Myeloblasts | 1.2 | 2.4 | 4.2 |
| Promyelocytes | 13.0 | 14.0 | 17.4 |
| Myelocytes | 49.2 | 62.4 | 62.2 |
| Metamyelocytes | 5.0 | 4.2 | 5.8 |
| Bands | 2.4 | 1.4 | 1.6 |
| Neutrophils | 6.0 | 1.0 | 1.6 |
| Basophils | 2.0 | 1.2 | 1.4 |
| Monocytes/macrophages | 25.6 | 8.8 | 3.2 |
| Erythroid cells | 1.0 | 4.6 | 2.6 |
Numbers represent the percentage of each cell type based on a 500 cell differential count on Wright-Giemsa stained smears of yolk sac cultures. Yolk sac cells from day 10.5 embryos were cultured for 10 days in methylcellulose media containing IL-3, IL-6, and stem cell factor.
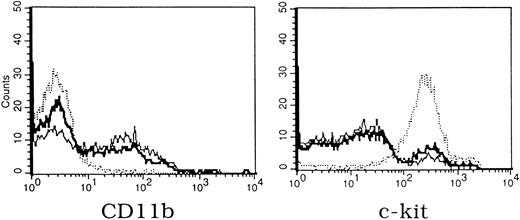
Only a slight increase in the number of cells with blast or promyelocyte morphology was detected in the Mll −/− cultures. Analysis of cell surface marker expression by flow cytometry showed that the majority of cells in −/− cultures were c-kit positive compared with a minority of cells in the +/+ or +/− cultures (Fig 6). As suggested by the colony counts on cultures grown in media containing IL-3, IL-6, and stem cell factor, the number of mature granulocytes and macrophages was markedly decreased as assessed by the myeloid/macrophage marker CD11b. Expression of additional lineage specific primers was examined by RT-PCR. Expression of early progenitor markers such as CD34 and GATA-2 was unaffected (Fig 7). Adult-type globins (α-globin and β-major globin) were expressed in −/− cultures providing evidence that their colonies were capable of definitive erythropoiesis. The most consistent abnormality detected by RT-PCR in −/− cultures was decreased expression of M-CSF–R and slightly decreased expression of CD64.
Flow cytometric analysis of yolk sac colonies cultured for 13 days in methylcellulose media containing IL-3, IL-6, and stem cell factor (bold solid line +/+, thin solid line +/−, dotted line −/−). Expression of CD11b (granulocytes, macrophages) is seen in Mll +/+ and +/− colonies, while high-level expression of c-kit (hematopoietic progenitor cells) is seen in Mll −/− cultures. Identical results were obtained in two experiments.
Flow cytometric analysis of yolk sac colonies cultured for 13 days in methylcellulose media containing IL-3, IL-6, and stem cell factor (bold solid line +/+, thin solid line +/−, dotted line −/−). Expression of CD11b (granulocytes, macrophages) is seen in Mll +/+ and +/− colonies, while high-level expression of c-kit (hematopoietic progenitor cells) is seen in Mll −/− cultures. Identical results were obtained in two experiments.
RT-PCR analysis of yolk sac colonies cultured for 7 days in methylcellulose media containing IL-3, IL-6, stem cell factor, and GM-CSF (top) or IL3-, IL-6, stem cell factor, and erythropoietin (bottom). B.M., control PCR reaction performed on adult murine bone marrow cDNA. The control reaction for ε globin was performed on E10.5 embryo cDNA.
RT-PCR analysis of yolk sac colonies cultured for 7 days in methylcellulose media containing IL-3, IL-6, stem cell factor, and GM-CSF (top) or IL3-, IL-6, stem cell factor, and erythropoietin (bottom). B.M., control PCR reaction performed on adult murine bone marrow cDNA. The control reaction for ε globin was performed on E10.5 embryo cDNA.
DISCUSSION
We have analyzed yolk sac hematopoiesis in gene ablated mice to study the normal role of Mll in hematopoiesis and to gain insights into the mechanism of Mll-mediated leukemogenesis.
Loss of one functional copy of Mll resulted in hematopoietic defects in yolk sac cultures. The number of BFU-E, CFU-GEMM, and CFU-M was significantly decreased in +/− cultures compared with wild-type cultures, while the number of CFU-E was mildly increased. Similar decreases in colonies with CFU-GM, CFU-M, and CFU-GEMM morphology and unaffected or increased numbers of CFU-E were seen in cultures of Mll +/− bone marrow (data not shown). The apparently normal production of CFU-E is somewhat surprising given that Mll +/− mice are mildly anemic. Although these colonies appeared to be morphologically normal, the possibility remains that they possess functional defects. The observation of Corral et al27 that Mll +/− embryonic stem (ES) cells contribute very little to circulating peripheral blood cells in chimeric animals lends further support to the thesis that two functional copies of Mll are needed for normal hematopoietic progenitor proliferation, survival, or differentiation.
Elimination of both copies of Mll resulted in an even greater reduction in the number of hematopoietic colonies, slower colony growth, and smaller numbers of cells per colony. The number of macrophages was strikingly reduced in −/− cultures, and in keeping with this finding the expression of CD11b by flow cytometry and M-CSF–R by RT-PCR was notably decreased. In contrast, erythropoiesis was relatively unaffected in Mll −/− cells. The CFU-E, BFU-E, and rare CFU-GEMM colonies that formed were morphologically normal in −/− cultures, and like the +/+ and +/− cultures showed adult type (definitive) erythropoiesis as evidenced by the expression of α-globin and β-major globin (Fig 7).
Our results differ somewhat from the findings of Fidanza et al28 who used a different approach with ES cells assessed in a two-step dissociated embryoid body assay. They report that Mll null ES cells form more colonies with accelerated kinetics. Embryoid body culture experiments appear to closely parallel hematopoiesis in the yolk sac and early fetal liver,29 but can vary in the degree differentiation depending on many experimental variables, especially the specific ES cells and lots of serum used. These experiments of Fidanza et al were done in media containing either no growth factors or flt-3 and stem cell factor. Addition of the latter resulted in a twofold difference in colony number without a change in colony phenotype. In our experiments, we did not observe spontaneous formation of colonies other than CFU-E in media containing only erythropoietin when actual hematopoietic progenitors from Mll −/− yolk sacs were assessed. Although the number of yolk sac progenitors might be decreased as a result of harvesting from a preterminal embryo, the differences persisted when colony numbers were normalized to the number of viable cells plated. In addition, plated cells showed similar viabilities (80% to 100%) from all genotypes of yolk sacs.
The small size and slower growth rate of Mll null yolk sac colonies suggests that Mll is required for normal proliferation and/or survival of hematopoietic progenitors. In addition, the colonies in Mll null cultures were poorly cohesive, raising the possibility of deficient expression of one or more cell surface adhesion molecules needed for normal colony formation. While in vitro cultured fetal cells may not have acquired additional genetic hits required for leukemogenesis, these findings place restraints on the possible mechanisms of oncogenesis. Mll null cells argue against a simple model in which Mll functions as a tumor suppressor in that loss of both functional copies of Mll did not lead to deregulated cell growth. These data also make it unlikely that the chimeric Mll fusion proteins transform via a simple dominant negative mechanism.
Analysis of Mll −/− cultures showed increased expression of the hematopoietic progenitor receptor c-kit in Mll −/− cultures with an accompanying decrease in expression of CD11b. Prominent c-kit expression was also noted on dissociated cells from Mll null embryoid bodies.28 Interestingly, increased c-kit expression was also seen in cultures of Mll +/− compared with +/+ bone marrow (data not shown). c-kit is normally expressed on hematopoietic progenitors including those that give rise to CFU-GEMM, CFU-GM, CFU-M, as well as BFU-E and CFU-E and is downregulated as these cells differentiate.30-35 Expression of c-kit in myeloid cells is normally limited to myeloblasts and promyelocytes.36 The marked increase in c-kit expression in Mll −/− cultures was somewhat surprising given that morphologically only a slight increase in immature myeloid cells was seen. Alternatively, Mll-deficient cells may require the retention of c-kit for their survival. Whether this abnormal c-kit expression pattern has any relationship to leukemogenesis remains to be explored.
The abnormalities seen in Mll −/− yolk sac cultures differ dramatically from what has been reported for targeted disruption of other genes that are important for hematopoietic differentiation, many of which are transcription factors.37,38 Knock-out of the basic helix-loop-helix (bHLH) protein tal-1/SCL, which like MLL is rearranged in leukemias that can differentiate along both lymphoid and myeloid lineages, results in complete absence of both erythropoiesis and myelopoiesis in the yolk sac and in absence of all hematopoietic cell lines in chimeric embryos.39-41 Similarly, knockout of the Lim-domain protein rbtn2/Ttg 2, which is translocated in some human T-cell acute lymphoblastic leukemias and has been shown to complex with tal-1/SCL, also results in complete absence of yolk sac erythropoiesis.42 Homozygous disruption of GATA-2 results in a phenotype that shares some similarities with Mll −/− mice.43 The number of colonies obtained in yolk sac hematopoiesis experiments from GATA-2 −/− cells is markedly decreased compared with heterozygous and wild-type cultures, however, the morphology of the cells obtained is apparently normal.43 GATA-2 knockout embryos differ from Mll knockout embryos in that at the time of death the GATA-2 embryos are markedly anemic, and in general, the defect in yolk sac hematopoiesis is much more severe. The early lethality of Mll embryos precludes assessment of the role of Mll in fetal liver or adult bone marrow hematopoiesis, and the role of Mll in lymphopoiesis. Studies of chimeric mice may shed light on the role of Mll in these later stages of hematopoiesis.
Supported by the Parker-Hughes Trust (Los Angeles, CA). B.D.Y. was supported by a training grant from the National Institutes of Health.
J.L.H. and B.D.Y. contributed equally to this work.
Address reprint requests to Stanley J. Korsmeyer, MD, Howard Hughes Medical Institute, Washington University School of Medicine, St Louis, MO 63110.


This feature is available to Subscribers Only
Sign In or Create an Account Close Modal