Abstract
We have previously found that TJ-48 has the capacity to accelerate recovery from hematopoietic injury induced by radiation and the anti-cancer drug mitomycin C (MMC). The effects are found to be due to its stimulation of spleen colony-forming unit (CFU-S) counts on day 14. In the present study, we attempt to isolate and purify the active components in TJ-48 extracts using a new in vitro hematopoietic stem cell (HSC) assay method. n-Hexane extract from TJ-48 shows a significant stimulatory activity. The extract is further fractionated by silica gel chromatography and HPLC in order to identify its active components. 1H-NMR and GC-EIMS indicate that the active fraction is composed of free fatty acids (oleic acid and linolenic acid). When 27 kinds of free fatty acids (commercially available) are tested using the HSC proliferating assay, oleic acid, elaidic acid, and linolenic acid are found to have potent activity. The administration of oleic acid to MMC-treated mice enhances CFU-S counts on days 8 and 14 to twice the control group. These findings strongly suggest that fatty acids contained in TJ-48 actively promote the proliferation of HSCs. Although many mechanisms seem to be involved in the stimulation of HSC proliferation, we speculate that at least one of the signals is mediated by stromal cells, rather than any direct interaction with the HSCs.
ORIENTAL HERBAL MEDICINES have been used for the treatment of various diseases for more than 2,000 years. Currently, chemotherapy using synthesized drugs has taken the place of herbal medicine. There is strong evidence, however, that the co-administration of herbal medicine with chemotherapy and/or radiation therapy can reduce the side effects of these treatments and improve the general condition of patients. Accordingly, herbal medicine has recently gained recognition as a biological response modifier. Such herbal medicines are composed of many herbs, which makes it difficult to identify the materials responsible for their potency and analyze the mechanisms by which they exert their effects.
Juzen-taiho-to (TJ-48; Shi-Quan-Da-Bu-Tang) is a traditional Japanese herbal medicine made from 10 different herbs. It has traditionally been administered to patients with anemia, anorexia, or fatigue. It has previously been reported that TJ-48 enhances peripheral blood counts in cancer patients who have been administered phase-specific drugs and/or have received radiation therapy.1 This effect was also observed in animal models, where it has been shown to prolong the survival of irradiated mice.2 We have also shown that the oral administration of TJ-48 prolongs the survival of tumor-bearing mice injected with mitomycin C (MMC).3,4 Moreover, we have previously demonstrated that TJ-48 shows a stimulatory effect on immune response5 and phagocytosis.6 In a recent study, we found that TJ-48 enhances day-14 spleen colony-forming unit (CFU-S) counts (but not day-9 CFU-S counts) when administered orally to mice before syngenic bone marrow transplantation (BMT).7 There is also a report indicating that the radioprotective effects of extracts of Acanthopanax senticosus Harms (Shigoka), which belongs to the ginseng family, were caused by the stimulation of both proliferation and self-renewal of HSCs.8
These findings prompted us to purify the HSC-stimulating substances from TJ-48 and identify their chemical structure. In this paper, we show that at least some of the active substances of TJ-48 are fatty acids, which are contained at the concentration of 0.1% in TJ-48. These standard fatty acids, obtained commercially, can also stimulate the proliferation of HSCs in vitro and increase day-8 and -14 CFU-S counts in MMC-treated mice in vivo. We also discuss the mechanisms behind the action of these active compounds.
MATERIALS AND METHODS
Mice.C3H and C57BL/6 (B6) mice were purchased from Shizuoka Experimental Animal Laboratory, Shizuoka, Japan.
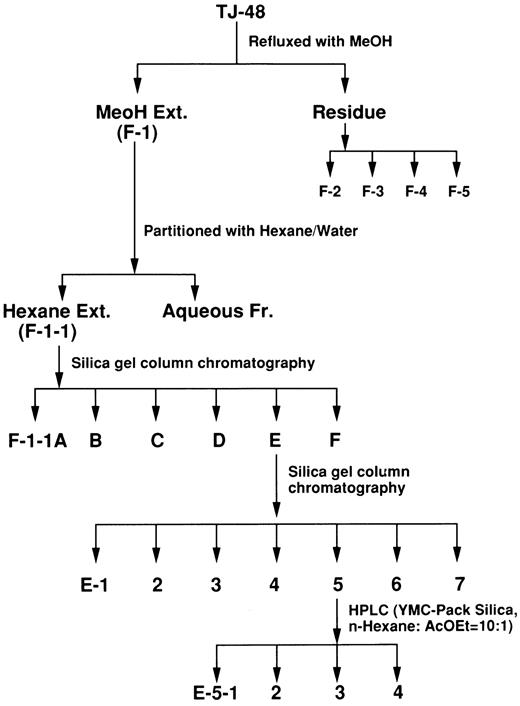
Purification and identification of active substances from Juzen-Taiho-To (TJ-48).Juzen-Taiho-to (TJ-48, Tsumura & Co, Tokyo, Japan) is made from the following ten herbs: Astragali radix (3.0 g, root of Astragalus membranaceus Bunge), Cinnamomi cortex (3.0 g, bark of Cinnamomum cassia Blume), Rehmanniae radix (3.0 g, root of Rehmannia glutinosa Libosch var. purpurea Makino), Paeoniae radix (3.0 g, rhizome of Paeonia lactiflora Pall), Cnidii rhizoma (3.0 g, rhizome of Cnidium officinale Makino), Atractylodis lanceae rhizoma (3.0 g, rhizome of Atractylodes lancea DC.), Angelicae radix (3.0 g, root of Angelica acutiloba Kitagawa), Ginseng radix (3.0 g, root of Panax ginseng C.A. Meyer), Hoelen (3.0 g, fungus of Poria cocos Wolf.), and Glycyrrhizae radix (1.5 g, root of Glycyrrhiza uralensis Fisch. et DC.). This herbal prescription was added to 285 mL of water and extracted at 100°C for 1 hour. The extract was filtered and spray-dried to obtain the dry extract powder (TJ-48, 2.3 g). Fractionation of TJ-48 was performed as shown in Fig 1. Briefly, TJ-48 was refluxed with methanol (MeOH) to obtain MeOH-soluble (F-1) and -insoluble fractions. The latter was further fractionated into F-2–F-5 according to their solubility in water and ethanol (EtOH), and dialyzability: F-2 (MeOH and water-insoluble), F-3 (dialyzable low-molecular weight fraction), F-4 (supernatant fraction of EtOH precipitation), and F-5 (polysaccharide fraction).9 F-1 was then partitioned with n-hexane/water. Hexane extract (F-1-1) was further purified by silica gel (Wako gel C-200) column chromatography using a different solvent system and then HPLC. HPLC was performed on a Shimadzu LC-6A equipped with a column (150 × 4.6 mm) of YMC-Pack SIL-60 (YMC Co Ltd, Kyoto, Japan) and developed with n-hexane:ethyl acetate (AcOEt).
The structures of these highly purified fractions were then analyzed using 1H- and 13C-NMR spectra (Varian XL-400 spectrometer operating at 400 MHz for 1H-NMR and 100 MHz for 13C-NMR). After E-5-2 and E-5-3 were methylesterified with a 0.5% HCl-MeOH, the products were analyzed by gas chromatography combined with EI mass spectroscopy (GC-EI-MS) on a Hewlett Packard model 5890 gas chromatograph and model 5970 B mass-selective detector equipped with an SP-2380 capillary column (0.2 μm film thickness, 0.25 mm i.d. × 30 m, Supelco).
Chemical substances.Twenty-seven standard pure fatty acids were tested for their capacity to stimulate the proliferation of HSCs. Stearic acid (Product No: NCP 53-3100-18), palmitic acid (NCP 53-3100-16), oleic acid (NCP 53-2600-46), and linolenic acid (NCP 53-2600-62) were purchased from Funakoshi (Tokyo, Japan). Other fatty acids were also obtained from Funakoshi and Sigma (St Louis, MO).
Granulocyte and macrophage colony-forming cell (GM-CFC) assay.Bone marrow cells were collected by flushing femurs and tibias, then single cell suspensions were obtained by repeated aspiration through needles. The bone marrow cells were plated in 35-mm tissue culture dishes (1.5 × 10⁵/dish) containing α minimum essential medium (α MEM, GIBCO, Grand Island, NY) supplemented with 20% fetal calf serum (FCS), 10% abdominal wall-conditioned medium, and 0.3% agarose with or without various concentrations of fractions of TJ-48 (in triplicate). The cultures were maintained at 37°C in 5% CO2 in air for 7 days. Colonies of more than 50 cells were counted.
HSC proliferation assay.A single cell suspension of bone marrow cells was collected and then passed through a Sephadex G-10 column to remove adherent cells such as macrophages and stromal cells. The bone marrow cells were further purified by discontinuous Percoll density gradient (1.060 < ρ < 1.073). HSC-enriched fractions (low density [LD] cells) were collected and suspended in α-MEM supplemented with 10% horse serum (Lot No. 10281, Nikken Biological Medicine Laboratory, Tokyo, Japan) and 10−6 mol/L hydrocortisone. Ten thousand cells per well (in triplicate) were then cultured in 96-well plates, which had become confluent with 20 Gy-irradiated MS-5 (a mouse stromal cell line derived from C3H bone marrow cells),10 with various concentrations of fractions of TJ-48 or standard fatty acids. These substances were dissolved in MeOH/dimethyl sulfoxide (DMSO) (1:1, vol/vol) and were appropriately diluted in culture medium. In all the cultures, the final concentration of the solvent was less than 0.025%, which did not affect the cell proliferation. As a control, LD cells were cultured with MS-5 cells in culture medium containing MeOH/DMSO. The culture was incubated for 4 to 5 days, after which 3H-thymidine was introduced into each well. After 20 to 24 hours, the cells were harvested and the incorporation of 3H-thymidine was measured. The stimulation indices of samples (fractions of TJ-48 or standard fatty acids) were expressed as ratios to the control: 3H-thymidine incorporation on sample well/that on control well. We determined that the test sample showed a stimulatory activity when the value was more than 1.3.
Stimulation Index of TJ-48 and Its Various Fractions for GM-CFC Formation
| . | TJ-48 . | F-1 . | F-3 . | F-4 . | F-5 . |
|---|---|---|---|---|---|
| 10 μg/mL | 1.18* | 2.11 | 1.26 | 1.46 | 1.19 |
| 100 μg/mL | 1.09 | 1.84 | 2.18 | 0.93 | 1.58 |
| . | TJ-48 . | F-1 . | F-3 . | F-4 . | F-5 . |
|---|---|---|---|---|---|
| 10 μg/mL | 1.18* | 2.11 | 1.26 | 1.46 | 1.19 |
| 100 μg/mL | 1.09 | 1.84 | 2.18 | 0.93 | 1.58 |
F-2 was also obtained by fractionation of the MeOH-insoluble fraction (residue), but was insufficient to use GM-CFC assay. Therefore, we could not include the data of F-2.
Stimulation index was calculated using the following formula: Stimulation index = No. of GM-CFC on sample well/No. of GM-CFC on control well. Values more than 1.3 are in boldface.
In some experiments, highly purified dormant HSCs11 (P-HSCs) were used instead of the HSC-enriched fraction (LD cells). Briefly, BMCs were collected from mice that had been administered 5-FU 4 days beforehand. LD cells were obtained by Percoll density gradient, and mature hematopoietic cells (CD4, CD8, B220, Mac-1, Gr-1–positive cells) were then removed using magnetic beads (Dyna beads M-450 SH/RT IgG). These cells were then labeled with PE-conjugated anti-CD71 antibody and appropriate FITC-conjugated anti–H-2 antibody. CD71negative and H-2high cells were sorted using FACStar, and 200 to 300 sorted cells were cultured on irradiated MS-5 or syngenic bone marrow stromal cells prepared by culturing bone marrow cells for 3 weeks. Ten to 14 days later, the incorporation of 3H-thymidine into DNA was assessed.
Pre-incubation of HSCs or stromal cells with fatty acids.LD cells or P-HSCs were pre-incubated with 0.5 to 10 μg/mL of oleic acid or linolenic acid for 2 to 4 hours at 37°C, then washed twice. LD cells or P-HSCs were then cultured with MS-5 cells for 5 (LD cells) or 10 (P-HSCs) days. MS-5 cells were also pre-incubated with the same fatty acid solutions. After washing, nontreated LD cells or P-HSCs were cultured with the MS-5 cells. Their proliferation was measured by 3H-thymidine uptake as described above.
Long-term culture of HSCs with MS-5 stimulated by linolenic acid.P-HSCs (700 cells per 25 cm2 flask) were cocultured with 20 Gy-irradiated MS-5 in triplicate. The culture contained 1 or 5 μg/mL of linolenic acid plus the same medium as that used for the HSC proliferation assay. In other flasks, MS-5 were pre-incubated with 1 or 5 μg/mL of linolenic acid for 1 day and washed two times with medium and then irradiated before coculture with P-HSCs. The culture medium of these flasks was replaced with fresh medium at 1-week intervals, and the numbers of nonadherent cells and cobblestone colonies per flask were counted.
All experiments were carried out three or more times, and reproducible results obtained. Representative data are shown in the tables and figures. Although the experimental conditions were identical, the stimulation indices shown in tables and figures are not constant. This is probably due partly to variations in the number of HSCs in the LD cells or P-HSCs in the respective experiments.
Flow cytometric analyses of stromal cells stimulated by fatty acids.MS-5 was cultured with 1 or 5 μg/mL of oleic acid, linolenic acid, or butyric acid for 3 days. The cells were collected by trypsin/EDTA and incubated for 4 hours to allow their surface molecules on the trypsinized MS-5 to re-express. The incubated MS-5 was stained with PE-conjugated anti-MHC class I (H-2Kk) antibody (Pharmingen) or biotinated anti-MHC class II antibody (Pharmingen) and subsequently with avidin-PE. The cells were also stained with antibodies for adhesion molecules; FITC-conjugated anti-CD54 (ICAM-1) antibody and FITC-conjugated anti-CD106e (VCAM-1) (Pharmingen). The stained cells were analyzed on an FACScan (Becton Dickinson).
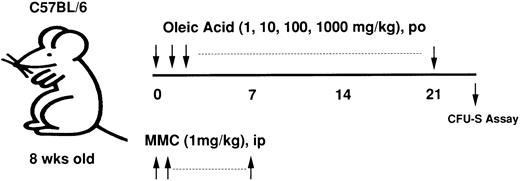
In vivo administration of fatty acids.The C57BL/6 (B6) mice were divided into two groups (4 mice/group). One group was administered oleic acid or linolenic acid, dissolved in 1% tween 80, orally (0.2 mL/mouse) at a dose of 1, 10, 100, or 1,000 mg/kg every day for 3 weeks. The other group (control) was administered 1% tween alone. MMC (1 mg/kg) was injected intraperitoneally into the mice in both groups every day for the first week. These mice were killed and their bone marrow cells (1.5 or 3 × 10⁵) then injected into 8.5Gy-irradiated syngeneic mice. Eight or 14 days later, the numbers of CFU-S were counted.
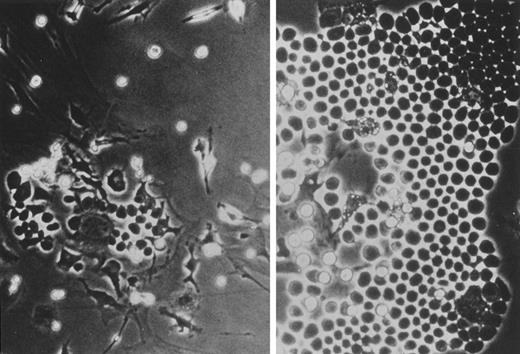
Increases in GM-CFC colony counts and size in the presence of F-1. Bone marrow cells were cultured in agarose containing abdominal wall-conditioned medium with (right) or without (left) 10 μg/mL of F-1 for 7 days.
Increases in GM-CFC colony counts and size in the presence of F-1. Bone marrow cells were cultured in agarose containing abdominal wall-conditioned medium with (right) or without (left) 10 μg/mL of F-1 for 7 days.
RESULTS
Purification of HSC-stimulatory substances from TJ-48.TJ-48 was fractionated as shown in Fig 1. TJ-48 was first divided into two fractions: MeOH-soluble (F-1) and -insoluble (residue). The residue was further fractionated into F-2 to F-5. TJ-48 and F-1 to F-5 were first tested for their capacity to stimulate the colony formation of GM-CFC, as described in Materials and Methods. As shown in Table 1, all the fractions displayed stimulatory activity over 1.3 times that of the control. F-1 of these fractions showed the highest stimulatory activity (2.11) at the concentration of 10 μg/mL; both cell numbers and colony size of GM-CFC colonies were also larger than in the other fractions (Fig 2).
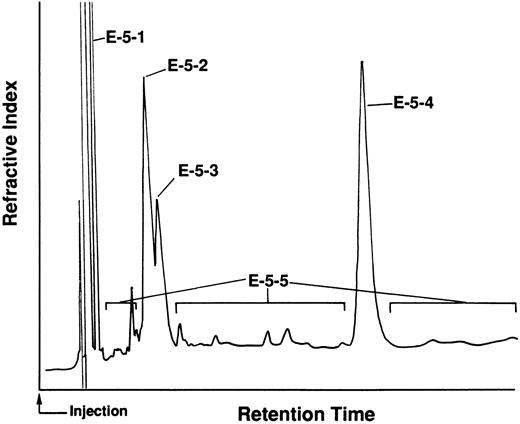
To examine the stimulatory activity of these fractions for more primitive HSCs, we performed the HSC proliferation assay using HSC-enriched fractions (LD cells) and a stromal cell line (MS-5). As with the GM-CFC assay, the highest stimulatory activity (stimulation index: 4.40) was achieved when F-1 was added at a concentration of 10 μg/mL, whereas F-3 to F-5 showed activity less than 1.3 (data not shown). F-1 was further partitioned into two fractions: a hexane-soluble fraction (F-1-1) and a hexane-insoluble fraction (aqueous fraction) with hexane/water. The hexane-soluble fraction (F-1-1) stimulated the proliferation of HSCs at various concentrations (0.1 to 10 μg/mL) (Table 2, Exp 1). F-1-1 was further fractionated using silica gel column chromatography to obtain F-1-1 A to F-1-1 F. Activity was found in F-1-1 E or F-1-1 F but not F-1-1 B and F-1-1 D. F-1-1 E was further fractionated using silica gel column chromatography to obtain E-1 to E-7. E-4 to E-7 showed stimulatory activity (Table 2, Exp 2) but not E-1 to E-3 (data not shown). Elution patterns of silica gel column chromatography and thin layer chromatography revealed that each fraction was a mixture of several compounds, some of which were similar in each fraction (data not shown). E-5 was further purified to obtain the active substances using HPLC as shown in Fig 3. Four main peaks (E-5-1 to E-5-4) were found. The minor peaks were mixed together and collected as E-5-5. As shown in Table 2, Exp 3, all fractions had the capacity to stimulate the proliferation of HSCs, although the optimal doses differed.
Stimulation Index of Various Fractions Obtained From TJ-48 for HSC Proliferation
| Experiment 1 . | |||||
|---|---|---|---|---|---|
| . | |||||
| . | F-1-1 . | F-1-1 . | |||
| . | . | B . | D . | E . | F . |
| 0.1 μg/mL | 2.09* | 1.17 | 1.28 | 1.80 | 0.87 |
| 0.5 μg/mL | 1.96 | 0.90 | 1.11 | 1.95 | 1.50 |
| 1 μg/mL | 1.77 | 1.10 | 1.16 | 2.71 | 1.68 |
| 2.5 μg/mL | 1.55 | 0.89 | 0.14 | 0.22 | 0.32 |
| 5 μg/mL | 1.38 | ND | ND | ND | ND |
| 10 μg/mL | 1.46 | ND | ND | ND | ND |
| . | F-1-1 . | E-4 . | E-5 . | E-6 . | E-7 . | WEHI-3 Cond. Med. (5%)† . | |
|---|---|---|---|---|---|---|---|
| . | E . | F . | . | . | . | . | . |
| 0.1 μg/mL | ND | ND | 1.01 | 1.21 | 1.17 | 0.97 | 1.60 |
| 0.5 μg/mL | ND | ND | 1.09 | 1.43 | 1.28 | 1.06 | |
| 1 μg/mL | 1.98 | 1.42 | 1.30 | 1.49 | 1.95 | 1.68 | |
| . | E-5 . | E-5-1 . | E-5-2 . | E-5-3 . | E-5-4 . | E-5-5 . | WEHI-3 Cond. Med. (5%) . |
|---|---|---|---|---|---|---|---|
| 0.05 μg/mL | ND | 1.41 | 1.16 | 1.51 | 1.37 | 1.48 | 1.22 |
| 0.1 μg/mL | 0.97 | 1.60 | 1.45 | 1.56 | 1.67 | 1.41 | |
| 0.2 μg/mL | ND | 1.49 | 1.29 | 1.51 | 1.49 | 1.45 | |
| 0.5 μg/mL | 1.37 | ND | ND | ND | ND | ND | |
| 1 μg/mL | 1.40 | ND | ND | ND | ND | ND |
Abbreviation: ND, not determined.
Stimulation index was calculated using the following formula: Stimulation index = 3H-thymidine uptake on sample well/3H-thymidine uptake on control well. Values more than 1.3 are in boldface.
As a positive control, 5% of WEHI-3 conditioned medium was added to the culture medium instead of the sample.
HPLC pattern of subfraction (E-5) of TJ-48. E-5 was further fractionated by HPLC using n-hexane-AcOEt (10:1) as eluent and the four main peaks collected as E-5-1–4. The minor peaks were mixed together as E-5-5.
HPLC pattern of subfraction (E-5) of TJ-48. E-5 was further fractionated by HPLC using n-hexane-AcOEt (10:1) as eluent and the four main peaks collected as E-5-1–4. The minor peaks were mixed together as E-5-5.
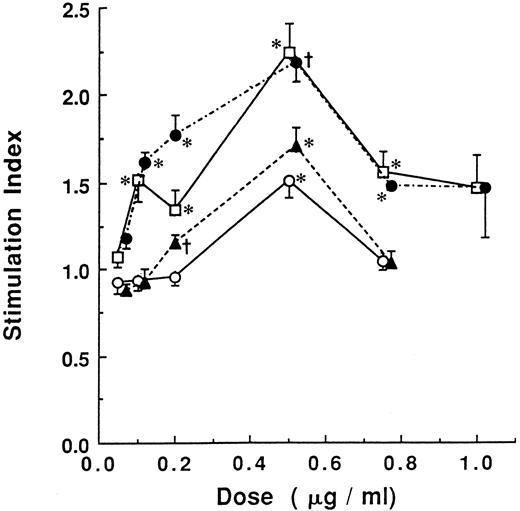
Stimulation of HSC proliferation by standard fatty acids. LD cells were cultured on MS-5 with or without various concentrations of standard commercially available fatty acids: palmitic acid ( — ○ — ), stearic acid (- - - ▴ - - -), oleic acid (⋅-⋅- • -⋅-⋅-), and linolenic acid ( — □ — ). 3H-thymidine incorporation of wells was measured and compared. The data are mean ± SD. *Different from control (culture without fatty acids) (P < .05). †P < .005.
Stimulation of HSC proliferation by standard fatty acids. LD cells were cultured on MS-5 with or without various concentrations of standard commercially available fatty acids: palmitic acid ( — ○ — ), stearic acid (- - - ▴ - - -), oleic acid (⋅-⋅- • -⋅-⋅-), and linolenic acid ( — □ — ). 3H-thymidine incorporation of wells was measured and compared. The data are mean ± SD. *Different from control (culture without fatty acids) (P < .05). †P < .005.
Stimulation Index of C4 to C24 Standard Fatty Acids for HSC Proliferation
| . | Fatty Acid Standard . | 0.2 μg/mL . | 0.5 μg/mL . | 1 μg/mL . |
|---|---|---|---|---|
| 4:0 | Butyric acid | 0.97 | 1.03 | |
| 8:0 | Caprylic acid | 1.02 | 0.98 | |
| 10:0 | Decanoic acid | 1.00 | 1.00 | |
| 11:0 | 1.36 | 1.36 | ||
| → | ||||
| Undecanoic acid | 0.84 | |||
| 14:1(cis-9) | Myristoleic acid | 1.25 | 1.24 | |
| 16:0 | Palmitic acid3-150 | 0.96 | 1.54 | |
| 16:1(cis-9) | Palmitoleic acid | 1.11 | 1.27 | |
| 18:0 | Stearic acid | 1.14 | 1.65 | |
| 18:1(cis-6) | 1.28 | 1.63 | ||
| → | ||||
| Petroselinic acid3-151 | 1.39 | |||
| 18:1(trans-6) | 1.75 | 1.62 | ||
| → | ||||
| Petroselaidic acid | 0.80 | |||
| 18:1(cis-9) | Oleic acid | 1.45 | 1.89 | 1.56 |
| 18:1(trans-9) | 1.70 | 1.82 | ||
| → | ||||
| Elaidic acid | 1.68 | |||
| 18:1(cis-11) | cis-Vaccenic acid | 1.29 | 0.84 | 0.92 |
| 18:1 | 11-trans-Octadecenoic acid | 0.83 | 0.90 | 1.02 |
| 18:2(cis-9,-12) | Linoleic acid | 1.35 | 1.14 | 1.24 |
| 18:2(trans-9,-12) | Linolelaidic acid | 1.05 | 1.07 | 1.22 |
| 18:3(cis-6,-9,-12) | 0.93 | 1.05 | ||
| → | ||||
| γ-Linolenic acid | 1.47 | |||
| 18:3(cis-9,-12,-15) | Linolenic acid | 1.78 | 1.87 | 1.51 |
| 19:1 | cis-10-Nonadecenoic acid | 0.95 | 1.24 | 1.24 |
| 20:1 | 5-Eicosenoic acid | 1.05 | 1.21 | 1.28 |
| 20:4(cis-5,-8,-11,-16) | Arachidonic acid | 1.08 | 0.89 | |
| 20:5(cis-5,-8,-11,-14,-17) | Eicosapentaenoic acid | 1.03 | 0.79 | |
| 22:0 | 1.59 | 1.37 | ||
| → | ||||
| Behenic acid | ||||
| 22:1(cis-13) | 1.23 | 1.35 | ||
| → | ||||
| Erucic acid | ||||
| 22:6(cis-4,-7,-10,-13,-16,-19) | 1.24 | 1.60 | ||
| → | ||||
| Docosahexaenoic acid | ||||
| 24:0 | Lignoceric acid | 0.94 | 1.11 | 1.24 |
| 24:1(cis-15) | Nervonic acid | 0.98 | 0.93 | 1.12 |
Fatty acids underlined are found in TJ-48.
Fatty acids indicated by arrows are not found in TJ-48, but show a stimulatory activity more than 1.3.
Comparison of Stimulatory Activity of Oleic Acid and Linolenic Acid on Proliferation of LD Cells and P-HSCs
| Fatty Acid . | LD Cells . | P-HSCs . | ||||
|---|---|---|---|---|---|---|
| . | Linolenic Acid . | Oleic Acid . | Linolenic Acid . | Oleic Acid . | . | |
| . | MS-5 . | MS-5 . | MS-5 . | BM Ad. Cells . | BM Ad. Cells . | . |
| 0.5 μg/mL | 1.98 ± 0.294-150 | 1.59 ± 0.134-150 | 2.46 ± 0.364-150 | 3.02 ± 0.144-151 | 1.71 ± 0.044-150 | |
| 1.0 μg/mL | 1.47 ± 0.294-150 | 1.65 ± 0.184-151 | 2.98 ± 0.294-151 | 4.90 ± 0.044-151 | 1.83 ± 0.394-150 | |
| 2.0 μg/mL | ND | ND | 4.44 ± 0.554-151 | ND | ND | |
P-HSCs were cultured on 20 Gy-irradiated MS-5 cells or syngeneic bone marrow stromal cells in the presence of fatty acids, and cell proliferation was measured 10 to 14 days later. LD cells were also cultured on MS-5 cells in the presence of oleic acid or linolenic acid for 4 days. Data are mean ± SE.
Different from control (P < .05).
P < .005.
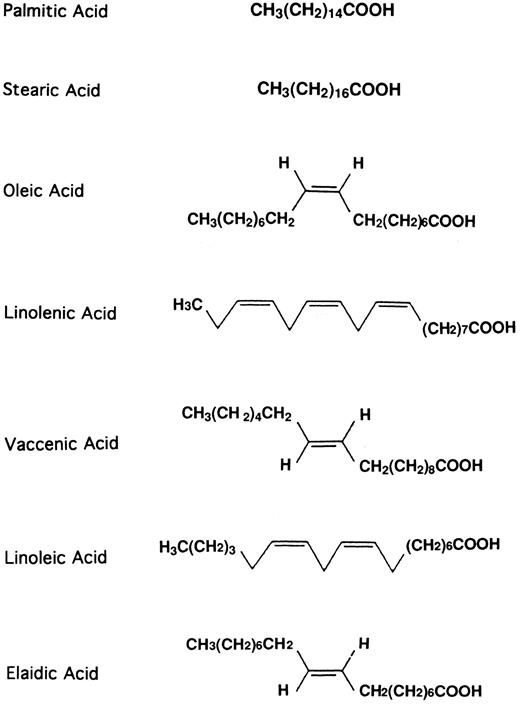
The 1H-NMR spectrum suggests that E-5-2 and E-5-3 are a mixture of fatty acids containing unsaturated bonds. GC and GC-EI-MS analyses revealed that E-5-2 and E-5-3 contained at least four kinds of fatty acids, respectively: palmitic acid, stearic acid, oleic acid, and linolenic acid (Fig 4). E-5-1 also contained several fatty acids. Pure, commercially available, substances were tested for their ability to stimulate the HSCs (Fig 5). Oleic acid and linolenic acid increased the proliferation of HSCs to approximately twice the level of the control, whereas palmitic and stearic acid showed only a slight increase. E-5-4 was mainly composed of β-sitosterol, but there was also low contamination with fatty acids. When all the fatty acids were removed from E-5-4, its stimulatory activity disappeared. Pure commercially available β-sitosterol had no stimulatory effect on the HSCs (data not shown).
Finally, six fatty acids (stearic acid, palmitic acid, oleic acid, linolenic acid, vaccenic acid, and linoleic acid) were found in TJ-48 (Fig 4) when TJ-48 was directly extracted with chloroform/MeOH (2:1). These standard fatty acids were tested for their stimulatory activity. Vaccenic acid and linoleic acid showed poor stimulatory activity. These findings indicated that fatty acids of C16 to C18 , such as stearic acid, palmitic acid, oleic acid, and linolenic acid (particularly linolenic acid and oleic acid, as shown in Fig 5) are the substances in TJ-48 capable of stimulating HSC proliferation.
HSC-stimulatory activity of other standard fatty acids.We next examined various standard fatty acids of C4 to C24 for their capacity to stimulate the proliferation of HSCs. The stimulatory activity was found in petroselinic acid, petroselaidic acid, elaidic acid, and γ-linolenic acid of C18 . Behenic acid, erucic acid, and docosahexaenoic acid of C22 also exhibited such activity (Table 3).
Effect of oleic acid and linolenic acid on the proliferation of highly purified HSCs.In the above experiments, we used partially purified HSCs (LD cells). This fraction contained HSCs and progenitor cells. Recently, we have established a new method of purifying pluripotent HSCs (P-HSCs) from 5-FU–injected mice; a small number of the highly purified HSCs (lineage−, CD71−, H-2high HSCs) can restore long-term hematopoiesis in irradiated recipients.11 Therefore, we examined the effect of these fatty acids on the P-HSCs. The P-HSCs were cultured with irradiated (20 Gy) MS-5 cells or syngeneic bone marrow stromal cells with or without fatty acids. Higher stimulatory activity of fatty acids was observed in the P-HSCs than in the HSCs (LD cells), as shown in Table 4. This in vitro data also indicates that fatty acids in TJ-48 stimulate the proliferation of P-HSCs rather than progenitor cells.
Effects of Pre-incubation of HSCs or MS-5 With Oleic Acid or Linolenic Acid on HSC Proliferation
| Experiment 1 . | |||
|---|---|---|---|
| . | |||
| Linolenic Acid . | Pre-incubation of Low Density Cells . | Pre-incubation of MS-5 . | |
| . | 2 h . | 2 h . | 4 h . |
| 1 μg/mL | 0.39 ± 0.06 | 1.99 ± 0.305-150 | 2.22 ± 0.335-150 |
| Experiment 1 . | |||
|---|---|---|---|
| . | |||
| Linolenic Acid . | Pre-incubation of Low Density Cells . | Pre-incubation of MS-5 . | |
| . | 2 h . | 2 h . | 4 h . |
| 1 μg/mL | 0.39 ± 0.06 | 1.99 ± 0.305-150 | 2.22 ± 0.335-150 |
| Linolenic Acid . | Pre-incubation of P-HSCs . | Pre-incubation of MS-5 . |
|---|---|---|
| . | 2 h . | 2 h . |
| 0.5 μg/mL | ND | 2.36 ± 0.345-150 |
| 1 μg/mL | 0.86 ± 0.18 | 1.98 ± 0.305-150 |
| Linolenic Acid . | Pre-incubation of P-HSCs . | Pre-incubation of MS-5 . |
|---|---|---|
| . | 2 h . | 2 h . |
| 0.5 μg/mL | ND | 2.36 ± 0.345-150 |
| 1 μg/mL | 0.86 ± 0.18 | 1.98 ± 0.305-150 |
| Oleic Acid . | Pre-incubation of MS-5 . |
|---|---|
| . | 4 h . |
| 1 μg/mL | 1.86 ± 0.235-150 |
| 5 μg/mL | 2.33 ± 0.165-151 |
| 10 μg/mL | 2.56 ± 0.255-151- - - - - - - - - - - - - - - - - - - - - - - - - - - - - - - - - - - - - - - - - - - - - - - - - - - - - - - - - - - - - - - - - - - - - - - - - - - |
| 1 μg/mL | 2.44 ± 0.375-150 |
| 10 μg/mL | 1.76 ± 0.025-151 |
LD cells or MS-5 were pre-incubated with linolenic acid for 2 or 4 hours, then washed two times. These cells were cultured with nontreated MS-5 cells or with nontreated LD cells, respectively. The incorporation of 3H-thymidine was measured 5 days later (Exp 1). P-HSCs (instead of LD cells) were used in Exps 2 and 3. The incorporation of 3H-thymidine was assessed 10 days later. Stimulation indices: sample well/control well, in which nontreated LD cells or P-HSCs were cultured on nontreated MS-5 cells. Mean ± SE.
Different from control (P < .05).
P < .005.
Mechanism of action of fatty acids.The next step was to clarify the mechanisms behind the action of these fatty acids: do they act directly on the P-HSCs or do they first act on the stromal cells, followed by the proliferation of P-HSCs? To answer this question, LD cells or MS-5 cells were pre-incubated with oleic acid or linolenic acid for 2 to 4 hours and, after washing, were cultured with nontreated MS-5 cells or LD cells, respectively. Table 5 indicates that short pre-incubation of MS-5 cells with linolenic acid can stimulate the proliferation of LD cells (Exp 1). The same finding was observed when P-HSCs (instead of LD cells) were used (Exp 2). Oleic acid also showed similar stimulatory activity (Exp 3).
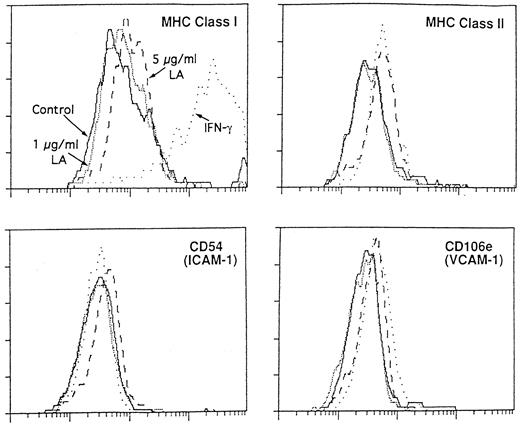
Figure 6 indicates the staining pattern of MS-5 cells, which were pre-incubated with linolenic acid and then stained with anti-MHC class I and II antibodies as well as adhesion molecule antibodies. It is well known that IFNγ stimulates the expression of MHC class I antigen. The increase in MHC class I expression was observed in the pre-incubation with linolenic acid (particularly a high concentration of 5 μg/mL) although the intensity was weak in comparison with IFNγ. The expression of MHC class II antigen and adhesion molecules (CD54 and CD106e) was also enhanced slightly at the concentration of 5 μg/mL. A similar enhancement was observed when oleic acid was pre-incubated with MS-5 (data not shown). No increase in the expression of CD44 molecules, however, was observed, even if MS-5 had been pre-incubated with oleic acid or linolenic acid at the concentration of 5 μg/mL (data not shown). When butyric acid was incubated with MS-5, no increase in the expression of the five antigens was observed (data not shown); this is comparable with the finding in Table 3.
Stimulatory Effect of Linolenic Acid on Proliferation of P-HSCs in Long-Term Culture
| . | Per Flask . | |
|---|---|---|
| . | No. of Cobblestone Colonies . | No. of Non-Ad. Cells (×104) . |
| Control | 4.3 ± 0.9 | 1.7 ± 0.2 |
| Pre-incubation | ||
| 1 μg/mL | 33.7 ± 5.26-150 | 9.4 ± 1.46-150 |
| 5 μg/mL | 49.3 ± 9.36-150 | 12.2 ± 2.16-150 |
| Co-culture | ||
| 1 μg/mL | 43.7 ± 5.86-150 | 12.1 ± 1.56-150 |
| 5 μg/mL | 6.3 ± 2.86-151 | 1.7 ± 0.26-151 |
MS-5 were pre-incubated with linolenic acid (1 or 5 μg/mL) for 1 day and washed two times. P-HSC were cultured on the MS-5 and the culture medium was replaced weekly with fresh medium. Six weeks later, the numbers of cobblestone colonies and nonadherent cells per flask were counted. Mean ± SE.
Different from control (P < .05).
Not significant.
Cobblestone colonies of P-HSCs cultured with nontreated MS-5 (left) or MS-5 pre-incubated with 5 μg/mL of linolenic acid (right) for 6 weeks.
Cobblestone colonies of P-HSCs cultured with nontreated MS-5 (left) or MS-5 pre-incubated with 5 μg/mL of linolenic acid (right) for 6 weeks.
When oleic acid, linolenic acid, or a mixture of both was added to the stromal cell line at concentrations of 0.05 to 10 μg/mL, these fatty acids did not show any stimulatory effect on the proliferation of MS-5 cells (data not shown). A similar observation was also obtained when a hybridoma producing antibody was cultured with these fatty acids at doses of 0.01 to 5 μg/mL (data not shown). Moreover, the fatty acids could not stimulate the proliferation of P-HSCs in the absence of stromal cells (data not shown).
These observations indicate that the fatty acids in TJ-48 act directly on the MS-5 cells, resulting in the proliferation of P-HSCs.
Effect of linolenic acid on long-term culture of P-HSCs.The effects of linolenic acid on long-term culture were examined. When the P-HSCs were cultured for 6 weeks on the MS-5, which had been pre-incubated with 1 or 5 μg/mL of linolenic acid, the numbers of cobblestone colonies and nonadherent cells per flask significantly increased (Table 6). Figure 7 shows a photograph of a cobblestone colony. Similar findings were obtained when P-HSCs and MS-5 were co-cultured with 1 μg/mL of linolenic acid. A high concentration (5 μg/mL) of linolenic acid, however, did not show any stimulatory effect.
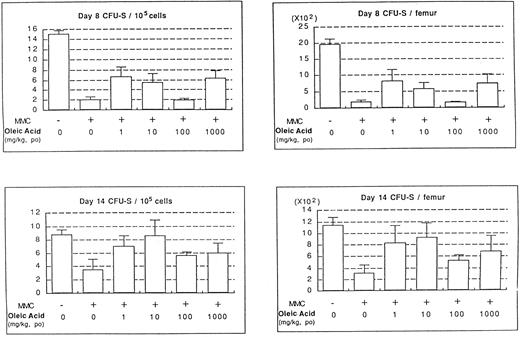
In vivo effects of oleic acid on the recovery of hematopoiesis in MMC-treated mice.The final step was to confirm the effects of fatty acids on the stimulation of HSCs in vivo. CFU-S counts were assessed using MMC-treated mice administered various doses of oleic acid. The experimental protocol is shown in Fig 8. The administration of MMC significantly decreased day 8 and day 14 CFU-S counts (Fig 9). An increase in CFU-S counts, however, was observed when oleic acid was administered to the mice at concentrations of 1 to 1,000 mg/kg. The most significant effect was observed at a dose of 1 mg/kg on day 8 and 10 mg/kg on day 14. Similar (but slightly lower) stimulation was also observed in mice administered linolenic acid (data not shown).
Experimental protocol of oleic acid administration into MMC-treated mice. Various concentrations of fatty acids were given orally to MMC-treated mice for 3 weeks and their bone marrow cells were then injected into a syngeneic recipient. The number of spleen colonies was counted 8 or 14 days later.
Experimental protocol of oleic acid administration into MMC-treated mice. Various concentrations of fatty acids were given orally to MMC-treated mice for 3 weeks and their bone marrow cells were then injected into a syngeneic recipient. The number of spleen colonies was counted 8 or 14 days later.
Effect of oleic acid on CFU-S recovery after MMC injection. The data represent mean ± SD of four mice.
Effect of oleic acid on CFU-S recovery after MMC injection. The data represent mean ± SD of four mice.
DISCUSSION
It has been reported that TJ-48 shows a range of immunologic activities in addition to stimulating hematopoiesis. They include the induction of IFN-γ12 and TNF13 in mice, mitogenic activity for spleen cells, and anticomplementary activity using sensitized erythrocytes.9 In this report, we have focused on its stimulatory activity for HSCs and have identified the active substances using both a GM-CFC assay and an HSC proliferation assay. It has been shown that P-HSCs generate multilineage colonies on bone marrow stromal feeder layer, but not in methylcellulose supplemented with various combinations of early- to late-stage-acting cytokines.14,15 These findings indicate that the direct interaction of P-HSCs with stromal cells is essential to the proliferation of P-HSCs. We have therefore established an HSC proliferation assay system using stromal cells or a cell line (MS-5). In the present study, we have demonstrated, using this assay and also long-term culture of P-HSCs, that two fatty acids (oleic acid and linolenic acid) are potent substances promoting the proliferation of P-HSCs. It is well known that oleic acid is an unsaturated fatty acid commonly found in both animals and plants, and that linolenic acid is an essential fatty acid that animals cannot biosynthesize: oleic acid appears to be an essential substance for cell growth, since it is added to the culture medium at a concentration of 5.6 μg/mL together with dipalmitoyl lecithin and cholesterol as a substitute for FCS. Recently, Inaoka et al have isolated the fatty acids (palmitic acid, stearic acid, oleic acid, linolenic acid, and eicosanoic acid) from Vitex rotundifolia L. fil; these fatty acids stimulate hair regrowth.16 This suggests that the fatty acids (at least oleic acid) are common cell growth factors. In the present study, oleic acid and linolenic acid did not, however, appear to have a significant stimulatory effect on MS-5 and hybridoma cells (data not shown), whereas stimulation indices over 4.0 were obtained when highly purified P-HSCs were cocultured with stromal cells in the presence of these fatty acids (Table 4). Accordingly, it seems that these fatty acids are essential for the proliferation and/or differentiation of P-HSCs. In the present study, we have used P-HSCs purified by the method described previously.11 We have very recently established a method for further purifying P-HSCs (Lin−/CD71−/class Ihigh/c-kit<low).17 Using these further purified P-HSCs, we have confirmed that oleic acid enhances the proliferation of P-HSCs in the presence of stromal cells (data not shown). To our knowledge, this is the first report indicating that oleic acid and linolenic acid have HSC-stimulatory activity.
We have also found that C18 and C22 fatty acids, such as elaidic acid and behenic acid (in addition to oleic acid and linolenic acid), can also stimulate the proliferation of HSCs. The chemical structure of elaidic acid resembles that of oleic acid: they are cis or trans form, respectively (Fig 4). Further studies are required to clarify the relationship between their chemical structure and biological activity. Oleic acid and linolenic acid seem to be compounds commonly found in various Japanese herbal prescriptions; both are found in Ninjin-you-ei-to (TJ-108) and Shou-seiryu-to (TJ-19), although they contain oleic acid and linolenic acid in different amounts from TJ-48 (data not shown). The former has been reported to stimulate hematopoiesis, but the latter not. Indeed, we have found that the TJ-108 extracts had a similar stimulatory effect on HSCs as TJ-48, whereas TJ-19 had no effect (data not shown). It is therefore conceivable that the combinations and contents of fatty acids in prescriptions are important for their efficacy.
It is known that stearic acid is metabolized in the body and is converted to oleic acid. Accordingly, it is likely that the metabolism has a definite effect on the efficacy of herbal medicines.
Although it is not yet clear exactly how these fatty acids induce the proliferation of HSCs, it seems likely that the signal for HSC proliferation is mediated by stromal cells stimulated by the fatty acids, since the pre-incubation of MS-5 cells with oleic acid and linolenic acid resulted in the proliferation of HSCs (Table 5). In addition, incubation of MS-5 with oleic acid and linolenic acid increased the expression of adhesion molecules (CD54 and CD106e) and MHC class I as well as II antigens on the stromal cells. One of a number of other possible mechanisms might give rise to the signal for HSC proliferation. For example, linolenic acid stimulates the production of early-acting cytokines from MS-5 cells. Moreover, it is conceivable that this acid is used for the biosynthesis of glycolipids and/or phospholipids, which are important for cell growth.
We have recently experienced a unique case of Shwachman's syndrome.18 The patient showed diarrhea due to pancreatic insufficiency, and neutropenia and anemia due to bone marrow hypoplasia. The patient was administered TJ-48 (2.5 g/d) orally, after which she recovered from the neutropenia and anemia (U. Kohdera et al, manuscript in preparation). This case may give us important clues to the relationship between fatty acids and hematopoiesis.
Experiments to assess the exact mechanism by which these fatty acids stimulate the proliferation of P-HSCs are now in progress. Data presented here might provide new insights into the mechanism of HSC proliferation.
ACKNOWLEDGMENT
We thank F. Ishida for conducting FACS sorting, and K. Ando for manuscript preparation.
Supported by research funds from the “Traditional Oriental Medical Science Program” of the Public Health Bureau of the Tokyo Metropolitan Government.
Address reprint requests to Susumu Ikehara, MD, PhD, 1st Department of Pathology, Kansai Medical University, 10-15 Fumizono-cho, Moriguchi City, Osaka 570, Japan.


This feature is available to Subscribers Only
Sign In or Create an Account Close Modal