Abstract
We have previously reported that intracellular tumor necrosis factor (enTNF ) is responsible for resistance, in established cell lines to doxorubicin (DOX), exogenous TNF, and heat stress by inducing manganous superoxide dismutase (MnSOD), thereby scavenging reactive oxygen free radicals. Leukemic cells from 19 patients (6 acute lymphoblastic leukemia, 13 acute myeloid leukemia) were examined for their sensitivity to DOX and TNF in relation to their enTNF expression and MnSOD activity. Sensitivity to DOX and the expression of enTNF or MnSOD activity were inversely correlated. In a case with acquired resistance to chemotherapy which included DOX, enTNF expression and MnSOD activity were increased. Furthermore, in 14 cases treated with a regimen including an anthracycline, 4 cases that failed to respond to chemotherapy showed relatively high amounts of enTNF expression. KG-1 (human acute myelogenous leukemia) cells transfected with a nonsecretory-type TNF expression vector (pTNFΔpro) showed resistance to DOX. A significant increase in MnSOD levels was also noted in the transfectants. TNF antisense cDNA was transfected into isolated leukemic cells from five patients. Sensitivity of the antisense transfectants to DOX was increased, approximately 1.4- to 2.5-fold. These results suggest that enTNF acts as a resistance factor against DOX in leukemia, and that enTNF may be useful as a predictor of DOX sensitivity in leukemia.
DOXORUBICIN (DOX) has been widely used to treat hematologic malignancies and solid tumors.
Unfortunately, the clinical effectiveness of DOX is often limited by drug resistance. Resistance can be present either at the time of diagnosis, or it can develop during the progressing stages of the disease. An important matter in the search for better therapeutic regimen for these patients is the development of methods to detect, quantify, and, if possible, overcome DOX resistance.
Energy-dependent, rapid drug efflux has been shown to be a major factor in the in vitro resistance of several cell lines to DOX.1,2 However, several recent studies have shown that DOX retention does not always correlate with its cytotoxicity,3 4 suggesting that the cellular resistance of these cells to DOX may be multifactorial. The mechanisms responsible for the DOX resistance is still surrounded by considerable controversy.
We have previously reported that intracellular tumor necrosis factor (enTNF ) is responsible for resistance, in established cell lines to anticancer drugs (DOX),5 exogenous TNF,6-8 and heat stress9 by inducing manganous superoxide dismutase (MnSOD), thereby scavenging reactive oxygen free radicals.10-12 However, in leukemic cells obtained freshly from patients, a relationship between enTNF and MnSOD activity and DOX sensitivity has not been clarified.
Therefore, in this study, we have examined the relationship between sensitivity to DOX and the expression of enTNF in tumor cells isolated from 19 acute leukemic patients and in KG-1 cells transfected with a nonsecretory-type TNF expression vector. We have also examined whether enTNF expression before chemotherapy correlates with the therapeutic efficacy of anthracyclins. To investigate further, we have reversed DOX resistance by retroviral transfection of TNF antisense cDNA into leukemic cells obtained from patients.
MATERIALS AND METHODS
Patients.Leukemic cells were obtained freshly from the bone marrow (BM) or peripheral blood (PB) of 19 patients with acute leukemia. The characteristics of patients are provided in Table 1. Cases include 6 ALL patients and 13 AML patients. Thirteen patients were studied at diagnosis and 6 patients were previously treated.
Patient Characteristics
| . | FAB Type . | Sex . | Age . | PB/BM . | % Blasts . | Response to Therapy . |
|---|---|---|---|---|---|---|
| 1 | ALL (L1) | F | 39 | PB | 58 | * CR |
| 2 | ALL (L1) | F | 19 | BM | 84 | * PR |
| 3 | ALL (L2) | M | 42 | BM | 40 | NR |
| 4 | ALL (L2) | M | 56 | BM | 38 | PR |
| 5 | ALL (L2) | M | 59 | PB | 80 | * CR |
| 6 | ALL (L2) | F | 68 | PB | 31 | * CR |
| 7 | AML (M1) | F | 45 | BM | 47 | * CR |
| 8 | AML (M1) | M | 45 | BM | 59 | * CR |
| 9 | AML (M1) | M | 56 | BM | 76 | * CR |
| 10 | AML (M1) | M | 54 | PB | 91 | * NR |
| 11 | AML (M1) | M | 52 | PB | 78 | * PR |
| 12 | AML (M2) | M | 38 | PB | 70 | NR |
| 13 | AML (M2) | M | 47 | BM | 71 | * CR |
| 14 | AML (M2) | M | 67 | BM | 48 | CR |
| 15 | AML (M2) | M | 75 | BM | 70 | * PR |
| 16 | AML (M2) | M | 58 | PB | 91 | * CR |
| 17 | AML (M2) | F | 21 | PB | 70 | * PR |
| 18 | AML (M3) | F | 41 | BM | 40 | * CR |
| 19 | AML (M3) | M | 69 | PB | 57 | * CR |
Abbreviations: CR, complete remission; PR, partial remission; NR no response.
First induction.
Isolation of leukemic cells.PB (30 to 50 mL) or BM (5 to 10 mL) was withdrawn, heparinized, and 6% dextran T500 (Pharmacia-Biotech, AB Uppsala, Sweden)-0.9% NaCl was added for sedimentation of red blood cells. The leukocyte-rich supernatant was aspirated, and layered on Ficoll-Isopaque (Pharmacia-Biotech). After density gradient centrifugation, the mononuclear cells (MNC) interface and bottom pellet were hemolyzed with lysis reagent (Ortho Diagnostic Systems, Tokyo, Japan), the total pellet was washed twice and adjusted to 2 × 10⁷ cells/mL with phosphate-buffered saline (PBS), and layered on top of a discontinuous Percoll (Pharmacia P-L Biochemicals, Milwaukee, WI) gradient as described earlier.13 The top layer contained 40% Percoll (density of 1.052), and in the underlying layers the concentration of Percoll was increased by 2.5%, with the bottom layer containing 50% Percoll. One milliliter of the cells from the interface of the Ficoll-Paque gradient centrifugation was then layered on the Percoll gradient, and centrifuged at 600g for 30 minutes. The bands of each interface were aspirated and washed twice with RPMI-1640 medium (GIBCO-BRL, Grand Island, NY), and cultured in a tissue culture flask (Nippon Becton Dickinson, Tokyo, Japan) for 18 hours at 37°C. Then, adherent cells were removed and free leukemic cells were cultured in a new flask in RPMI-1640 medium, supplemented with 20% fetal calf serum (FCS; Flow Laboratories, North-Ryde, Australia). Isolated samples from the proper layer of Percoll gradients contained more than 95% leukemic cells as determined by morphology.
Cytotoxic assay.Cells (5 × 10⁴/50 μL) were added to the wells of a 96-well microculture plate (Corning Coster, Tokyo, Japan) and incubated at 37°C for 18 hours in 5% CO2 . Next, 5 μmol/L DOX (Kyowa Hakko Kogyo, Tokyo, Japan) or 100 U/mL recombinant human TNF (ASAHI Chemical Industry, Tokyo, Japan) was added to each well and incubated at 37°C for 96 hours in 5% CO2 . Cytotoxic activity was assessed by the modified 3-(4,5-dimethyl-thiazol-2-yl)-2,5-diphenyl-tetrazolum bromide (MTT) assay.14-16
Assay for enTNF expression.Expression of enTNF was measured by an indirect second fluorescein isothiocyanate (FITC)-labeled antibody method, according to the modified method of Pitzurra et al.17 Briefly, cells (1 × 10⁶/3 mL) were added to the wells of a 6-well culture plate (Corning Coster) and incubated at 37°C for 18 hours in 5% CO2 . Cells were washed twice with PBS and placed in 1.5-mL Eppendorf tubes and then fixed with paraformaldehyde solution (4% vol/vol in PBS) for 20 minutes at room temperature. Triton solution (0.2% vol/vol in PBS) was added to permeabilize the cell membrane. For blocking, 1% goat-serum PBS was added to each tube for 30 minutes at 37°C. As a first antibody, appropriately diluted rabbit anti–recombinant human TNF polyclonal antibody (ASAHI Chemical Industry) was added to each tube. After a 1-hour incubation at room temperature, cells were washed with 1% bovine serum albumin (BSA; SEIKAGAKU, Tokyo, Japan)-PBS three times and then treated with appropriately diluted FITC-labeled anti-rabbit goat IgG (E.Y. Laboratories, San Mateo, CA) as a second antibody. Following an additional 30-minute incubation at room temperature, cells were washed three times with 1% BSA-PBS. Fluorescence intensity of the cells was measured in a Titertek Fluoroskan II (Flow Laboratories, Helsinki, Finland; excitation 485 nm, emission 538 nm). Relative fluorescence intensity (F.I.) was determined compared with the fluorescence intensity of KG-1 cells, which were purchased from the American Type Culture Collection (Rockville, MD). KG-1 cells were cultured in Iscove's modified Dulbecco's medium (IMDM; GIBCO-BRL) supplemented with 20% fetal bovine serum (FBS; Flow Laboratories).
Determination of MnSOD activity.MnSOD activity was assayed by the nitroblue tetrazolium method as described by Oberley and Spitz.18 Protein concentrations were determined by the Bio-Rad (Richmond, CA) DC Protein assay. MnSOD activity is expressed as units per milligram of protein.
Flow cytometric analysis of p-glycoprotein.Cells (1 × 10⁶/3 mL) were washed twice with PBS to remove FCS, and incubated with 0.5% horse serum (HS; Flow Laboratories)-PBS at 37°C for 30 minutes for blocking, then washed twice with PBS. Cells were then incubated with murine monoclonal antibody against P-170 glycoprotein (JSB-1; Nichirei, Tokyo, Japan)19 20 in 0.1% BSA-PBS at 4°C for 1 hour, and washed three times with 1% BSA-PBS followed by the addition of phycoerythrin (PE)-conjugated anti-mouse horse IgG (H+L, horse; Becton Dickinson, Franklin Lakes, NJ). Cells were washed twice with 1% BSA-PBS and analyzed by a FACScan flowcytometer (Becton Dickinson).
Reverse transcription-polymerase chain reaction (RT-PCR) for detection of mutidrug resistance associated protein (MRP).Total RNA was isolated by RNeasy (QIAGEN, Hilden, Germany), and 30 μg of total RNA was obtained from 5 × 10⁶ cells. RNA (2 μg) was reversely transcribed using SUPERSCRIPT II (GIBCO-BRL) and random hexanucleotide primers.21 After initial denaturation for 3 minutes at 94°C, 5 μL of cDNA was subjected to PCR for 30 cycles in a final volume of 50 μL using 200 U of Taq polymerase (TaKaRa, Kyoto, Japan). Each cycle consisted of 1 minute of denaturation at 94°C, 1 minute of reannealing at 55°C, and 2 minutes of synthesis at 72°C. MRP gene sequence was amplified using the following gene specified oligonucleotide primers: MRP foward primer, 5′-TCTCTCCCGACATGACCGAGG-3′; MRP reverse primer, 5′-CCAGGAATATGCCCCGACTTC-3′.
After PCR, aliquots (5 μL) were subjected to electrophoresis on 3% agarose gels, and bands were visualized by UV transillumination using ethidium bromide staining before photography.
Transfection of pTNFΔpro into KG-1 cells.Cotransfection of pTNFΔpro and pSV2neo or transfection of pSV2neo alone into KG-1 cells was performed by the methods described previously.7,8 22 Briefly, 1 × 10⁶ cells were added to each well of a 6-well culture plate in 3 mL of IMDM supplemented with 20% FBS and washed twice with 3 mL of Opti-MEM (GIBCO-BRL). The cells were cultured for 24 hours at 37°C after the addition of 100 μL of plasmid-lipofectin reagent (GIBCO-BRL).
A mixture containing 20 μg of pTNFΔpro and 1.5 μg of pSV2neo was added, and then the medium was changed to 3 mL of IMDM, supplemented with 20% FBS. After a 48-hour cultivation, G418 sulfate (GIBCO-BRL; 800 μg/mL) was added to each well and the cells were cultured for 12 days to select for G418-resistant cells. Resistant clones were then selected by the limiting dilution method. To analyze the mRNA expression of TNF, the RT-PCR method was used. Total RNA (2 μg) was isolated by RNeasy RNA isolation kit (QIAGEN), and RNA samples were subjected to RT using SUPERSCRIPT II to prepare complementary DNA. Prepared cDNA was stored at −70°C until PCR. After initial denaturation for 3 minutes at 94°C, 5 μL of cDNA was subjected to PCR for 40 cycles in a final volume of 50 μL using 200 U of Taq polymerase. Each cycle consisted of 1 minute at 94°C, 1 minute at 55°C, and 2 minutes at 72°C. GAPDH was used as a positive control. TNF and GAPDH gene sequences were amplified using the gene-specified oligonucleotide primers as described in earier reports.23 After PCR, 5-μL aliquots of the products were subjected to 1% agarose gel electrophoresis and stained with ethidium bromide before photograpy.
Retroviral transfection of leukemic cells from patients.Antisense TNF gene transfection was performed using the pRX retroviral vector system. The vector pRXhTNFanti was derived from pRXhCD25 (generously provided from H. Hamada, Laboratory of Molecular Biotherapy Cancer, Chemotherapy Center, Tokyo, Japan). The pRX vector was modified from MFG vector as described previously.24 The construction of pRX-hTNFanti with the antisense human TNF gene in the pRX vector is shown in Fig 1. At first, virus supernatant was transiently produced by transfection of plasmid pRXhTNFanti and pRXhCD25 into the amphotrophic retrovirus packaging cell line ψ-CRIP25 using the calcium phosphate method. ψ-CRIP was grown in culture to confluency in Dulbecco's modified Eagle's medium (DMEM; GIBCO-BRL) supplemented with 10% calf serum (CS; Flow Laboratories) after transfection of plasmid pRXhTNFanti and pRXhCD25. On the day of transfection of leukemic cells, 48-hour virus supernatant was collected and used following transfection. The transfection procedure was performed as briefly described below, according to the modified method as described earlier.26 One day before transfection, the cells obtained from leukemic patients (cases 2, 5, 6, 10, and 11) were adjusted to 1 × 10⁶ cells/mL. Cells were incubated for 6 hours on a 6-well nontissue culture–treated plate (Becton Dickinson) pretreated with human fibronectin (generously provided from TAKARA SHUZO Co, Ltd, Shiga, Japan)27 28 to increase transfection efficiency. Cells were infected with the virus supernatant of ψ-CRIP. After 2 hours, virus supernatant was replaced with fresh virus supernatant and cultured for an additional 22 hours. The infection protocol was repeated, nonadherent cells were decanted, and adherent leukemic cells were collected from the cultures using a cell dissociation buffer (CDB; GIBCO-BRL) according to the manufacturer's instructions. The adherent cells were added to the nonadherent fraction, and washed twice, resuspended in RPMI-1640 medium supplemented with 20% FCS, and used for the cytotoxicity assay.
Linear representation of recombinant retrovirus vector used for antisense TNF expression. pRXhTNFanti vector was derived from pRX. Antisense TNF is encoded by the subgenomic mRNA expressed from the upstream CMVIEΔLTR. CMVIE, cytomegalovirus immediate early enhancer; LTR, long terminal repeat; SD, splice donor; SA, splice acceptor.
Linear representation of recombinant retrovirus vector used for antisense TNF expression. pRXhTNFanti vector was derived from pRX. Antisense TNF is encoded by the subgenomic mRNA expressed from the upstream CMVIEΔLTR. CMVIE, cytomegalovirus immediate early enhancer; LTR, long terminal repeat; SD, splice donor; SA, splice acceptor.
RESULTS
Relationship between DOX sensitivity and intracellular resistance factors in leukemic cells obtained freshly from patients.The sensitivity of tumor cells isolated from 19 acute leukemic patients was assessed by exposing the cells to TNF (100 U/mL) or DOX (5 μmol/L) for 96 hours. Because enTNF exerts its cytoprotective role against exogenous TNF and DOX by inducing MnSOD,5 8 the constitutive MnSOD activity and the enTNF expression were measured on the same day in which leukemic cells were isolated. The sensitivity to TNF and DOX, MnSOD activity, and enTNF expression varied widely (Table 2). No significant relationships were found between enTNF expression and patients' sex, age, or French-American-British (FAB) classification. Table 3 summarizes each correlation coefficient and the relationship between sensitivity to DOX or TNF and intracellular resistance factors. Sensitivity to DOX and TNF was strongly correlated. DOX sensitivity and enTNF expression were inversely correlated. DOX sensitivity and MnSOD activity were also inversely correlated. TNF sensitivity and enTNF expression were inversely correlated and TNF sensitivity and MnSOD activity were also inversely correlated.
Sensitivity to TNF/DOX and Expression of Intracellular Resistance Factors in Leukemic Cells Obtained From Patients
| . | FAB Type . | Sensitivity (% Cytotoxicity) to* . | MnSOD Activity† . | enTNF Expression‡ . | |
|---|---|---|---|---|---|
| . | . | TNF . | DOX . | (U/mg protein) . | (relative F.I.) . |
| . | . | (100 U/mL) . | (5 μmol/L) . | . | . |
| 1 | ALL (L1) | 60.8 | 52.5 | NT | 1.2 |
| 2 | ALL (L1) | 21.5 | 36.9 | 11.67 ± 0.28 | 1.8 |
| 3 | ALL (L2) | 10.1 | 37.2 | 9.68 ± 2.54 | 2.6 |
| 4 | ALL (L2) | 61.5 | 40.3 | 7.24 ± 0.92 | 0.9 |
| 4′ | ALL (L2) | 12.5 | 18.4 | 11.80 ± 2.21 | 1.9 |
| 5 | ALL (L2) | 51.0 | 53.2 | 7.49 ± 0.54 | 0.6 |
| 6 | ALL (L2) | 50.8 | 58.7 | 9.17 ± 0.42 | 0.9 |
| 7 | AML (M1) | 0.1 | 26.9 | 12.01 ± 2.23 | 1.6 |
| 8 | AML (M1) | 19.3 | 28.5 | 10.66 ± 0.50 | 1.8 |
| 9 | AML (M1) | 1.3 | 1.7 | 8.07 ± 0.64 | 2.0 |
| 10 | AML (M1) | 7.4 | 29.1 | 10.56 ± 0.20 | 2.9 |
| 11 | AML (M1) | 25.1 | 42.9 | 9.15 ± 0.10 | 1.9 |
| 12 | AML (M2) | 3.8 | 24.2 | 11.36 ± 1.85 | 3.1 |
| 13 | AML (M2) | 65.2 | 61.7 | 4.48 ± 0.47 | 0.8 |
| 14 | AML (M2) | 27.5 | 33.4 | 7.63 ± 1.58 | NT |
| 15 | AML (M2) | 13.8 | 11.9 | 10.65 ± 0.16 | 1.3 |
| 16 | AML (M2) | 39.1 | 60.1 | 8.37 ± 0.73 | 0.5 |
| 17 | AML (M2) | 33.9 | 53.9 | 10.08 ± 0.58 | 0.9 |
| 18 | AML (M3) | 28.5 | 32.3 | 7.66 ± 1.27 | 2.1 |
| 19 | AML (M3) | 2.3 | 10.0 | 12.93 ± 1.23 | 3.7 |
Abbreviation: NT, not tested.
Cells (5 × 10⁴/50 μL) were cultured with DOX (5 μmol/L) or TNF (100 U/mL) for 96 hours and cytotoxic activity was determined by the MTT assay.
Cells (2 × 10⁶/mL) in 0.05 mmol/L potassium phosphate buffer, pH 7.8, were sonicated for 1 minute. The resulting solution was centrifuged at 3,000 rpm for 5 minutes to obtain cell lysates. MnSOD activities and protein concentrations of the cell lysates were determined by the nitroblue tetrazolium method and the Bio-Rad protein assay. Data presented are the mean ± SD of three separate experiments.
enTNF expression was determined by immunofluorescence assay as described in Materials and Methods. Values represent the normalized enTNF expression of leukemic cells compared with that of KG-1 cells.
Correlation Between Sensitivity to DOX/TNF and Expression of Resistant Factor
| Examined Items . | Correlation Coefficient . |
|---|---|
| DOX v TNF | .813842 |
| DOX v enTNF | −.675452 |
| DOX v MnSOD | −.533700 |
| TNF v enTNF | −.755415 |
| TNF v MnSOD | −.754985 |
| Examined Items . | Correlation Coefficient . |
|---|---|
| DOX v TNF | .813842 |
| DOX v enTNF | −.675452 |
| DOX v MnSOD | −.533700 |
| TNF v enTNF | −.755415 |
| TNF v MnSOD | −.754985 |
Correlation between DOX sensitivity and TNF sensitivity and the expression of intracellular resistance factors. Pearson's correlation coefficient is reported for various comparisons.
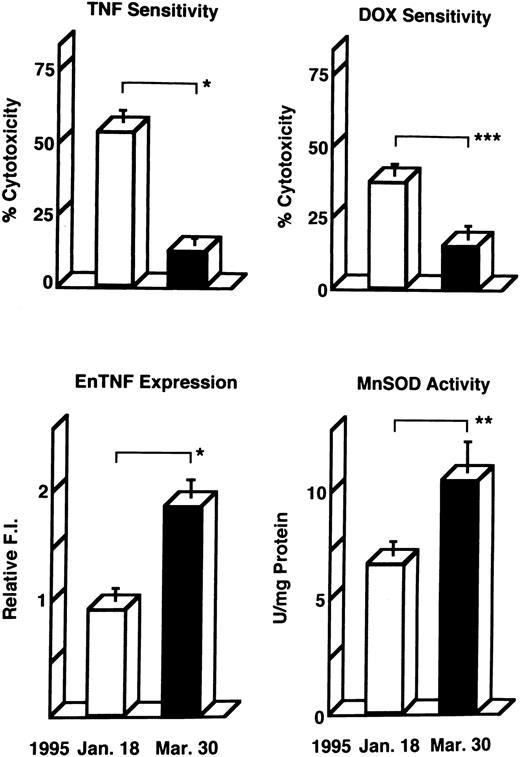
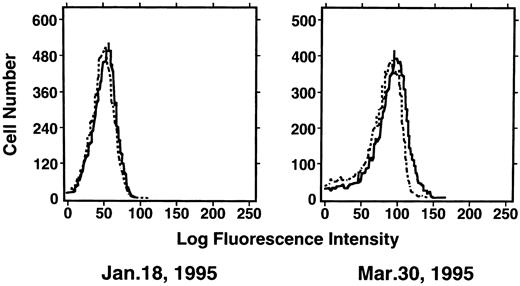
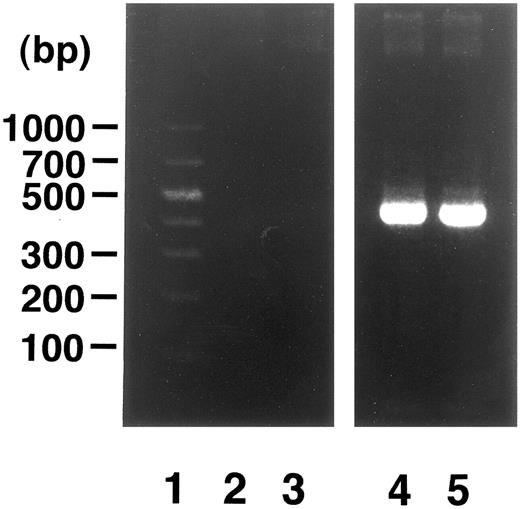
Induction of enTNF in a patient with acquired DOX resistance.We examined the endogenous TNF expression and MnSOD activity in a patient (case 4) who developed resistance to DOX after chemotherapy which included DOX. EnTNF expression obviously increased, with a twofold increase occurring between the pretreatment and posttreatment points, and MnSOD activity was also increased 1.6-fold (Fig 2). In the same case, the other generally known resistant factors to DOX, p-glycoprotein expression and MRP expression, were also examined. P-glycoprotein was present to a slight degree after chemotherapy (Fig 3). MRP was not detected at either point (Fig 4).
Changes in TNF/DOX sensitivity and intracellular resistant factors in a patient (case 4) who developed resistance to DOX. Leukemic cells were obtained at the pretreatment points (January 18, 1995) and posttreatment points (March 30, 1995) of chemotherapy with the regimen which includes DOX, and used for each assay as described in Materials and Methods. enTNF expression is represented as the relative value compared with that of KG-1 cells. The results shown are the mean (±SD) of three independent experiments. *P < .01; **P < .02; ***P < .05 by Student's t-test.
Changes in TNF/DOX sensitivity and intracellular resistant factors in a patient (case 4) who developed resistance to DOX. Leukemic cells were obtained at the pretreatment points (January 18, 1995) and posttreatment points (March 30, 1995) of chemotherapy with the regimen which includes DOX, and used for each assay as described in Materials and Methods. enTNF expression is represented as the relative value compared with that of KG-1 cells. The results shown are the mean (±SD) of three independent experiments. *P < .01; **P < .02; ***P < .05 by Student's t-test.
Expression of p-glycoprotein in case 4. Immunofluorescent flow cytometric analysis of p-glycoprotein on leukemic cells from the patient (case 4) was performed. Cells were stained with anti–p-glycoprotein monoclonal antibody JSB-1 ( — ) followed by PE-conjugated goat anti-mouse IgG as a secondary antibody. As a negative control (- - - - - - -), only secondary antibody was used.
Expression of p-glycoprotein in case 4. Immunofluorescent flow cytometric analysis of p-glycoprotein on leukemic cells from the patient (case 4) was performed. Cells were stained with anti–p-glycoprotein monoclonal antibody JSB-1 ( — ) followed by PE-conjugated goat anti-mouse IgG as a secondary antibody. As a negative control (- - - - - - -), only secondary antibody was used.
Analysis of MRP gene expression in case 4. DNA molecular size marker (lane 1); MRP gene expression in cells from time points indicated in Fig 2 (lanes 2 and 3); β-actin band in each point (lanes 4 and 5). RT-PCR was performed as described in Materials and Methods.
Analysis of MRP gene expression in case 4. DNA molecular size marker (lane 1); MRP gene expression in cells from time points indicated in Fig 2 (lanes 2 and 3); β-actin band in each point (lanes 4 and 5). RT-PCR was performed as described in Materials and Methods.
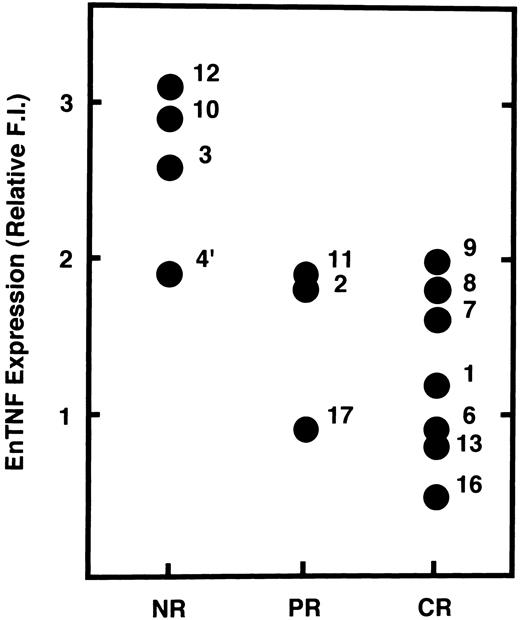
Relationship between enTNF expression and chemotherapeutic effects.We examined the possibility that enTNF expression is a predictor of therapeutic efficacy of chemotherapy which includes anthracyclins. In 14 cases treated with a regimen including an anthracycline (Fig 5), 4 cases that failed to respond to chemotherapy showed relatively high amounts of enTNF expression. In case 15, treated with cytosine arabinoside (Ara C) as a first regimen, relative enTNF expression was 1.3. In cases 18 and 19, with relatively high enTNF expression, complete remission was obtained because the FAB-subtype was AML-M3, and patients were treated with all-trans retinoic acid.
Correlation between enTNF expression and chemosensitivity. Values of enTNF expression for 14 cases treated with anthracyclins and treatment outcome are plotted. enTNF expression is represented as the relative value compared with that of KG-1 cells. NR, no response; PR, partial remission; CR, complete remission.
Correlation between enTNF expression and chemosensitivity. Values of enTNF expression for 14 cases treated with anthracyclins and treatment outcome are plotted. enTNF expression is represented as the relative value compared with that of KG-1 cells. NR, no response; PR, partial remission; CR, complete remission.
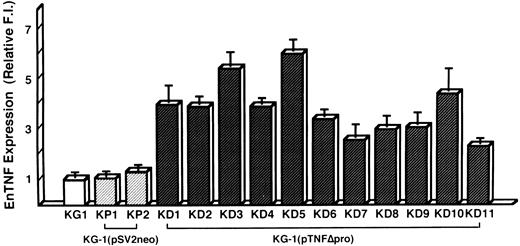
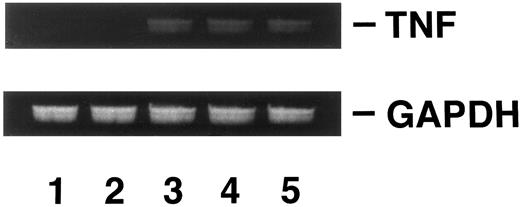
Induction of DOX resistance by transfection of pTNFΔpro into KG-1 cells.To clarify the relationship between DOX sensitivity and the expression of enTNF, KG-1 cells that are sensitive to DOX and TNF and have little enTNF expression, were transfected with a nonsecretory-type TNF expression vector, pTNFΔpro. The cotransfection of pTNFΔpro and pSV2neo was performed. Eleven stable transfectants (KD cells) were selected by using G418 sulfate, and there was a 2.1- to 6.0-fold increase in enTNF expression compared with parent cells and pSV2neo-only transfected clones (Fig 6). Of 11 G418-resistant clones, the cells from three isolated clones, KG-1 (pTNFΔpro) KD3, KG-1 (pTNFΔpro) KD5, and KG-1 (pTNFΔpro) KD10, were used for subsequent experiments. To verify the effect of TNF gene transduction, the expression of TNF mRNA was detected by gel-electrophoresis of the RT-PCR product (Fig 7). There was a significant increase in the expression of the TNF gene in clones transfected with nonsecretory-type TNF expression vector compared to parent cells and clones transfected with pSV2neo alone. MnSOD activity and the sensitivity of clones to DOX and TNF was assessed. In clones transfected with pTNFΔpro, high amounts of MnSOD activity were induced, and clones showed increased resistance to TNF and DOX compared with the parental KG-1 cells (Table 4).
enTNF expression in KG-1 cells, pSV2neo transfected clones, and pTNFΔpro transfected clones. enTNF expression is represented as the relative value compared with that of KG-1 cells. The data represent the mean (±SD) of three independent experiments. KP1 and KP2 cells were transfected with pSV2neo alone and KD1-KD11 cells were cotransfected with pTNFΔpro and pSV2neo.
enTNF expression in KG-1 cells, pSV2neo transfected clones, and pTNFΔpro transfected clones. enTNF expression is represented as the relative value compared with that of KG-1 cells. The data represent the mean (±SD) of three independent experiments. KP1 and KP2 cells were transfected with pSV2neo alone and KD1-KD11 cells were cotransfected with pTNFΔpro and pSV2neo.
Analysis of TNF gene expression. KG-1 cells (lane 1); KG-1 (pSV2neo) KP2 cells (lane 2); KG-1 (pTNFΔpro) KD3 cells (lane 3); KG-1 (pTNFΔpro) KD5 cells (lane 4); KG-1 (pTNFΔpro) KD10 cells (lane 5). RT-PCR was performed as described in Materials and Methods.
Analysis of TNF gene expression. KG-1 cells (lane 1); KG-1 (pSV2neo) KP2 cells (lane 2); KG-1 (pTNFΔpro) KD3 cells (lane 3); KG-1 (pTNFΔpro) KD5 cells (lane 4); KG-1 (pTNFΔpro) KD10 cells (lane 5). RT-PCR was performed as described in Materials and Methods.
Sensitivity to TNF and DOX in pTNFΔpro Transfected Clones
| Strain . | % Cytotoxicity to4-150 . | enTNF Expression4-151 . | MnSOD Activity‡ . | |
|---|---|---|---|---|
| . | TNF . | DOX . | (relative F.I.) . | (U/mg protein) . |
| . | (100 U/mL) . | (5 μmol/L) . | . | . |
| KG-1 | 36.4 | 53.6 | 1.00 | 10.90 |
| KG-1(pSV2neo) KP2 | 32.9 | 53.8 | 1.16 | 10.30 |
| KG-1(pTNFΔpro) KD3 | 10.0 | 27.3 | 5.50 | 24.50 |
| KG-1(pTNFΔpro) KD5 | 9.8 | 26.4 | 6.08 | 25.12 |
| KG-1(pTNFΔpro) KD10 | 10.2 | 28.1 | 4.38 | 21.40 |
Cells (5 × 10⁴/50 μL) were cultured with TNF (100 U/mL) and DOX (5 μmol/L) for 96 hours and cytotoxic activity was determined by the MTT assay.
enTNF expression was determined by immunofluorescence assay as described in Materials and Methods. Values are normalized enTNF expression of leukemic cells compared with that of KG-1 cells.
Cells (2 × 10⁶/mL) in 0.05 mol/L potassium phosphate buffer, pH 7.8, were sonicated for 1 minute. The resulting solution was centrifuged at 3,000 rpm for 5 minutes to obtain cell lysates. MnSOD activities and protein concentrations of the cell lysates were determined by the nitroblue tetrazolium method and Bio-Rad protein assay.
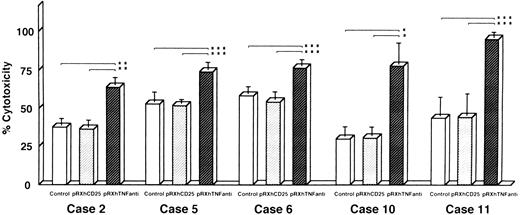
Reversal of DOX resistance by transfection of TNF antisense cDNA with retroviral vector system.We also investigated whether the resistance to DOX could be overcome by antisense TNF gene transfer designed to inhibit enTNF expression. Leukemic cells obtained freshly from five patients (cases 2, 5, 6, 10, and 11) were transfected with pRX-hTNFanti and pRXhCD25. The sensitivity to DOX of transient transfectants was significantly increased, with an approximate 1.4- to 2.5-fold increase compared to nontransfected cells and cells transfected with pRXhCD25 vector (Fig 8).
Reversal of DOX resistance by transfection of antisense TNF cDNA with retroviral vector pRXhTNFanti into leukemic cells. The leukemic cells obtained freshly from five patients were used (cases 2, 5, 6, 10, and 11) for the cytotoxic assay as described in Materials and Methods. The data represent the mean (±SD) of three independent experiments and statistical significance was determined by Student's t-test. *P < .01; **P < .02; ***P < .05.
Reversal of DOX resistance by transfection of antisense TNF cDNA with retroviral vector pRXhTNFanti into leukemic cells. The leukemic cells obtained freshly from five patients were used (cases 2, 5, 6, 10, and 11) for the cytotoxic assay as described in Materials and Methods. The data represent the mean (±SD) of three independent experiments and statistical significance was determined by Student's t-test. *P < .01; **P < .02; ***P < .05.
DISCUSSION
We have previously shown that enTNF promotes resistance to DOX,5 exogenous TNF,6-8 and heat stress9 in cultured cells by regulating enTNF expression with a gene transfer method by inducing MnSOD.12 However, it has not been shown that prediction of DOX sensitivities in tumor cells is possible by measurement of enTNF expression in clinical samples. In this study, we isolated tumor cells from acute leukemic patients and examined the sensitivity to DOX and TNF, enTNF expression, and MnSOD activity. The sensitivity to DOX or TNF and the expression of enTNF or MnSOD of leukemic cells were inversely correlated. This evidence indicates the possibility for the prediction of DOX sensitivity by the measurement of enTNF expression in leukemic cells. We also confirmed this relationship between DOX sensitivity and enTNF expression in KG-1 cells, which are sensitive to DOX and have little enTNF expression, by transfecting cells with nonsecretory-type TNF expression vector, resulting in high amounts of MnSOD activity and acquired DOX resistance. Furthermore, we examined the relationship between enTNF expression and therapeutic efficacy in patients treated with anthracyclins that evoke free oxygen radical formation29 30 in target tumor cells to exert antitumor activity. The cases with no response (NR) to the therapy had higher enTNF expression compared with patients in the responder group (PR and CR). This finding suggests that the therapeutic efficacy of anthracyclins may be predictable by measuring enTNF expression.
Based on in vitro experiments with cultured cells, some reports indicate that GSH or GST-π31-33 rather than MnSOD acts as a resistance factor to DOX cytotoxicity by scavenging oxygen free radicals. Some recent reports have discussed the relationship between the expression of GST-π or GSH and therapeutic efficacy. Tidefelt et al34 reported prediction of treatment results with anthracyclins by measuring GST-π in leukemic cells. However, Hall et al35 reported a similar study, and no correlation between the response to chemotherapy and the level of GST-π expression was found. Joncourt et al36 also reported that patient response to chemotherapy did not correlate with the values of GST-π, GSH, or GPx. It was then suggested that the induction of MnSOD by enTNF plays an important role as a resistance factor to anthracyclins in leukemia.
P-glycoprotein37 38 and MRP39,40 are also known resistance factors to DOX; however, there are some patients with resistance to chemotherapy whose cells do not express these factors. Fortunately, we had one case in which the clinical course of acquisition of DOX resistance could be followed, and changes in resistant factors could be examined pretherapy and posttherapy. In this patient, p-glycoprotein was present to a slight degree after chemothrapy. MRP was not detected at either point. In contrast, enTNF expression and MnSOD activity were elevated significantly. These results indicate that enTNF acts as a resistance factor that regulates DOX sensitivity and participates in both intrinsic resistance and acquired resistance in leukemia.
The exact mechanisms through which enTNF is induced and acquisition of DOX resistance occurs are unknown. We have found that the level of enTNF expression and MnSOD activity are high in DOX-resistant sublines that were created in vitro by step-wise increases in the concentration of DOX in the culture medium (data not shown). Recently, the levels of TNF mRNA and MnSOD mRNA were shown to be increased significantly in a DOX-resistant subline of human breast cancer, MCF-7 cells; however, the same subline showed no changes in MDR1 gene expression.41 We cannot explain the precise mechanism but these results prove that induction of DOX resistance is associated with an increase in the intracellular level of TNF.
Finally, we tried to overcome DOX resistance by inhibition of enTNF expression using transfection of antisense TNF cDNA in DOX-resistant cells obtained from five patients with leukemia. DOX sensitivity was significantly increased by 1.4- to 2.5-fold in the three cases by the transient transfection. There have been only two reports in the literature of gene transfer experiments designed to overcome DOX resistance by inhibiting intracellular resistant factors. One report showed an increase in sensitivity to DOX, cisplatin, melphalan, and etoposide of colon cancer cell line M7609 by transfection with GST-π antisense cDNA.42 Corrias and Tonini43 have shown a decrease in acquired resistance to DOX in a human DOX-resistant adenocarcinoma cell line using an antisense oligomer of the MDR1 gene. Because these data are limited to cultured cell lines, our study is the first report to show a reduction in DOX resistance mediated by transient transfection of leukemic cells obtained freshly from patients.
Supported by the Grants-in-Aid for Cancer Research from the Ministry of Education, Science, and Culture of Japan.
Address reprint requests to Naoki Watanabe, MD, PhD, Department of Laboratory Diagnosis, Sapporo Medical University, School of Medicine, South-1, West-16, Chuo-ku, Sapporo, Hokkaido 060, Japan.


This feature is available to Subscribers Only
Sign In or Create an Account Close Modal