Abstract
Plasma fibrinogen is a mixture of multiple molecular forms arising mainly through alternative mRNA processing and subsequent posttranslational modification. Recombinant fibrinogen is synthesized without alternative mRNA processing in a cultured cell system that may generate novel posttranslational modifications. Thus, to show that recombinant fibrinogen can serve as a functional model for plasma fibrinogen, we have examined the conversion of fibrinogen to fibrin, comparing the recombinant with the plasma protein. We examined the kinetics of (1) thrombin-catalyzed fibrinopeptide release, (2) thrombin-catalyzed polymerization of fibrinogen, (3) the polymerization of fibrin monomers, and (4) FXIIIa-catalyzed cross-link formation. We saw small differences in polymerization, suggesting that the ordered assembly of protofibrils and fibers was not identical. In all other analyses, we found that plasma fibrinogen and recombinant fibrinogen were remarkably similar. Using electron microscopy, we examined the structures of individual fibrinogen molecules and fibrin clots. Individual fibrinogen molecules were predominantly three nodule structures for both recombinant and plasma proteins. Both samples also displayed four nodule structures, but fewer four nodule structures were found with recombinant fibrinogen. Fibrin clot structures were essentially indistinguishable. We concluded that recombinant fibrinogen can serve as a accurate model for plasma fibrinogen.
FIBRINOGEN, A SOLUBLE plasma protein, contains six polypeptide chains, two each of the Aα, Bβ and γ chains, linked by 29 disulfide bonds. The amino termini of all chains are joined together in the middle of the fibrinogen molecule. The carboxyl termini of the Bβ and γ chains make up globular domains on either side of the molecule; they are connected with the center of the molecule via a three-chain α-helical coiled-coil.1 The carboxyl termini of the Aα chains comprise an additional nodule associated with the central region in fibrinogen.2-4 Fibrinogen participates in both the cellular phase and the fluid phase of coagulation. In the cellular phase, fibrinogen mediates platelet aggregation and fibrin supports clot retraction. In the fluid phase, fibrinogen is converted to fibrin in a reaction catalyzed by thrombin, which releases fibrinopeptides A (FpA) and B (FpB) from the amino-termini of the Aα and Bβ chains, respectively, and produces fibrin monomers. Fibrin monomers assemble into fibrin polymers in a spontaneous, ordered process where FpA release initiates protofibril formation and FpB release enhances lateral aggregation.4,5 Fibrin polymers are converted to insoluble fibers in a reaction catalyzed by FXIIIa, a transglutaminase that forms intermolecular amide bonds, crosslinking the fibrin monomers.6
The multiple roles of fibrinogen have been investigated using protein engineering to identify residues and domains that are critical to fibrinogen function.7-10 Engineered variant fibrinogens have provided models for the examination of residues thought to be critical for thrombin binding to fibrinogen9 and for fibrinogen-mediated platelet aggregation and clot retraction.7,10 The conclusions from these studies have been based on the assumption that normal recombinant fibrinogen is essentially identical to normal plasma fibrinogen. Although this assumption is reasonable, it ignores the well-known fact that normal plasma fibrinogen is a mixture of different molecular forms that arise from alternative mRNA processing and posttranslational modification.11 Because recombinant fibrinogen is synthesized from the common cDNAs, it does not contain the minor, alternative forms arising from alternative mRNA processing. Further, posttranslational modification of the recombinant protein may differ from that of plasma fibrinogen in a functionally significant manner. Thus, it was imperative that we carefully show that recombinant fibrinogen can serve as a functional model for plasma fibrinogen.
In the studies presented here, we compared plasma fibrinogen and recombinant fibrinogen, characterizing the steps that are critical for the conversion of fibrinogen to cross-linked fibrin. Plasma fibrinogen from a commercial source was purified by immunoaffinity chromatography. Recombinant fibrinogen was synthesized in Chinese hamster ovary (CHO) cells and purified from the culture medium by immunoaffinity chromatography. Clottability assays showed that both plasma and recombinant preparations had the same amount of functionally intact fibrinogen. We examined thrombin-catalyzed fibrinopeptide cleavage, thrombin-catalyzed fibrin polymerization, polymerization of fibrin monomers, and FXIIIa-catalyzed crosslinking. Using electron microscopy, we also examined the shape of fibrinogen molecules and the structures of fibrin clots.
MATERIALS AND METHODS
Materials.All chemicals were reagent grade and, unless specified, were purchased from Sigma (St Louis, MO). Human fibrinogen, plasminogen free, was from Calbiochem (San Diego, CA). Monoclonal antibody IF-1 was a generous gift from Dr Michio Matsuda (Institute of Hematology, Jichi Medical School, Tochigi-Ken, Japan). Human α-thrombin was a generous gift from Dr Frank Church (University of North Carolina at Chapel Hill, Chapel Hill, NC). Factor XIII was a generous gift from Dr Kevin Siebenlist (Sinai-Samaritan Medical Center, Milwaukee, WI).
Recombinant fibrinogen expression.Recombinant fibrinogen was synthesized in CHO cells and purified from pooled harvest of serum free medium as previously described.8 9 This fibrinogen has the normal, common Aα- Bβ- and γ-chains of human fibrinogen.
Purification of fibrinogen.Lyophilized plasma fibrinogen was dissolved in 50 mmol/L Tris-HCl, pH 8.0, 0.3 mol/L NaCl, and dialyzed at 4°C against 20 mmol/L HEPES, pH 7.4, 0.15 mol/L NaCl. The fibrinogen solution was centrifuged at 13,000 × g for 15 minutes (4°C), and the supernatant was stored in aliquots at −70°C. Fibrinogen was further purified on IF-1 monoclonal antibody (MoAb) conjugated Sepharose 4B column essentially as described.12 MoAb IF-1 (10 mg) was coupled to 6 mL cyanogen bromide (CNBr) activated Sepharose 4B (Pharmacia, Uppsala, Sweden). An aliquot of plasma fibrinogen was thawed, diluted to 0.5 mg/mL in 20 mmol/L Tris-HCl, pH 7.4, 0.3 mol/L NaCl, 1 mmol/L CaCl2, 5 mmol/L 6-amino-n-hexanoic acid (εACA), 1 μmol/L Pepstatin, 1 μmol/L Leupeptin, 100 μmol/L phenylmethylsulfonylfluoride (PMSF), 5 mmol/L benzamidine, and 10 U/mL soybean trypsin inhibitor. This cocktail of inhibitors was developed to prevent proteolysis during purification of recombinant fibrinogen, so we have included the same cocktail in the purification of plasma fibrinogen. The fibrinogen solution (15 mL) was loaded onto the IF-1 MoAb Sepharose column (1.6 × 3 cm) equilibrated with 20 mmol/L Tris-HCl, pH 7.4, 0.3 mol/L NaCl, 1 mmol/L CaCl2. The column was washed sequentially with 20 mmol/L Tris-HCl, pH 7.4, 1 mol/L NaCl, 1 mmol/L CaCl2 and 50 mmol/L sodium acetate, pH 6.0, 0.3 mol/L NaCl, 1 mmol/L CaCl2, 50 mL each. Fibrinogen was eluted with 20 mmol/L Tris-HCl, pH 7.4, 0.3 mol/L NaCl, 5 mmol/L EDTA, and dialyzed against 20 mmol/L HEPES, pH 7.4, 0.15 mol/L NaCl, 1 mmol/L CaCl2 at 4°C. The dialyzed sample was centrifuged at 13000 × g for 15 minutes (4°C), and the supernatant was stored in aliquots at −70°C.
Recombinant fibrinogen was purified as described9 with three modifications. First, the pH of media was adjusted to 5.6 with 2-(N-morpholino)ethanesulfonic acid (MES) buffer, pH 5.6, (final concentration, 20 mmol/L MES) before fibrinogen was precipitated with ammonium sulfate. Second, 10 U/mL soybean trypsin inhibitor replaced aprotinin in all buffers. Third, immunoaffinity chromatography replaced Protamine-Sepharose chromatography; recombinant fibrinogen was purified on IF-1 MoAb Sepharose, as described above for plasma fibrinogen.
Fibrinogen clottability.Clottability of the purified fibrinogens was determined as previously described,13 using human α-thrombin and 20 mmol/L HEPES pH 7.4, 0.15 mol/L NaCl, 5 mmol/L εACA, 1 mmol/L CaCl2. Clottability was 98% for plasma fibrinogen and 96% for recombinant fibrinogen.
Release of fibrinopeptides.Aliquots of purified fibrinogens were thawed at 37°C and dialyzed against 20 mmol/L HEPES, pH 7.4, 0.15 mol/L NaCl, 5 mmol/L εACA, 1 mmol/L CaCl2 at 4°C. Human α-thrombin was diluted to 0.1 U/mL with the same buffer immediately before the reaction and was kept on ice. Fibrinogen was diluted to 0.12 mg/mL concentration, assuming that ε280 15.06 for 10 mg/mL solution.14 The final concentrations of fibrinogen and thrombin in reaction were 0.1 mg/mL and 0.01 U/mL, respectively. The reactions were performed as described.9 Fibrinopeptides were detected by reversed-phase high-performance liquid chromatography (HPLC) on an ISCO chromatography system directed by ISCO Chemresearch 2.4 software (ISCO Inc, Lincoln, NE), using a C-18 column (4.6 × 250 mm; Vydak, Hesperia, CA) with an acetonitrile gradient as previously described.15 The quantity of fibrinopeptide was calculated from the areas under the HPLC peak, and the data were fit as previously described using the software ENZFITTER from Biosoft (Cambridge, UK).9 All experiments were performed three times.
Factor XIIIa catalyzed crosslinking of fibrin.Polymerization of fibrinogen (0.38 mg/mL) in the absence or presence of FXIII (0.5 μg/mL; 1.1 U/mL final concentration) was initiated with addition of human α-thrombin (1 U/mL final concentration). The reactions were run at room temperature in 20 mmol/L HEPES, pH 7.4, 150 mmol/L NaCl, 5 mmol/L εACA, 1 mmol/L CaCl2, and terminated at selected intervals by addition of sodium dodecyl sulfate (SDS) and 2-mercaptoethanol to 1% and 2% final concentration, respectively. The samples were analyzed by SDS-polyacrylamide gel electrophoresis (PAGE) on 10% gels. Controls labeled 0 minute were prepared by adding SDS and 2-mercaptoethanol to fibrinogen before thrombin and FXIII.
Fibrin monomer preparation.Fibrin monomer was prepared by clotting fibrinogen with thrombin as described16 with modifications. Fibrinogen was dialyzed against 20 mmol/L HEPES, pH 7.4, 0.15 mol/L NaCl, 5 mmol/L εACA at 4°C overnight and diluted to 0.3 mg/mL in the same buffer. Thrombin was diluted to 1.1 U/mL in the same buffer immediately before the reaction. Thrombin (40 μL) was added to 400 μL of fibrinogen on ice, vortexed gently, and incubated at 37°C. In 3 hours the clot was wrapped around a glass rod made from a 50-μL glass capillary with sealed ends. The clot was washed in 5 mL of 0.15 mol/L NaCl solution, 10 times, 5 minutes for every change. This is a critical step that removes buffer from the clot, thereby making it easier to dissolve fibrin in 40 μL of ice-cold, 0.125% acetic acid. The dissolved fibrin monomer was repolymerized by 10-fold dilution in 20 mmol/L HEPES, pH 7.4, 0.15 mol/L NaCl, 5 mmol/L εACA, incubated at ambient temperature for 3 hours, and dissolved in ice-cold 0.125% acetic acid. The repolymerization procedure was repeated twice. The resulting fibrin monomer solution was clarified by centrifugation (13,000g, 10 minutes, 4°C) and left at 4°C for 2 days to allow the fibrin polymers to completely dissociate. The fibrin monomer preparation was stored at 4°C and used within 1 month.
Polymerization turbidity curves.Polymerization of fibrinogen or fibrin monomer was measured by turbidity changes with time at 350 nm using a Shimadzu UV-260 spectrophotometer equipped with thermostatic cuvette holder (Shimadzu Corp, Tokyo, Japan). Fibrinogen (90 μL of 0.1 mg/mL), dialyzed against 20 mmol/L HEPES, pH 7.4, 0.15 mol/L NaCl, 5 mmol/L εACA, 0.1 mmol/L CaCl2, was placed in a 100-μL microcuvette with a 10-mm optical path (Starna Cells, Inc, Atascadero, CA). Thrombin (10 μL of 1 U/mL) was added at zero time, and the change of turbidity with time was recorded. Fibrin monomer (10 μL of 2 mg/mL, in 0.125% acetic acid) was added to 90 μL of 20 mmol/L HEPES, pH 7.4, 0.15 mol/L NaCl, 5 mmol/L εACA at zero time, and the change of turbidity was recorded. All polymerization experiments were performed at 25°C.
SDS-PAGE and Western blots.Reduced samples of fibrinogen were run on a 10% gels, and nonreduced samples were run on 6% gels, both according to Laemmli.17 Gels were stained with Coomassie Blue R-250, periodic acid-schiff stain for carbohydrate,18 or were electroblotted onto 0.45 μm nitrocellulose (BioRad, Hercules, CA). The blots were developed as described8 with either a rabbit polyclonal antiserum (Dako, Carpinteria, CA) to fibrinogen, and alkaline phosphatase conjugated goat antirabbit antiserum (Pierce, Rockford, IL) or with MoAbs specific for individual chains — Y1819 for the Aα chain, anti-β (15-21)20 for the Bβ chain, and 4A521 for the γ chain and alkaline phosphatase-conjugated goat antimouse antiserum.
Transmission and scanning electron microscopy.Rotary-shadowed samples were prepared by spraying a fibrinogen solution (30 μg/mL) in 0.05 mol/L ammonium formate, pH 7.4, and 25% glycerol onto freshly cleaved mica and shadowing with tungsten in a vacuum evaporator.1 3 Transmission electron microscopy was performed on a Philips-400 electron microscope (Philips Electronic Instruments Co, Mahwah, NJ) at 80 kV and magnification of 60,000×.
Fibrin samples for scanning electron microscopy were prepared in 20 mmol/L HEPES, pH 7.4, 0.15 mol/L NaCl, 5 mmol/L εACA in the following way: 180 μL of fibrinogen (0.55 mg/mL) was placed in small polyethylene tube sealed on one end with Parafilm. Then 20 μL of thrombin (5 U/mL) was added and mixed quickly to start polymerization. Final concentration of fibrinogen was 0.5 mg/mL and thrombin was 0.5 NIH U/mL. After 1 hour at room temperature, 0.6 mL of 2% glutaraldehyde was placed on the top of the formed clot. This solution was replaced with a fresh one three times during 1 hour. After the clot was fixed, the Parafilm was carefully removed followed by rinsing, dehydration, and critical-point drying.22 Clots formed by fibrin monomers were prepared in the same way with polymerization initiated by 10-fold dilution of fibrin-monomer solution (5 mg/mL) into 20 mmol/L HEPES, pH 7.4, 0.15 mol/L NaCl, 5 mmol/L εACA. Photographs of all clots were recorded digitally with a Philips XL20 scanning electron microscope at 10 kV and analyzed using the NIH Image program. The data were analyzed using the software StatView from ABACUS (Berkeley, CA) and reported with the standard deviation.
RESULTS
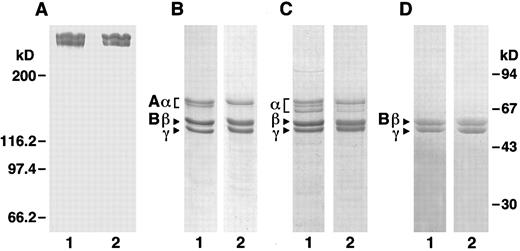
Characterization of recombinant human fibrinogen.To accurately compare recombinant fibrinogen with plasma fibrinogen, we further purified commercial plasma fibrinogen by immunoaffinity chromatography with the same protocol used for recombinant fibrinogen. SDS-PAGE analysis (Fig 1) showed that purified plasma fibrinogen was very similar to purified recombinant fibrinogen. Under nonreducing conditions (Fig 1A), both samples appear as two high molecular weight bands, comparable to the previously described high molecular weight (HMW) and low molecular weight (LMW) fibrinogens.23 It has been shown23 that these two proteins are complete, intact fibrinogen (HMW) and fibrinogen lacking a C-terminal fragment from the Aα-chain (LMW). Under reducing conditions (Fig 1B), both fibrinogen samples appear as three predominant bands that correspond to the Aα, Bβ, and γ chains of fibrinogen. Both samples also show a minor band, which as described below, is a smaller Aα chain species, although the recombinant protein has less of this higher mobility species. When gels run under reducing conditions were stained for carbohydrate (Fig 1D), both fibrinogen samples appeared as two bands that align with the Bβ and γ chains. Thus, the chains in recombinant fibrinogen that were modified with carbohydrate have the same molecular weight as those known to be modified in plasma fibrinogen. We also examined fibrin monomers prepared from plasma and recombinant fibrinogens (Fig 1C) and found that the fibrin samples show comparable changes indicative of fibrinopeptide loss.
SDS-PAGE. Plasma and recombinant fibrinogens were analyzed under nonreducing (6% polyacrylamide gel, A) and reducing (10% polyacrylamide gel, B through D) conditions. A through C were stained with Coomassie blue; D was stained with Schiff reagent. Panels A, B, and D are fibrinogen; C is fibrin; lane 1 samples are plasma protein and lane 2 samples are recombinant protein. Molecular weight markers for the nonreduced gel is indicated at the left and for the reduced gels at the right.
SDS-PAGE. Plasma and recombinant fibrinogens were analyzed under nonreducing (6% polyacrylamide gel, A) and reducing (10% polyacrylamide gel, B through D) conditions. A through C were stained with Coomassie blue; D was stained with Schiff reagent. Panels A, B, and D are fibrinogen; C is fibrin; lane 1 samples are plasma protein and lane 2 samples are recombinant protein. Molecular weight markers for the nonreduced gel is indicated at the left and for the reduced gels at the right.
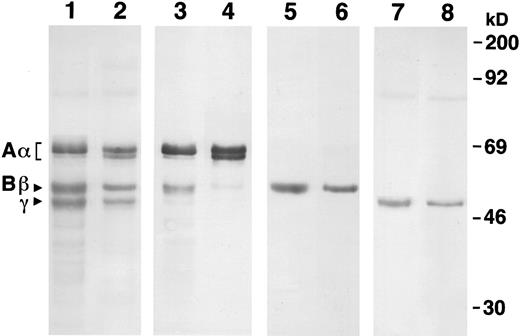
We confirmed the identity of these bands by Western blot analysis, as shown in Fig 2. Using a polyclonal antiserum that reacts with all three chains (lanes 1 and 2), we confirmed the similarity of recombinant fibrinogen to plasma fibrinogen. Blots developed with a MoAb that is specific for the Aα chain (lanes 3 and 4) showed the heterogeneity of this chain in both plasma and recombinant fibrinogens. Three Aα chain bands were seen for each sample, but the proportion of each band differed. Recombinant fibrinogen had a dominant band at 67 kD, a secondary band at 55 kD, and a faint band at 64 kD. Plasma fibrinogen had a dominant band at 67 kD, a secondary band at 64 kD, and a faint band at 55 kD. Blots developed with MoAbs specific for the Bβ (lanes 5 and 6) and γ (lanes 7 and 8) chains showed the similar size and homogeneity of these chains in the recombinant and plasma fibrinogens.
Western blot analysis of recombinant and plasma fibrinogens. Samples were run on a 10% SDS gel under reduced conditions. Lanes 1, 3, 5, and 7 were recombinant fibrinogen and 2, 4, 6, and 8 were plasma fibrinogen. The primary antibody for lanes 1 and 2 was a polyclonal antiserum raised against human fibrinogen (Dako), for lanes 3 and 4, a monoclonal antiserum that is specific for the N-terminus of the Aα chain,19 for lanes 5 and 6, a monoclonal antiserum specific for the N-terminus of the Bβ chain,20 and for lanes 7 and 8, a monoclonal antiserum specific for the C-terminus of the γ chain.21 Molecular weight markers are indicated at the right.
Western blot analysis of recombinant and plasma fibrinogens. Samples were run on a 10% SDS gel under reduced conditions. Lanes 1, 3, 5, and 7 were recombinant fibrinogen and 2, 4, 6, and 8 were plasma fibrinogen. The primary antibody for lanes 1 and 2 was a polyclonal antiserum raised against human fibrinogen (Dako), for lanes 3 and 4, a monoclonal antiserum that is specific for the N-terminus of the Aα chain,19 for lanes 5 and 6, a monoclonal antiserum specific for the N-terminus of the Bβ chain,20 and for lanes 7 and 8, a monoclonal antiserum specific for the C-terminus of the γ chain.21 Molecular weight markers are indicated at the right.
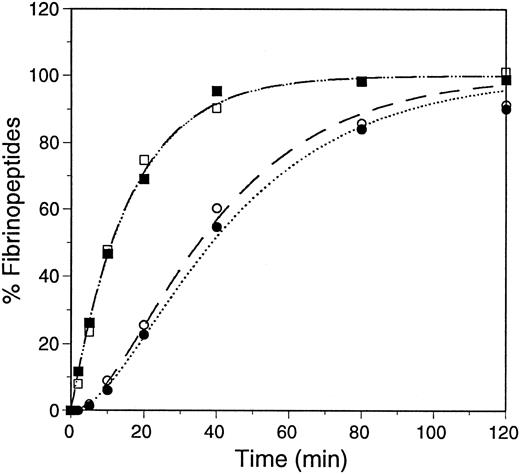
Thrombin-catalyzed release of fibrinopeptides.The thrombin-catalyzed release of FpA and FpB was followed by HPLC, as previously described.9,15 The samples contained 0.1 mg/mL fibrinogen (0.3 μmol/L) and 0.01 U/mL (0.1 nmol/L) of human α-thrombin in 20 mmol/L HEPES, pH 7.4, 0.15 mol/L NaCl, 5 mmol/L εACA, and 1 mmol/L CaCl2. The reactions were performed at ambient temperature and the released fibrinopeptides were separated by reversed-phase HPLC. The data were plotted as percent fibrinopeptide release and were fitted to progress curves assuming the reactions are first order, as previously described.9 24 The average curves are shown in Fig 3, and the kinetic analyses are summarized in Table 1. These data showed that the rate of fibrinopeptide release from recombinant fibrinogen was essentially the same as from plasma fibrinogen.
Progress curves of fibrinopeptide release. Thrombin-catalyzed release of fibrinopeptides from plasma fibrinogen, dashed lines, FpA (□) and FpB (○); and recombinant fibrinogen, dotted line, FpA (▪) and FpB (•), was monitored by HPLC. The data were fitted to first-order rate equations, assuming FpA is released before FpB, as described.9 24
Progress curves of fibrinopeptide release. Thrombin-catalyzed release of fibrinopeptides from plasma fibrinogen, dashed lines, FpA (□) and FpB (○); and recombinant fibrinogen, dotted line, FpA (▪) and FpB (•), was monitored by HPLC. The data were fitted to first-order rate equations, assuming FpA is released before FpB, as described.9 24
First-Order Rate Constants for Fibrinopeptide Release
| . | Plasma Fibrinogen . | Recombinant Fibrinogen . |
|---|---|---|
| Experiment 1 | ||
| FpA | 0.059 ± 0.007 | 0.055 ± 0.004 |
| FpB | 0.042 ± 0.001 | 0.040 ± 0.003 |
| Experiment 2 | ||
| FpA | 0.065 ± 0.010 | 0.065 ± 0.003 |
| FpB | 0.037 ± 0.003 | 0.031 ± 0.002 |
| Experiment 3 | ||
| FpA | 0.063 ± 0.007 | 0.072 ± 0.004 |
| FpB | 0.029 ± 0.003 | 0.029 ± 0.001 |
| Average | ||
| FpA | 0.062 ± 0.008 | 0.064 ± 0.004 |
| FpB | 0.036 ± 0.002 | 0.033 ± 0.002 |
Thrombin-catalyzed fibrin polymerization.Polymerization was measured as the change in turbidity at 350 nm, as described.25 The reactions were performed at 25°C, using the same sample conditions as the fibrinopeptide release reaction, except for a reduction in CaCl2 to 0.1 mmol/L. Representative curves are shown in Fig 4. We characterized the curves by two quantitative measures–the lag period, which represents the time required for protofibril formation, and the maximum slope, which reflects the rate of assembly of protofibrils.25-27 The data are presented in Table 2. This analysis showed that, on average, the lag period was about 1.2-fold longer and the maximum slope was about 1.6-fold steeper for recombinant fibrinogen relative to plasma fibrinogen.
Polymerization of plasma and recombinant fibrinogens. Polymerization was initiated by the addition of thrombin at time 0 (0.1 U/mL) to recombinant (•) or plasma (▴) fibrinogen (0.09 mg/mL) and polymer formation was measured as change in turbidity at 350 nm with time.
Polymerization of plasma and recombinant fibrinogens. Polymerization was initiated by the addition of thrombin at time 0 (0.1 U/mL) to recombinant (•) or plasma (▴) fibrinogen (0.09 mg/mL) and polymer formation was measured as change in turbidity at 350 nm with time.
Polymerization Parameters
| . | Protein Concentration . | Experiment No. . | Lag-Period . | Maximum Rate (×10−5 sec−1) . |
|---|---|---|---|---|
| . | . | . | (sec) . | . |
| Plasma fibrinogen | 0.1 mg/mL | 1 | 135 | 25 |
| 0.1 mg/mL | 2 | 144 | 22 | |
| 0.1 mg/mL | 3 | 138 | 21 | |
| Average | 139 ± 4 | 23 ± 2 | ||
| Recombinant fibrinogen | 0.1 mg/mL | 1 | 150 | 41 |
| 0.1 mg/mL | 2 | 190 | 40 | |
| 0.1 mg/mL | 3 | 166 | 29 | |
| Average | 169 ± 16 | 37 ± 5 | ||
| Plasma fibrin monomer | 0.2 mg/mL | 1 | 180 | 118 |
| 0.2 mg/mL | 2 | 210 | 108 | |
| 0.2 mg/mL | 3 | 183 | 108 | |
| Average | 191 ± 13 | 111 ± 5 | ||
| Recombinant fibrin monomer | 0.2 mg/mL | 1 | 219 | 110 |
| 0.2 mg/mL | 2 | 234 | 97 | |
| 0.2 mg/mL | 3 | 250 | 120 | |
| Average | 234 ± 13 | 109 ± 10 |
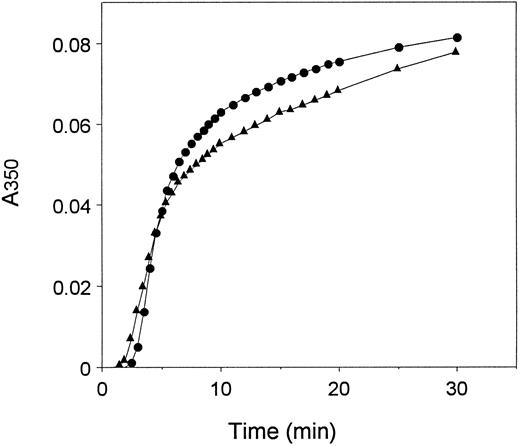
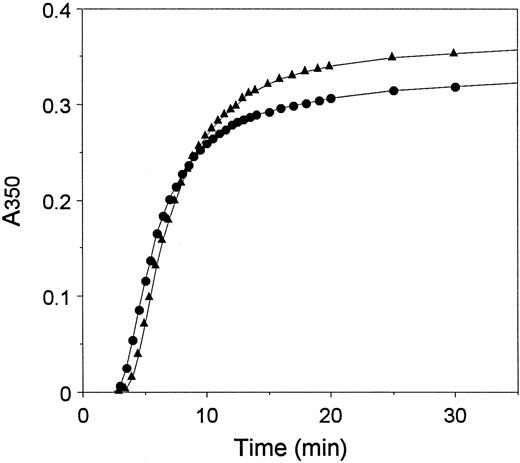
Polymerization of fibrin monomers.To circumvent the contribution of thrombin catalysis to polymerization,5 we examined polymerization of fibrin monomers prepared from each of these fibrinogens. Polymerization was initiated by diluting fibrin monomers dissolved in 0.125% acetic acid with buffer at neutral pH, and the changes in turbidity were monitored as for the thrombin-catalyzed reactions. Representative curves are shown in Fig 5, and the quantitative data are presented in Table 2. On average, we found that the lag period with recombinant fibrin monomer was 1.2-fold longer than with plasma fibrin monomer, and we found no difference between the maximum slopes observed with recombinant monomer and plasma monomer.
Polymerization of plasma and recombinant fibrin monomers. Fibrin monomers (2 mg/mL) prepared from plasma fibrinogen (•) and recombinant fibrinogen (▴) were diluted 10-fold into neutral buffer at time 0, and the change in turbidity monitored at 350 nm with time.
Polymerization of plasma and recombinant fibrin monomers. Fibrin monomers (2 mg/mL) prepared from plasma fibrinogen (•) and recombinant fibrinogen (▴) were diluted 10-fold into neutral buffer at time 0, and the change in turbidity monitored at 350 nm with time.
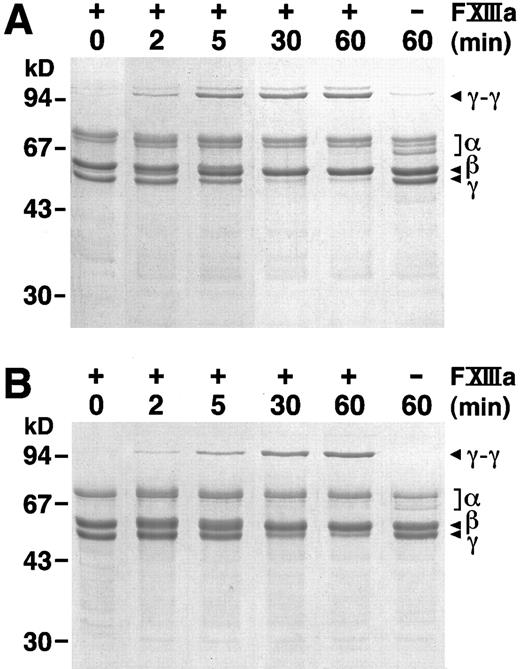
FXIIIa catalyzed crosslinking of fibrin.We followed FXIIIa catalyzed crosslink formation by SDS-PAGE under reducing conditions. Previous work has shown that γ chain dimers are the first products of FXIII transglutaminase activity.6 As shown in Fig 6, γ chain dimers were evident after 2 minutes in reactions with either plasma (Fig 6A) or recombinant (Fig 6B) fibrinogen. Furthermore, the accumulation of γ chain dimers and the loss of γ chain monomers followed similar patterns for these two proteins. In Fig 6A, very small amounts of γ chain dimers were also seen in the absence of added FXIII, as expected if the plasma fibrinogen was contaminated with plasma FXIII; these bands were not found with recombinant fibrinogen in the absence of added FXIII. We also noted that the products in Fig 6A appeared as a pair; the higher molecular weight product may contain the larger γ′ chain, which is present in plasma fibrinogen, but not in recombinant fibrinogen. The evident differences between Fig 6A and B are thus consistent with known characteristics of plasma fibrinogen, the presence of the γ′ chain and contamination with FXIII. We, therefore, concluded that the kinetics of crosslink formation and the nature of the crosslinked products were comparable for recombinant and plasma fibrinogens.
FXIIIa catalyzed γ dimer formation. At 0 time, thrombin (1 U/mL) was added to a mixture of FXIII (1 U/mL) and plasma (A) or recombinant (B) fibrinogen (0.38 mg/mL). Reactions were stopped at the indicated times by the addition of SDS and 2-mercaptoethanol and analyzed by SDS-PAGE on 10% gels. 0 minute controls were prepared by adding thrombin, FXIII and fibrinogen to the SDS and 2-mercaptoethanol buffer; 60-minute controls were as above, but without added FXIII.
FXIIIa catalyzed γ dimer formation. At 0 time, thrombin (1 U/mL) was added to a mixture of FXIII (1 U/mL) and plasma (A) or recombinant (B) fibrinogen (0.38 mg/mL). Reactions were stopped at the indicated times by the addition of SDS and 2-mercaptoethanol and analyzed by SDS-PAGE on 10% gels. 0 minute controls were prepared by adding thrombin, FXIII and fibrinogen to the SDS and 2-mercaptoethanol buffer; 60-minute controls were as above, but without added FXIII.
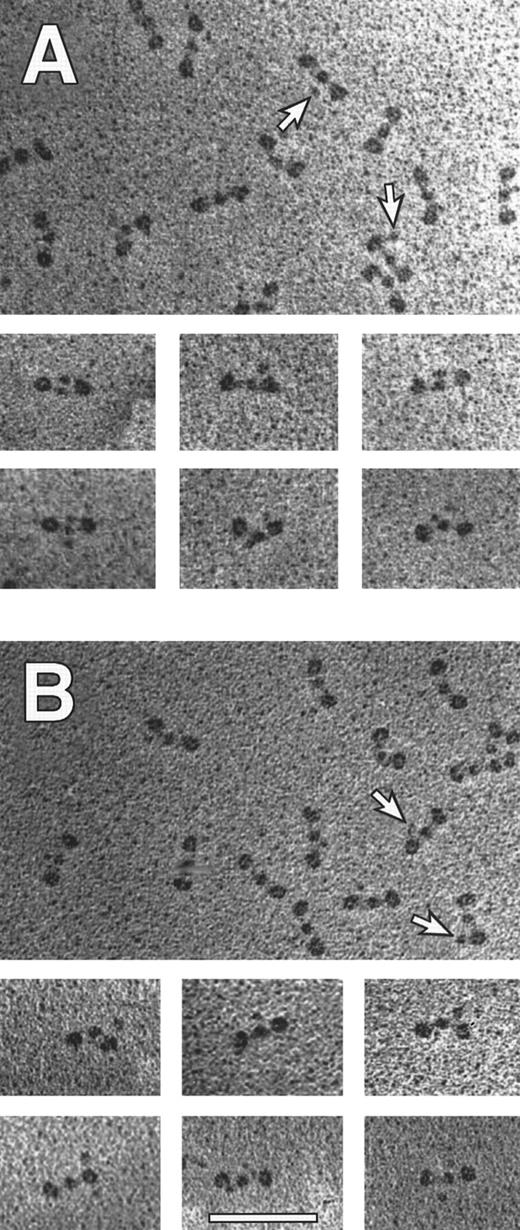
Electron microscopy of fibrinogen and fibrin clots.We examined individual fibrinogen molecules by electron microscopy of samples prepared by rotary shadowing.1,3 Trinodular molecules similar to those reported previously2,3 were seen in all preparations. The appearance of more than 450 molecules was analyzed with particular attention focused toward additional nodules, indicated by arrows, either near the central domain or near the lateral domains. Representative molecules are shown in Fig 7, and the quantitative data are presented in Table 3. Clearly, the overall shape of the molecules of the recombinant fibrinogen was essentially the same as of the plasma fibrinogen. The fraction of molecules containing a fourth nodule was reduced with recombinant fibrinogen. Because the fourth nodule is thought to be the C-terminal domain of the Aα chain,2 3 this result indicated a potential difference in the Aα chain structures of plasma and recombinant fibrinogen.
Transmission electron microscopy of individual fibrinogen molecules. Recombinant fibrinogen is shown in (A) and plasma fibrinogen is shown in (B). The arrows indicate a fourth nodule (made up by the C termini of Aα chains), present on some molecules within a representative field. The smaller panels contain molecules selected to illustrate the various structures with four nodules. All pictures are at the same magnification (60,000×) and the bar in (B) indicates 100 nm.
Transmission electron microscopy of individual fibrinogen molecules. Recombinant fibrinogen is shown in (A) and plasma fibrinogen is shown in (B). The arrows indicate a fourth nodule (made up by the C termini of Aα chains), present on some molecules within a representative field. The smaller panels contain molecules selected to illustrate the various structures with four nodules. All pictures are at the same magnification (60,000×) and the bar in (B) indicates 100 nm.
Shapes of Individual Molecules Observed for Plasma and Recombinant Fibrinogen
| Sample . | No. Molecules Examined . | Percentage of Molecules With the Appearance . | ||
|---|---|---|---|---|
| . | . | • — • — • . | ♦ . | ♦ ♦ . |
| . | . | . | • — • — • . | • — • — • . |
| Plasma fibrinogen | 559 | 63 | 22 | 15 |
| Recombinant fibrinogen | 457 | 77 | 15 | 8 |
| Sample . | No. Molecules Examined . | Percentage of Molecules With the Appearance . | ||
|---|---|---|---|---|
| . | . | • — • — • . | ♦ . | ♦ ♦ . |
| . | . | . | • — • — • . | • — • — • . |
| Plasma fibrinogen | 559 | 63 | 22 | 15 |
| Recombinant fibrinogen | 457 | 77 | 15 | 8 |
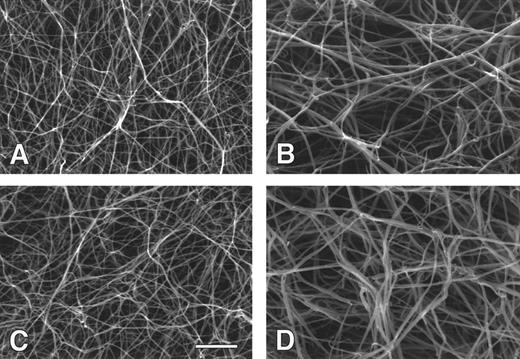
We also examined clot structure by scanning electron microscopy. The appearance of clots prepared from recombinant and plasma fibrinogens, and their respective fibrin monomers, were very similar (Fig 8). Clots prepared from plasma fibrinogen and recombinant fibrinogen (Fig 8A and C) both showed extensively branched fiber networks. As has been previously seen,5 the degree of lateral aggregation and the pore size were significantly greater for clots prepared from fibrin monomers (Fig 8C and D ) versus those prepared by thrombin activation of fibrinogen (Fig 8A and B). This was true for both recombinant and plasma fibrinogens. The diameters of several hundred fibers were measured from micrographs of clots formed from plasma fibrinogen and recombinant fibrinogen. The mean diameter for plasma fibrinogen fibers was 91 ± 15 nm and the mean diameter for recombinant fibrinogen fibers was 84 ± 13 nm. For clots prepared from fibrin monomers of plasma fibrinogen and recombinant fibrinogen, the mean diameters were 138 ± 25 nm and 132 ± 23 nm, respectively. Thus, there were no obvious differences when comparing clots formed from recombinant with plasma fibrinogen.
Scanning electron micrographs of fibrin clots. Fibrin clots were prepared from thrombin and recombinant (A) or plasma (C) fibrinogen, and from recombinant (B) or plasma (D) fibrin monomer. All pictures are at the same magnification and the bar in (C) indicates 2 μm.
Scanning electron micrographs of fibrin clots. Fibrin clots were prepared from thrombin and recombinant (A) or plasma (C) fibrinogen, and from recombinant (B) or plasma (D) fibrin monomer. All pictures are at the same magnification and the bar in (C) indicates 2 μm.
DISCUSSION
We initiated these studies to determine whether recombinant fibrinogen synthesized in mammalian cells is functionally similar to fibrinogen isolated from human plasma. This comparison is necessary to interpret other studies that examine the biochemical properties of variant recombinant fibrinogens. We examined the biochemical properties that are critical to the conversion of fibrinogen to fibrin. The data presented here showed that recombinant fibrinogen is remarkably similar to plasma fibrinogen. We also examined these fibrinogen molecules by electron microscopy and found no significant differences in overall molecular shape. We noted a decrease in the percentage of four nodule molecules in the recombinant protein, indicating that for some molecules, the nature of the C-terminus of the Aα chain in recombinant fibrinogen differed from this domain in plasma fibrinogen. As discussed below, the Aα chain-specific Western blot data also showed a difference in the C-terminus, an increased presence of the 55-kD species in recombinant fibrinogen relative to the plasma fibrinogen. Together these data suggest that recombinant fibrinogen used in this study has an increased representation of truncated Aα chains, relative to plasma fibrinogen. We note, however, that previous experience indicates that the representation of truncated Aα chains in plasma fibrinogen varies significantly, especially when comparing different commercial fibrinogen preparations (data not shown).
We found no difference in thrombin-catalyzed fibrinopeptide release, but did find differences in the lag period and maximal slope for the thrombin-catalyzed conversion of fibrinogen into fibrin polymers. The data in Fig 4 and Table 2 suggest that protofibril assembly was slower with recombinant fibrinogen, while lateral aggregation was faster. The functional significance of these differences would appear to be minimal because the structures of clots (Fig 8A and C) formed from these fibrinogens and thrombin are remarkably similar. That is, the observed differences in turbidity measurements were not reflected as differences in the clot structures. This contrasts with other cases. For example, in comparison to normal plasma fibrinogen, fibrinogen Dusart has both a markedly different clot structure and profoundly different turbidity measurements–a threefold increased lag time and a fivefold decreased slope.28 29 Thus, the quantitative differences measured by turbidity were relatively small and probably functionally insignificant. This conclusion is supported by the turbidity data obtained with fibrin monomers, as the maximum rate of polymerization with recombinant fibrin monomers was the same as that with plasma fibrin monomers. Moreover, the micrographs of clots formed from recombinant and plasma fibrin monomers were remarkably similar. Finally, the similarity of polymerization of recombinant and plasma fibrin is confirmed by the FXIIIa catalyzed crosslink formation, measured by SDS-PAGE, as γ dimers formed at similar rates for both proteins.
These data support the conclusion that the minor species in plasma fibrinogen that arise from alternative RNA processing do not contribute significantly to the characteristics we have measured. These minor species are the αE domain, a 40-kD addition at C-terminus of the α chain, and the γ′ domain, a 23-residue segment that replaces the four C-terminal residues of the common γ chain. The αE chain is present in about 2% of the total Aα chains,30 so any structural consequence of this domain would be difficult to establish. The electron microscopy (EM) data (Table 3) indicated a small quantitative difference when comparing micrographs of plasma fibrinogen with micrographs of recombinant fibrinogen. The reduced representation of the four nodule structures in the recombinant molecules suggests that αE containing molecules may be four nodule molecules. The numbers, however, lie within experimental error and therefore do not require that all the αE containing molecules have a four nodule structure. Furthermore, as described below, other interpretations are reasonable. The biochemical measurements that we characterized were not sufficiently precise to detect a functional consequence if the αE chain participates proportional to its stoichiometric representation. Nevertheless, we can conclude that the αE species neither markedly enhances nor markedly inhibits the conversion of fibrinogen to crosslinked fibrin.
The γ′ species is present in about 10% of γ chains,31 so the contribution of this alternative species to both structure and function should be more readily measured. We did not see changes in structure that would be consistent with a 10% contribution from a differently shaped molecule. We also did not see differences in the conversion of fibrinogen to crosslinked fibrin that would be consistent with a 10% change in function. Therefore, we conclude that the γ′ species does not alter the characteristics that we measured. Another laboratory has synthesized and characterized recombinant fibrinogen with only the γ′ species.7 They showed that this variant fibrinogen cannot support platelet aggregation,7 but they have not characterized other functional properties of this form of fibrinogen.
Finally, the data indicate that posttranslational modification of recombinant fibrinogen is similar to plasma fibrinogen. The single characteristic that showed a significant difference was the nature of the heterogeneity of the Aα chains. Immunoblots developed with MoAbs specific for Aα chain showed that both plasma fibrinogen and recombinant fibrinogen contain minor Aα chain species. The relative amounts of these species differs between the recombinant protein and the plasma protein. The smaller α chain species in plasma fibrinogen were a predominant species with a relative MW of approximately 64 kD and a less dominant species of approximately 55 kD. The smaller Aα chain species in recombinant fibrinogen were a predominant species with a relative MW of approximately 55 kD and a less dominant species of approximately 64 kD. The Aα-chain heterogeneity in plasma fibrinogen is thought to arise from proteolysis. These data, therefore, indicate that recombinant fibrinogen synthesized in CHO cells and secreted into tissue culture medium is subject to Aα-chain proteolysis similarly, but not identical, to that found in plasma fibrinogen. This difference in Aα-chain proteolysis may account for the differences, noted above, in the percent of four nodule molecules observed by electron microscopy. That is, the relative abundance of 55 kD Aα chains may account for the decreased presence of four nodule molecules in recombinant fibrinogen relative to plasma fibrinogen. Further experiments are needed to establish whether either the αE containing molecules or Aα-chain proteolysis is associated with the observed structural differences.
We conclude that recombinant fibrinogen is a good model for plasma fibrinogen for the examination of the conversion of fibrinogen to crosslinked fibrin. We can therefore continue to examine these structural and functional characteristics using recombinant variant fibrinogens.
ACKNOWLEDGMENT
We are grateful to Li Fang Ping who performed all of the tissue culture work and provided excellent technical assistance.
Supported in part by American Heart Association grant-in-aid NC-94-GS-22 (to O.V.G.), National Institutes of Health (NIH) Grant No. HL31048 (to S.T.L.), and NIH Grant No. HL30954 (to J.W.W.).
Address reprint requests to Susan T. Lord, PhD, Department of Pathology and Laboratory Medicine, 603 Brinkhous-Bullitt Bldg, CB # 7525, Chapel Hill, NC 27599-7525.

This feature is available to Subscribers Only
Sign In or Create an Account Close Modal