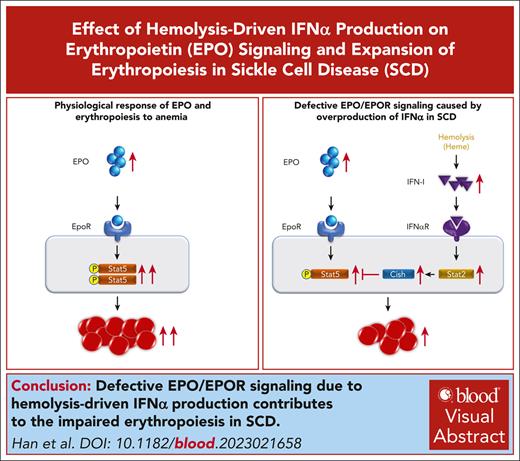
The erythropoietic activity of sickle celled mouse BM to compensate for anemia is impaired.
Defective EPO/EPOR signaling due to hemolysis-driven IFNα production contributes to the impaired erythropoiesis.
Visual Abstract
Disordered erythropoiesis is a feature of many hematologic diseases, including sickle cell disease (SCD). However, very little is known about erythropoiesis in SCD. Here, we show that although bone marrow (BM) erythroid progenitors and erythroblasts in Hbbth3/+ thalassemia mice were increased more than twofold, they were expanded by only ∼40% in Townes sickle mice (SS). We further show that the colony-forming ability of SS erythroid progenitors was decreased and erythropoietin (EPO)/EPO receptor (EPOR) signaling was impaired in SS erythroid cells. Furthermore, SS mice exhibited reduced responses to EPO. Injection of mice with red cell lysates or hemin, mimicking hemolysis in SCD, led to suppression of erythropoiesis and reduced EPO/EPOR signaling, indicating hemolysis, a hallmark of SCD, and could contribute to the impaired erythropoiesis in SCD. In vitro hemin treatment did not affect Stat5 phosphorylation, suggesting that hemin-induced erythropoiesis suppression in vivo is via an indirect mechanism. Treatment with interferon α (IFNα), which is upregulated by hemolysis and elevated in SCD, led to suppression of mouse BM erythropoiesis in vivo and human erythropoiesis in vitro, along with inhibition of Stat5 phosphorylation. Notably, in sickle erythroid cells, IFN-1 signaling was activated and the expression of cytokine inducible SH2–containing protein (CISH), a negative regulator of EPO/EPOR signaling, was increased. CISH deletion in human erythroblasts partially rescued IFNα-mediated impairment of cell growth and EPOR signaling. Knocking out Ifnar1 in SS mice rescued the defective BM erythropoiesis and improved EPO/EPOR signaling. Our findings identify an unexpected role of hemolysis on the impaired erythropoiesis in SCD through inhibition of EPO/EPOR signaling via a heme-IFNα-CISH axis.
Introduction
Erythropoiesis is a process by which multipotential hematopoietic stem cells proliferate, differentiate, and eventually produce mature erythrocytes. It is a continuous process that contains 8 developmental stages, starting from the early-stage erythroid progenitor burst-forming unit–erythroid (BFU-E), which differentiates to the late-stage erythroid progenitor colony-forming unit–erythroid (CFU-E). CFU-E undergoes terminal erythroid differentiation to become sequentially proerythroblasts (Pros), basophilic erythroblasts (Basos), polychromatic erythroblasts, and orthochromatic erythroblasts (Orthos). Orthos extrude the nucleus to become reticulocytes, which mature into erythrocytes in the bloodstream. Disruption of this erythropoietic process is a feature of many human hematologic disorders, including myelodysplastic syndromes,1,2 Diamond-Blackfan anemia,3,4 and congenital dyserythropoietic anemia.5-8
Disordered erythropoiesis has also been reported in hemoglobinopathies, such as thalassemia and sickle cell disease (SCD). It is well-known that thalassemia is characterized by ineffective erythropoiesis.9-14 In marked contrast, very little is known about the changes of erythropoiesis in SCD.15,16 With elevated erythropoietin (EPO) levels in both thalassemia and SCD due to anemia, the bone marrow (BM) erythropoietic activity is expected to increase to compensate. Indeed, we previously reported that BM erythroblasts increased approximately threefold in a thalassemia mouse model Hbbth1/th1 mice.17 Notably, EPO injection also led to an approximately twofold to threefold increase in BM erythroblasts,18,19 indicating that BM erythropoietic activity could increase approximately twofold to threefold under erythropoietic stress conditions. In this study, we examined BM erythropoietic activity in the Townes SCD mouse model (SS). Surprisingly, we found that despite the similarly increased blood EPO levels in Hbbth3/+ and SS mice, compared with their corresponding controls, only modest increases in erythroid progenitor and erythroblast numbers were detected in SS BM, whereas they more than doubled in the Hbbth3/+ mice, indicating impaired ability of the SS mice BM to compensate for the anemia. Notably, SS mice exhibited reduced responses to EPO, consistent with the necessity for higher doses of EPO therapy in SCD.20,21 Mechanistically, we found that intravascular hemolysis led to suppression of erythropoiesis through induction of interferon-α (IFNα), which inhibited EPO/EPOR signaling by increasing expression of cytokine inducible SH2-containing protein (CISH), a negative regulator of EPOR. These findings have, thus, uncovered a novel heme-IFNα-CISH-EPO/EPOR axis leading to impaired BM erythropoiesis in SCD, with the potential for improving chronic anemia in SCD.
Materials and methods
Materials
Antibodies, reagents, primer sequences, and single guide RNA sequences are listed in supplemental Table 1, available on the Blood website.
Mice
SS and the corresponding control mice (AA) on a 129/B6-mixed background,22Hbbth3/+ mice on B6 background,23Ifnar1−/− mice24 on B6 background, and wild-type (WT) B6 mice were purchased from The Jackson Laboratory. SS/Ifnar1−/− mice were generated by breeding SS mice with Ifnar1−/− mice. Details of mouse housing and treatments are described in supplemental Materials and methods.
Measurements of EPO and IFNα levels
Mouse blood (∼800 μL) was collected by cardiac puncture. The blood was centrifuged at 2000g for 10 minutes to collect plasma. Plasma EPO and IFNα levels were measured using a mouse EPO kit and mouse IFNα kit, respectively. Deidentified plasma (citrated) samples collected from patients with SCD (n = 21) were used for measurement of EPO levels using enzyme-linked immunosorbent assay kit for human EPO.
Erythroid colony formation assay
Erythroid colony assays were performed using either total BM cells or sorted BFU-E and CFU-E cells. The detailed conditions are described in the supplemental Methods.
Enrichment of mouse BM erythroid cells
Erythroid cells were enriched by depleting CD11b+, Gr1+, CD3e+, and B220+ cells using magnetic-activated cell separation.
Flow cytometry analyses of mouse BM erythroid progenitors and erythroblasts
In vitro human erythroid culture
EPO stimulation and assessment of Stat5 and Erk phosphorylation
For western blot analyses, the enriched mouse BM erythroid cells or cultured human day-6 erythroid cells that were treated with IFNα for 3 hours and starved for 6 hours in phosphate-buffered saline (PBS), 2% fetal bovine serum, or 2 mM EDTA on ice were stimulated with or without EPO for 10 minutes at 37°C. For intracellular staining of pStat5, the enriched lineage-negative cells or BM cells were stained with cell-surface antibodies for erythroid progenitors or erythroblast, as previously described,17,19,25,28 after which the cells were stimulated with or without EPO. The cells were then fixed with BD Phosflow Fix Buffer 1 at 37°C for 10 minutes. After washing, the cells were treated with BD Phosflow Perm Buffer III for 30 minutes on ice. Finally, the cells were stained with PE-Cy7-pStat5 at 37°C for 30 minutes and analyzed with Becton Dickinson LSR Fortessa flow cytometry.
Deletion of CISH in immortalized human erythroid cell line
CRISPR/Cas9-mediated CISH knockout was performed using an immortalized human erythroblast cell line CB-iEry that we recently established.29,30 Clone selection and expansion were performed as previously described.30 Cleavage of single guide RNA–targeted region was confirmed by both polymerase chain reaction (PCR) and sequencing.
Western blot, cytospin preparation, and quantitative real-time PCR
Whole-cell lysates were prepared with radio immunoprecipitation assay lysis buffer. Protein concentrations were detected by bovine calf albumin protein concentration kit. Quantification of the western blot was performed with ImageJ. Cytospins were prepared on coated slides with 5 × 10⁴ cells using the Thermo Scientific Shandon 4 Cytospin. The cells were stained with May-Grunwald and imaged using a Leica DM2000 inverted microscopy. For quantitative real-time PCR, total RNA was extracted from mouse or human erythroid cells using Qiagen RNeasy Plus Mini Kit. Quantitative real-time PCR was performed as previously described.
Statistical analyses
GraphPad Prism 7 software (GraphPad Software) was used for statistical analysis. All data were reported as mean ± standard error of the mean. Comparisons between 2 groups were performing using the Student t test. For multiple comparison, the Dunnett test was performed. Significance was set at P < .05.
Results
The ability of SS mouse BM to compensate for anemia was impaired
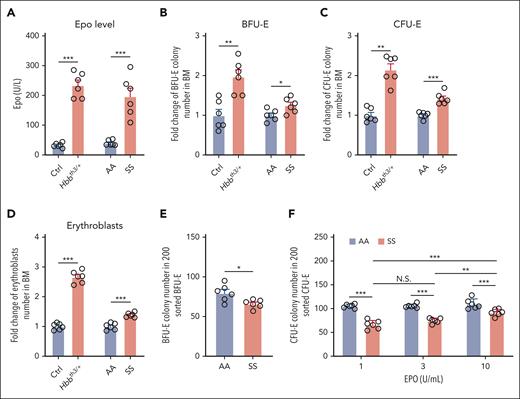
We previously reported that in a thalassemia mouse model Hbbth1/th1, BM erythroblasts increased approximately threefold to compensate for the anemia.17 Anemia leads to increased blood EPO levels. We also reported that EPO injection led to an approximately twofold to threefold increase in BM erythroblasts.18,19 These findings indicate that mouse BM can increase its erythropoietic activity as such under erythropoietic stress conditions. Here, we measured blood EPO levels and examined the changes in BM erythropoiesis of SS mice, using the thalassemia mouse model Hbbth3/+ as the control. We assessed the erythroid progenitors by erythroid colony assays31 and stained and quantified erythroblasts using anti-Ter119 and anti-CD44 antibodies per our previous publications.17,25 The representative gating strategy of erythroblasts which include Pros, Basos, polychromatic erythroblasts, and Orthos, is shown in supplemental Figure 1. We found that plasma EPO levels were similarly elevated in Hbbth3/+ and SS mice compared with levels in their corresponding controls (Figure 1A). Consistent with our previous finding that the BM erythropoietic activity increased approximately threefold in Hbbth1/th1mice,17 BFU-E colonies (Figure 1B), CFU-E colonies (Figure 1C), and erythroblasts (Figure 1D) were at least doubled in Hbbth3/+ mice compared with those in the littermate control mice, whereas they were only modestly increased in SS compared with those in AA mice. No differences in erythroblasts were noted between male and female mice (supplemental Figure 2). These findings demonstrate that the erythropoietic activity of SS BM to compensate for the anemia is impaired.
The ability of SS mouse BM to compensate for anemia was impaired. (A) Plasma EPO levels of various mice as indicated (N = 6). (B) Fold change of BFU-E colony numbers in 5 ×10⁴ BM cells (N = 6). (C) Fold change of CFU-E colony numbers in 5 × 10⁴ BM cells (N = 6). (D) Fold change of BM erythroblast numbers in 2 femurs + 2 tibias (N = 6). Data in panels B, C, and D were normalized by dividing them by the average of the control group. (E) Numbers of BFU-E colonies in 200 sorted BFU-E (N = 6). (F) Numbers of CFU-E colonies in 200 sorted CFU-E in the presence of EPO at the indicated concentrations (N = 6). ∗P < .05; ∗∗P < .01; ∗∗∗P < .001. N.S., no statistical difference.
The ability of SS mouse BM to compensate for anemia was impaired. (A) Plasma EPO levels of various mice as indicated (N = 6). (B) Fold change of BFU-E colony numbers in 5 ×10⁴ BM cells (N = 6). (C) Fold change of CFU-E colony numbers in 5 × 10⁴ BM cells (N = 6). (D) Fold change of BM erythroblast numbers in 2 femurs + 2 tibias (N = 6). Data in panels B, C, and D were normalized by dividing them by the average of the control group. (E) Numbers of BFU-E colonies in 200 sorted BFU-E (N = 6). (F) Numbers of CFU-E colonies in 200 sorted CFU-E in the presence of EPO at the indicated concentrations (N = 6). ∗P < .05; ∗∗P < .01; ∗∗∗P < .001. N.S., no statistical difference.
Colony-forming ability of the sorted SS erythroid progenitors was decreased
Traditionally, mouse BM erythroid progenitors, representing the BFU-E and the more differentiated CFU-E have been functionally assessed by erythroid colony assays using total BM cells.32-34 The results from such assays reflect the combination of frequencies of BFU-E and CFU-E in the BM and their colony-forming ability. We recently developed a flow cytometry–based method to isolate mouse BM BFU-E and CFU-E cells, defined as Lin−c-Kit+CD71− and Lin−c-Kit+CD71hi, respectively.19 Using this method, we sorted BFU-E and CFU-E cells from the BM of AA and SS mice and assessed their colony-forming abilities. The cytospin images of the sorted BFU-E and CFU-E cells are shown in supplemental Figure 3. Although there were no differences in morphology between AA and SS cells, a slight decrease (∼10%) in the number of colonies formed by the sorted SS BFU-E cells relative to that by AA BFU-E cells was detected (Figure 1E). CFU-E colony assay was performed in the presence of EPO only at concentrations of 1, 3, and 10 U/mL. Consistent with the previous finding that normal CFU-E colony formation plateaus when EPO concentration is >0.3 U/mL,35 we found robust and comparable numbers of AA CFU-E colonies at all 3 concentrations (out of the 200 sorted AA CFU-E cells, ∼110 CFU-E colonies were formed). In contrast, significantly fewer colonies were formed from the sorted SS CFU-E cells, although they were able to increase their colony-forming ability at higher (10 U/mL) EPO concentration (Figure 1F). These findings indicate that colony-forming ability of SS erythroid progenitors is impaired, likely due to decreased sensitivity to EPO.
The response of SS erythroid cells and SS mice to EPO was impaired
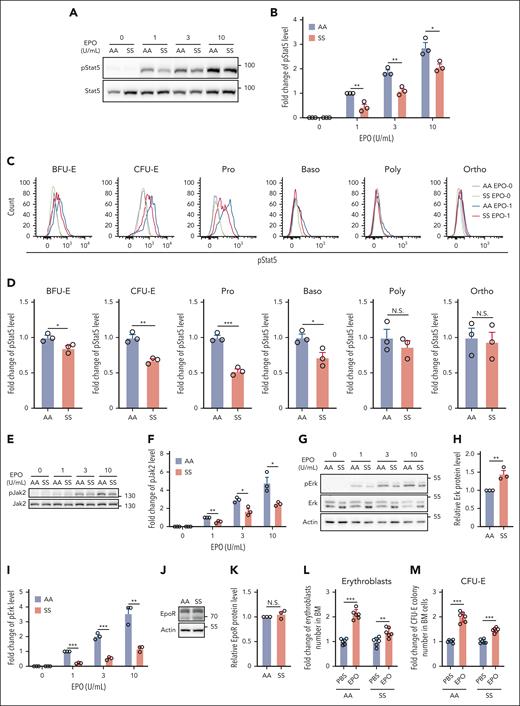
EPO and its cognate receptor play important roles in erythroid colony formation and are required for the survival of CFU-E and early-stage erythroblasts.36,37 To test whether the suboptimal expansion of sickle BM erythroid cells and the impaired colony-forming ability of the sorted SS erythroid progenitors are associated with defective EPO/EPOR signaling, we examined phosphorylation of Stat5 and Erk in BM erythroid cells. Western blot analyses of the enriched erythroid cells show that EPO-stimulated phosphorylation of Stat5 was significantly lower in SS than in AA erythroid cells (Figure 2A-B). Analyses of pStat5 levels in erythroid cells at distinct developmental stages by flow cytometry revealed that pStat5 levels were decreased in BFU-E, CFU-E, Pro, and Baso stages, with the greatest decreases in CFU-E and Pro stages (Figure 2C-D). Phosphorylation of Jak2, the immediate downstream target of EPOR, was also significantly decreased (Figure 2E-F). Although western blot analyses of extracellular signal-regulated kinase (Erk) and phosphorylated Erk (pErk) revealed that Erk expression was increased (probably as a compensation for the significantly decreased Erk phosphorylation), the phosphorylation of Erk was decreased in SS compared with that in AA erythroid cells (Figure 2G-I). Notably, the expression levels of EPOR were similar in AA and SS erythroid cells (Figure 2J-K). To examine the responses of SS mice to EPO in vivo, we injected EPO into AA and SS mice. Figure 2L-M shows that although EPO injection led to approximately twofold increases in both erythroblasts and CFU-E colonies in AA mice, it led to only slight increases in erythroblasts and CFU-E colonies in SS mice. These findings indicate an impairment of EPO response in BM erythroid progenitors or erythroblasts of SS mice.
EPO/EPOR signaling in SS erythroid cells was impaired. (A-B) Representative western blot analysis of phosphorylated Stat5 (pStat5) in the enriched BM erythroid cells of AA and SS mice and its quantification. The fold changes were normalized to the pStat5 level in BM erythroid cells of AA mice stimulated with EPO at 1 U/mL. (C-D) Representative flow-cytometric analysis of pStat5 in erythroid cells at each developmental stage and its quantification. (E-F) Representative western blot analysis of Jak2 and phosphorylated Jak2 (pJak2) in the enriched BM erythroid cells of AA and SS mice and its quantification (N = 3). (G) Representative western blot analysis of Erk and phosphorylated Erk (pErk) in the enriched BM erythroid cells of AA and SS mice. (H) Quantification analysis showing the fold change of Erk protein level. Actin was used as reference protein. (I) Quantification analysis of pErk in the enriched BM erythroid cells of AA and SS mice. The fold changes were normalized to the pErk level (normalized with Erk level) in enriched BM erythroid cells of AA mice stimulated with EPO at 1 U/mL. The quantitative analyses of pStat5 and pErk were based on data from 3 biological replicates (N = 3). (J) and (K) Representative western blot and quantitative analyses of EpoR levels in the enriched BM erythroid cells from AA and SS mice (N = 3). (L) Fold change of BM erythroblast numbers in 2 femurs + 2 tibias, and (M) fold change of CFU-E colony numbers in 5 × 10⁴ BM cells of PBS- or EPO-injected AA and SS mice (N = 6). ∗P < .05; ∗∗P < .01; ∗∗∗P < .001. Poly, polychromatic erythroblast.
EPO/EPOR signaling in SS erythroid cells was impaired. (A-B) Representative western blot analysis of phosphorylated Stat5 (pStat5) in the enriched BM erythroid cells of AA and SS mice and its quantification. The fold changes were normalized to the pStat5 level in BM erythroid cells of AA mice stimulated with EPO at 1 U/mL. (C-D) Representative flow-cytometric analysis of pStat5 in erythroid cells at each developmental stage and its quantification. (E-F) Representative western blot analysis of Jak2 and phosphorylated Jak2 (pJak2) in the enriched BM erythroid cells of AA and SS mice and its quantification (N = 3). (G) Representative western blot analysis of Erk and phosphorylated Erk (pErk) in the enriched BM erythroid cells of AA and SS mice. (H) Quantification analysis showing the fold change of Erk protein level. Actin was used as reference protein. (I) Quantification analysis of pErk in the enriched BM erythroid cells of AA and SS mice. The fold changes were normalized to the pErk level (normalized with Erk level) in enriched BM erythroid cells of AA mice stimulated with EPO at 1 U/mL. The quantitative analyses of pStat5 and pErk were based on data from 3 biological replicates (N = 3). (J) and (K) Representative western blot and quantitative analyses of EpoR levels in the enriched BM erythroid cells from AA and SS mice (N = 3). (L) Fold change of BM erythroblast numbers in 2 femurs + 2 tibias, and (M) fold change of CFU-E colony numbers in 5 × 10⁴ BM cells of PBS- or EPO-injected AA and SS mice (N = 6). ∗P < .05; ∗∗P < .01; ∗∗∗P < .001. Poly, polychromatic erythroblast.
Hemin or red blood cell (RBC) lysate injection led to suppression of BM erythropoiesis and inhibition of EPO/EPOR signaling in erythroid cells via an indirect mechanism
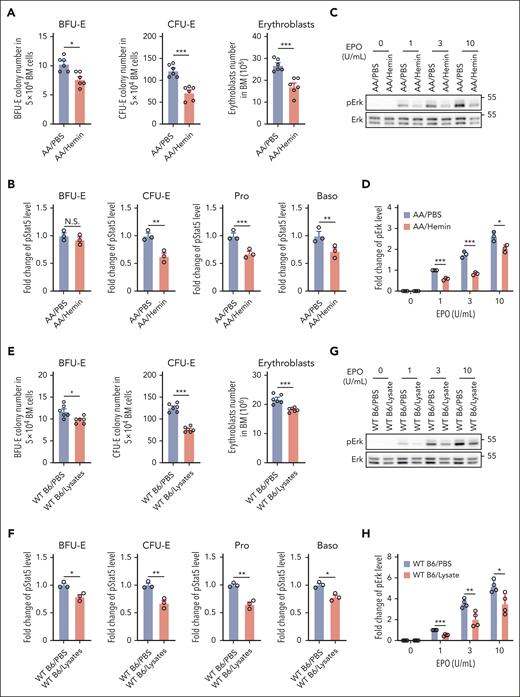
SCD is characterized by intravascular hemolysis, leading to release of toxin-free heme into the circulation.38 To investigate whether hemolysis may contribute to the impaired BM erythropoiesis in SCD, we injected hemin into AA mice. As shown in Figure 3A, hemin injection led to decreases in the numbers of BFU-E colonies, CFU-E colonies, and erythroblasts in the BM, indicating suppression of erythropoiesis, whereas no changes in peripheral blood RBC parameters and EPO levels were detected during this period of time (supplemental Figure 4). To examine whether heme-induced suppression of mouse BM erythropoiesis is associated with impaired EPO/EPOR signaling, we examined the effect of hemin injection on EPO-stimulated phosphorylation of Stat5 and Erk in erythroid cells. Similar to the decreased phosphorylation of Stat5 and Erk in SS erythroid cells compared with AA erythroid cells, EPO-stimulated phosphorylation of Stat5 (Figure 3B) and Erk (Figure 3C-D) was decreased in BM erythroid cells from hemin-injected AA mice compared with in cells from PBS-injected AA mice. Injection of a RBC lysate also led to decreases in BM BFU-E colonies, CFU-E colonies, and erythroblasts in WT B6 mice (Figure 3E) along with decreased EPO-stimulated phosphorylation of Stat5 (Figure 3F) and Erk in erythroid cells (Figure 3G-H). RBC lysate did not cause suppression of erythropoiesis in AA mice (because of the inability to induce IFNα; see “Hemin impairs erythropoiesis in vivo via induction of IFNα and subsequent upregulation of CISH”). To examine whether hemin directly impairs EPO/EPOR signaling in erythroid cells, we treated enriched B6 mouse BM erythroid cells in vitro with various concentrations of hemin, followed by stimulation with EPO and found that EPO-stimulated Stat5 phosphorylation was not affected by the in vitro hemin treatment (supplemental Figure 5), suggesting that the hemolysis/hemin-induced suppression of erythropoiesis and impaired EPO/EPOR signaling in vivo is via an indirect mechanism.
Hemin injection led to suppression of BM erythropoiesis and inhibition of EPO/EPOR signaling in erythroid cells via an indirect mechanism. (A) Effects of hemin injection on BM BFU-E colonies, CFU-E colonies, and erythroblasts in AA mice (N = 6). (B) Quantitative analysis of pStat5 levels as assessed by flow cytometry in BM erythroid cells of PBS- or hemin-injected AA mice. (C-D) Representative western blot analysis of pErk in the enriched BM erythroid cells from PBS- or hemin-injected AA mice and its quantification. The fold changes of pErk were normalized to the pErk level in BM erythroid cells of PBS-injected AA mice stimulated with EPO at 1 U/mL. (E) Effects of RBC lysate injection on BM BFU-E colonies, CFU-E colonies, and erythroblasts in WT B6 mice (N = 6). (F) Quantitative analysis of pStat5 levels as assessed by flow cytometry in BM erythroid cells of PBS- or RBC lysate–injected WT B6 mice. (G-H) Representative western blot analysis of pErk level in enriched BM erythroid cells of WT B6 mice injected with PBS or RBC lysate and its quantification. The fold changes of pErk were normalized to the pErk level in BM erythroid cells of PBS-injected WT B6 mice stimulated with EPO at 1 U/mL. The quantitative analysis of pStat5 and pErk were based on data from 3 biological replicates (N = 3). ∗P < .05; ∗∗P < .01; ∗∗∗P < .001.
Hemin injection led to suppression of BM erythropoiesis and inhibition of EPO/EPOR signaling in erythroid cells via an indirect mechanism. (A) Effects of hemin injection on BM BFU-E colonies, CFU-E colonies, and erythroblasts in AA mice (N = 6). (B) Quantitative analysis of pStat5 levels as assessed by flow cytometry in BM erythroid cells of PBS- or hemin-injected AA mice. (C-D) Representative western blot analysis of pErk in the enriched BM erythroid cells from PBS- or hemin-injected AA mice and its quantification. The fold changes of pErk were normalized to the pErk level in BM erythroid cells of PBS-injected AA mice stimulated with EPO at 1 U/mL. (E) Effects of RBC lysate injection on BM BFU-E colonies, CFU-E colonies, and erythroblasts in WT B6 mice (N = 6). (F) Quantitative analysis of pStat5 levels as assessed by flow cytometry in BM erythroid cells of PBS- or RBC lysate–injected WT B6 mice. (G-H) Representative western blot analysis of pErk level in enriched BM erythroid cells of WT B6 mice injected with PBS or RBC lysate and its quantification. The fold changes of pErk were normalized to the pErk level in BM erythroid cells of PBS-injected WT B6 mice stimulated with EPO at 1 U/mL. The quantitative analysis of pStat5 and pErk were based on data from 3 biological replicates (N = 3). ∗P < .05; ∗∗P < .01; ∗∗∗P < .001.
Hemin impaired erythropoiesis in vivo via induction of IFNα and subsequent upregulation of CISH
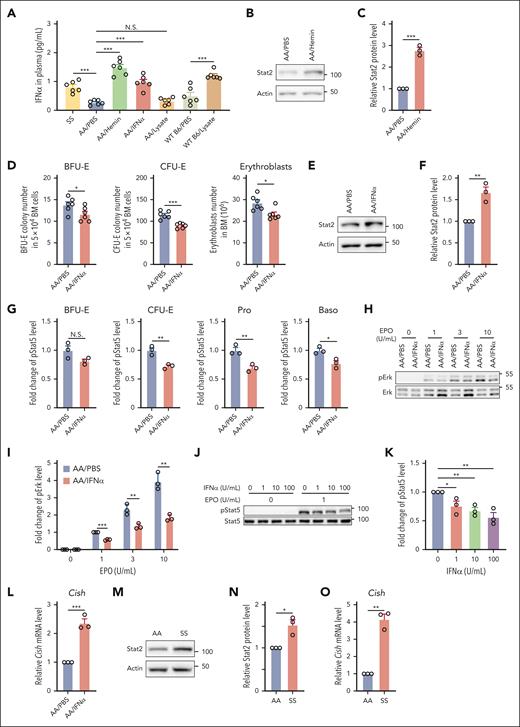
We have recently demonstrated that hemolysis induces IFNα expression after hemin injection in WT B6 mice.39 Together with previous reports that type 1 IFN (IFN-1) inhibits erythropoiesis,40-44 we reasoned that the hemin-induced suppression of erythropoiesis in vivo could be via hemin-driven production of IFNα. To test this, we first measured the plasma IFNα levels in the hemin- or RBC lysate–injected mice and compared these with plasma IFNα levels in SS mice. Figure 4A shows that plasma IFNα levels were increased in SS mice compared with those in AA mice and that hemin injection into AA mice increased plasma IFNα levels to slightly higher levels than those detected in SS mice. Figure 4A also shows that RBC lysate injection led to increased IFNα levels in WT Β6 mice but not in AA mice, consistent with our above finding that RBC lysate injection inhibited BM erythropoiesis in WT B6 mice but not in AA mice. This finding is also in line with our recent report that AA mice produced less IFNα compared with B6 mice in response to hemin treatment,39 indicating that AA mice are less sensitive to hemolysis. Notably, no differences in plasma IFNα levels were detected between Hbbth3/+ and the control mice (supplemental Figure 6). We next examined whether IFN-1–mediated signaling is activated in BM erythroid cells of the hemin-treated AA mice. IFN-1–mediated signaling requires Stat2, the phosphorylation of which leads to phosphorylation of Stat1 with subsequent formation of pStat1/pStat2 heterodimer.45 The pStat1/pStat2 heterodimer in complex with interferon regulatory factor 9 (IRF-9) forms the transcription factor interferon-stimulated gene factor 3 (ISGF3) that promotes transcription of key IFN-stimulated genes, including overproduction of unphosphorylated Stat2 that persist for several days.46,47 Given that phosphorylation of Stat2 disappears in the absence of stimulus whereas increased expression of Stat2 persists for several days, we used expression levels of Stat2 as the readout for activation of IFN-1–mediated signaling. We found that the levels of Stat2 were significantly increased in BM erythroid cells of the hemin-treated AA mice compared with those of PBS-treated AA mice (Figure 4B-C). To gain direct evidence that IFNα impairs BM erythropoiesis by negatively regulating EPO/EPOR signaling in vivo, we injected 104 U IFNα into AA mice for 3 days. As shown in Figure 4A, the blood IFNα levels in IFNα-injected AA mice increased to similar levels detected in SS mice. Notably, similar to the effects of hemin injection on BM erythropoiesis, IFNα injection led to decreases in BM BFU-E colonies, CFU-E colonies, and erythroblasts (Figure 4D). Furthermore, increased levels of Stat2 were detected in BM erythroid cells from IFNα-injected mice compared with in cells from PBS-injected mice (Figure 4E-F). These changes were accompanied by decreases in EPO-stimulated phosphorylation of Stat5 (Figure 4G) and Erk (Figure 4H-I). Additionally, IFNα treatment of mouse BM erythroid cells in vitro inhibited EPO-stimulated Stat5 phosphorylation in a dose-dependent manner (Figure 4J-K). To define the mechanisms by which IFNα inhibits EPO/EPOR signaling, we examined the expression of family members of suppressor of cytokine signaling (SOCS). SOCS family has 8 members, SOCS1 to SOCS7 and CIS/CISH. Three family members, SOCS1, SOCS3, and CISH, have been implicated in negatively regulating EPO/EPOR signaling48-50 and can be induced by IFNs.51,52 We, therefore, measured the expression levels of Socs1, Socs3, and Cish by real-time PCR. We could not detect expression of Socs1 and Socs3, but the expression levels of Cish were increased in erythroid cells from mice injected with IFNα (Figure 4L). Importantly, the expression levels of Stat2 (Figure 4M-N) and Cish (Figure 4O) were higher in SS than in AA erythroid cells, indicating activation of IFN-1 signaling and subsequent upregulation of Cish in SS BM erythroid cells. Altogether, these findings indicate that hemolysis-driven production of IFNα in SCD contributes to the diminished response of erythroid cells to EPO via upregulation of Cish, leading to the impaired BM erythropoiesis in SCD.
Hemin impaired erythropoiesis in vivo via induction of IFNα. (A) Plasma IFNα levels of various mice as indicated (N = 6). (B-C) Representative western blot and quantitative analyses of Stat2 levels in the enriched BM erythroid cells from PBS- or hemin-injected mice (N = 3). (D) Effects of IFNα injection to AA mice on BM BFU-E colonies, CFU-E colonies, and erythroblasts (N = 6). (E-F) Representative western blot and quantitative analyses of Stat2 levels in the enriched BM erythroid cells from PBS- or IFNα-injected AA mice (N = 3). (G) Quantitative analysis of pStat5 levels as assessed by flow cytometry in BM erythroid cells of PBS- or IFNα-injected AA mice. (H-I) Representative western blot and quantitative analyses of pErk levels in enriched BM erythroid cells from PBS- or IFNα-injected AA mice. The fold changes of pErk were normalized to the pErk level from BM erythroid cells of PBS-injected AA mice stimulated with EPO at 1 U/mL (N = 3). (J-K) Representative western blot and quantitative analyses of pStat5 levels in the enriched BM erythroid cells of AA mice treated with IFNα in vitro at indicated concentrations and then stimulated with EPO at 0 or 1 U/mL. The fold changes were normalized to the pStat5 level in the enriched erythroid cells without IFNα treatment and stimulated with EPO at 1 U/mL (N = 3). (L) Quantitative analyses of Cish messenger RNA (mRNA) levels in enriched BM erythroid cells from AA mice injected with PBS or IFNα (N = 3). (M-N) Representative western blot and quantitative analyses of Stat2 levels in enriched BM erythroid cells from AA and SS mice (N = 3). (O) Quantitative analyses of Cish mRNA levels in enriched BM erythroid cells of AA and SS mice (N = 3). ∗P < .05; ∗∗P < .01; ∗∗∗P < .001.
Hemin impaired erythropoiesis in vivo via induction of IFNα. (A) Plasma IFNα levels of various mice as indicated (N = 6). (B-C) Representative western blot and quantitative analyses of Stat2 levels in the enriched BM erythroid cells from PBS- or hemin-injected mice (N = 3). (D) Effects of IFNα injection to AA mice on BM BFU-E colonies, CFU-E colonies, and erythroblasts (N = 6). (E-F) Representative western blot and quantitative analyses of Stat2 levels in the enriched BM erythroid cells from PBS- or IFNα-injected AA mice (N = 3). (G) Quantitative analysis of pStat5 levels as assessed by flow cytometry in BM erythroid cells of PBS- or IFNα-injected AA mice. (H-I) Representative western blot and quantitative analyses of pErk levels in enriched BM erythroid cells from PBS- or IFNα-injected AA mice. The fold changes of pErk were normalized to the pErk level from BM erythroid cells of PBS-injected AA mice stimulated with EPO at 1 U/mL (N = 3). (J-K) Representative western blot and quantitative analyses of pStat5 levels in the enriched BM erythroid cells of AA mice treated with IFNα in vitro at indicated concentrations and then stimulated with EPO at 0 or 1 U/mL. The fold changes were normalized to the pStat5 level in the enriched erythroid cells without IFNα treatment and stimulated with EPO at 1 U/mL (N = 3). (L) Quantitative analyses of Cish messenger RNA (mRNA) levels in enriched BM erythroid cells from AA mice injected with PBS or IFNα (N = 3). (M-N) Representative western blot and quantitative analyses of Stat2 levels in enriched BM erythroid cells from AA and SS mice (N = 3). (O) Quantitative analyses of Cish mRNA levels in enriched BM erythroid cells of AA and SS mice (N = 3). ∗P < .05; ∗∗P < .01; ∗∗∗P < .001.
Hemin-induced suppression of BM erythropoiesis was attenuated in IFN-1 receptor knockout mice
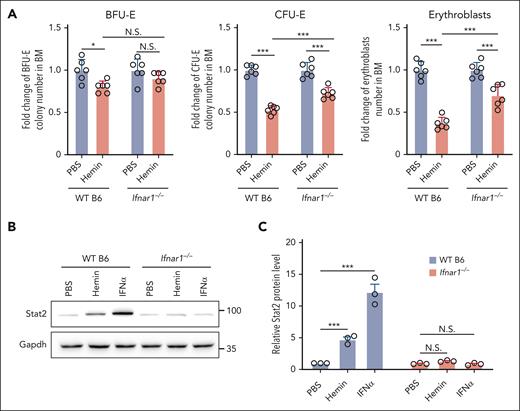
To gain further support that IFN-1 is involved in the hemin-induced suppression of erythropoiesis, we examined the effect of hemin or IFNα on erythropoiesis in IFN-1 receptor knockout (Ifnar1–/–) mice.24 Because Ifnar1–/– mice were on a B6 background, we used B6 mice as controls. As shown in Figure 5A, hemin injection led to attenuated reductions in BM erythroid BFU-E colonies (∼20% decrease in B6 mice vs no significant decrease in Ifnar1–/– mice), CFU-E colonies (∼47% decrease in B6 mice vs ∼27% decrease in Ifnar1–/– mice), and erythroblasts (∼64% decrease in B6 mice vs ∼29% decrease in Ifnar1–/– mice). As expected, IFNα injection did not suppress BM BFU-E colonies, CFU-E colonies, and erythroblasts in Ifnar1–/– mice (supplemental Figure 7). In addition, as expected, hemin or IFNα injection did not induce upregulation of Stat2 in erythroid cells from Ifnar1–/– mice (Figure 5B-C). These findings indicate that hemin-induced suppression of erythropoiesis in vivo is, in part, through hemolysis-driven IFNα production.
Hemin-induced suppression of BM erythropoiesis was attenuated in IFN-1 receptor knockout mice. (A) Fold change of BFU-E colony numbers, CFU-E colony numbers, and erythroblast numbers in the BM of PBS- or hemin-injected WT B6 or Ifnar1−/− mice (N = 6). (B-C) Representative western blot and quantitative analyses of Stat2 levels in enriched BM erythroid cells of PBS-, hemin- or IFNα-injected WT B6 or Ifnar1−/− mice (N = 3). ∗P < .05; ∗∗∗P < .001.
Hemin-induced suppression of BM erythropoiesis was attenuated in IFN-1 receptor knockout mice. (A) Fold change of BFU-E colony numbers, CFU-E colony numbers, and erythroblast numbers in the BM of PBS- or hemin-injected WT B6 or Ifnar1−/− mice (N = 6). (B-C) Representative western blot and quantitative analyses of Stat2 levels in enriched BM erythroid cells of PBS-, hemin- or IFNα-injected WT B6 or Ifnar1−/− mice (N = 3). ∗P < .05; ∗∗∗P < .001.
Deletion of IFN-1 receptor in SS mice improved the impaired BM erythropoiesis of SS mice
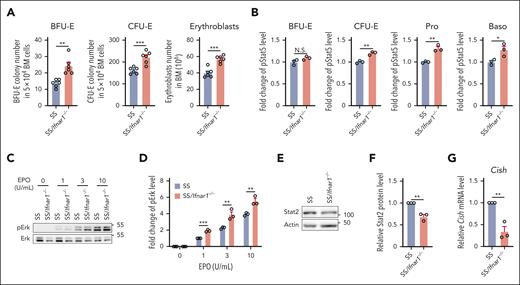
To examine whether the deletion of IFN-1 receptor can rescue the impaired BM of SS mice, we generated SS/Ifnar1−/− mice and examined their BM erythropoietic activity as described earlier. Figure 6A shows that BFU-E colonies, CFU-E colonies, and erythroblasts were significantly increased in the BM of SS/Ifnar1−/− mice compared with those in SS mice. We next examined phosphorylation of Stat5 and Erk and found that the EPO-stimulated phosphorylation of both Stat5 (Figure 6B) and Erk (Figure 6C-D) was increased in erythroid cells from SS/Ifnar1−/− mice compared with that in SS mice, indicating improved EPO/EPOR signaling. We also found that expression of Stat2 (Figure 6E-F) and Cish (Figure 6G) were decreased in SS/Ifnar1−/− compared with SS erythroid cells, indicating decreased activation of IFN-1 signaling. No differences were noted in peripheral blood RBC count, hemoglobin, hematocrit, and reticulocyte between SS and SS/Ifnar1−/− mice (supplemental Figure 8). Together, these findings demonstrate that deletion of IFN-1 receptor in SS mice rescues the impaired BM erythropoiesis and EPO/EPOR signaling without improvement of anemia.
Deletion of IFN-1 receptor in the Townes SS mice improved the impaired BM erythropoiesis of SS mice. (A) Numbers of BFU-E colonies, CFU-E colonies, and erythroblasts in the BM of SS or SS/Ifnar1−/− mice (N = 6). (B) Quantitative analysis showing the pStat5 levels in the enriched BM erythroid cells of SS or SS/Ifnar1−/− mice. (C-D) Representative western blot and quantitative analyses of pErk levels in enriched BM erythroid cells from SS or SS/Ifnar1−/− mice. The fold changes were normalized to the pErk level from BM erythroid cells of SS mice stimulated with EPO at 1 U/mL. (E-F) Representative western blot and quantitative analyses of Stat2 levels in enriched BM erythroid cells of SS or SS/Ifnar1−/− mice. (G) Quantitative analyses of Cish mRNA levels in enriched BM erythroid cells of SS and SS/Ifnar1−/− mice. The quantitative analyses of pStat5, pErk, Stat2, and Cish were based on data from 3 biological replicates. ∗P < .05; ∗∗P < .01; ∗∗∗P < .001.
Deletion of IFN-1 receptor in the Townes SS mice improved the impaired BM erythropoiesis of SS mice. (A) Numbers of BFU-E colonies, CFU-E colonies, and erythroblasts in the BM of SS or SS/Ifnar1−/− mice (N = 6). (B) Quantitative analysis showing the pStat5 levels in the enriched BM erythroid cells of SS or SS/Ifnar1−/− mice. (C-D) Representative western blot and quantitative analyses of pErk levels in enriched BM erythroid cells from SS or SS/Ifnar1−/− mice. The fold changes were normalized to the pErk level from BM erythroid cells of SS mice stimulated with EPO at 1 U/mL. (E-F) Representative western blot and quantitative analyses of Stat2 levels in enriched BM erythroid cells of SS or SS/Ifnar1−/− mice. (G) Quantitative analyses of Cish mRNA levels in enriched BM erythroid cells of SS and SS/Ifnar1−/− mice. The quantitative analyses of pStat5, pErk, Stat2, and Cish were based on data from 3 biological replicates. ∗P < .05; ∗∗P < .01; ∗∗∗P < .001.
IFNα inhibited growth of human erythroid cells and impaired EPO/EPOR signaling via upregulation of CISH
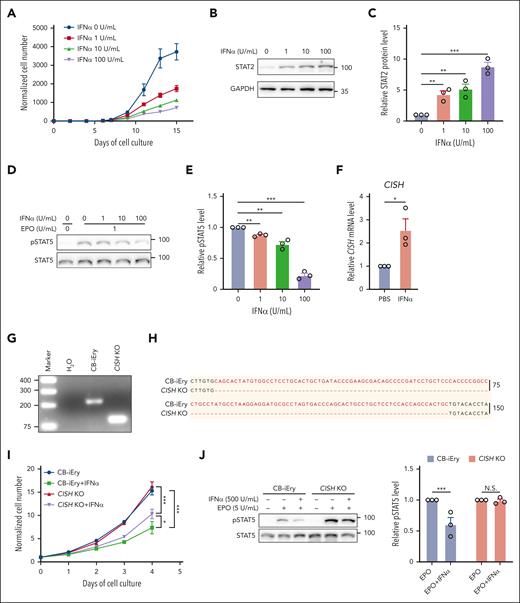
Lastly, we investigated the effects of IFNα on human erythropoiesis using an in vitro erythroid differentiation system.26Figure 7A shows that human IFNα inhibited cell growth in a dose-dependent manner. As expected, IFNα treatment led to activation of IFN-1 signaling in human erythroid cells, as demonstrated by increases in levels of STAT2 (Figure 7B-C). This was accompanied by inhibition of EPO-stimulated STAT5 phosphorylation (Figure 7D-E) and induction of CISH expression (Figure 7F). To examine whether deletion of CISH can rescue IFNα-mediated suppression of cell growth and EPO/EPOR signaling, we used CRISPR/Cas9 to delete CISH in the immortalized human cord blood CD34+ cell–derived erythroid cell line CB-iEry we recently established.29,30 The deletion of a 134-bp nucleotide of CISH was confirmed by both PCR (Figure 7G) and sequencing (Figure 7H). supplemental Figure 9 shows that IFNα inhibited the growth of CB-iEry cells, although at a higher concentration than what was required for primary erythroid cells, suggesting less sensitivity of the immortalized erythroid cell line to IFNα. Notably, deletion of CISH partially rescued IFNα-mediated suppression of cell growth (Figure 7I) and impairment of STAT5 phosphorylation (Figure 7J). Our findings indicate conserved mechanisms between mouse and human.
IFN-1 inhibited growth of primary human erythroid cells and impaired EPO/EPOR signaling in vitro. (A) Growth curves of human erythroid cells in the absence or presence of human IFNα at indicated concentrations (N = 3). (B-C) Representative western blot and quantitative analyses of STAT2 levels in day 6 erythroid cells cultured in the absence or presence of human IFNα at indicated concentrations (N = 3). (D-E) Representative western blot and quantitative analyses of pSTAT5 levels in day 6 erythroid cells cultured in the absence or presence of human IFNα at indicated concentrations (N = 3). (F) Quantitative analyses of CISH mRNA levels in the absence or presence of human IFNα. (G-H) PCR result and Sanger sequencing analysis of CISH in the CB-iEry cells with or without CRISPR/CAS9-mediated CISH KO. (I) Growth curves of CB-iEry cells with or without CISH knockout (KO) in the absence or presence of human IFNα at indicated concentrations (N = 3). (J) Representative western blot and quantitative analyses of pSTAT5 levels in CB-iEry cells with or without CISH KO in the absence or presence of human IFNα (500 U/mL) or EPO (5 U/mL) (N = 3). ∗P < .05; ∗∗P < .01; ∗∗∗P < .001.
IFN-1 inhibited growth of primary human erythroid cells and impaired EPO/EPOR signaling in vitro. (A) Growth curves of human erythroid cells in the absence or presence of human IFNα at indicated concentrations (N = 3). (B-C) Representative western blot and quantitative analyses of STAT2 levels in day 6 erythroid cells cultured in the absence or presence of human IFNα at indicated concentrations (N = 3). (D-E) Representative western blot and quantitative analyses of pSTAT5 levels in day 6 erythroid cells cultured in the absence or presence of human IFNα at indicated concentrations (N = 3). (F) Quantitative analyses of CISH mRNA levels in the absence or presence of human IFNα. (G-H) PCR result and Sanger sequencing analysis of CISH in the CB-iEry cells with or without CRISPR/CAS9-mediated CISH KO. (I) Growth curves of CB-iEry cells with or without CISH knockout (KO) in the absence or presence of human IFNα at indicated concentrations (N = 3). (J) Representative western blot and quantitative analyses of pSTAT5 levels in CB-iEry cells with or without CISH KO in the absence or presence of human IFNα (500 U/mL) or EPO (5 U/mL) (N = 3). ∗P < .05; ∗∗P < .01; ∗∗∗P < .001.
Discussion
In this study, we identified defective BM erythropoiesis in a mouse model of SCD along with an impaired response of their BM erythroid progenitors and erythroblasts to EPO. Injection of hemin or RBC lysate to nonsickle mice phenocopied the BM erythropoiesis defects as well as impairment in EPO/EPOR signaling seen in sickle mice. Mechanistically, we found that hemolysis or heme impairs EPO/EPOR signaling through the activation of IFN-1 signaling and subsequent upregulation of CISH, a negative regulator of EPO/EPOR signaling, leading to impaired BM erythropoiesis. Most importantly, deletion of IFN-1 receptor in SS mice rescued the impaired BM erythropoiesis of SS mice as well as the related molecular changes, although without improvement of anemia. The finding that improved erythropoiesis was not accompanied by improvement of anemia strongly suggest that destruction of SS RBCs is responsible for the anemia in SCD. Nevertheless, our findings have uncovered IFN-1 signaling induced by cell-free heme as a novel pathway leading to diminished EPO response and impaired BM erythropoiesis in SCD, opening up the potential of IFN-1–targeted approaches to reverse erythropoiesis defects and improve EPO therapy for chronic anemia states of SCD.
An unexpected finding of this study is the impaired ability of sickle celled mouse BM to expand erythropoiesis in response to anemic stress despite elevated levels of circulating EPO. This is best exemplified when compared with other anemic models, including thalassemia Hbbth1/th1, in which BM erythroblast numbers were ∼2.5-fold higher than in controls.17 In this study, we further demonstrated that in another thalassemia mouse model Hbbth3/+, the erythroid progenitors and erythroblasts were also increased more than twofold. In contrast, despite the similarly increased circulating EPO levels in SS mice and Hbbth3/+ mice compared with those in their corresponding controls, BM erythroid progenitors and erythroblasts in SS mice were increased by only ∼40%. Moreover, consistent with EPO hyporesponsiveness in SCD, we found reduced colony-forming ability of SS CFU-E cells in vitro at concentrations of EPO that normally show maximal colony formation as well as significantly smaller increases in BM erythropoietic activity in SS mice in vivo after EPO injections. It should be noted that despite elevated levels of circulating EPO, as reported previously53,54 and confirmed in our analysis (twofold increase in patients with SCD (n = 21), 41 ± 5 milli-international unit (mIU)/mL vs healthy controls ∼20 mIU/mL), therapeutic doses of EPO administered in SCD are considerably higher.55,56 Although EPO dose response confirmatory studies using human SCD BM erythroid cells are needed, our findings strongly suggest that a compromised EPO response of erythroid progenitors or erythroblasts underlies the need for administration of higher doses of EPO in SCD.
Earlier studies in the 1980s showed that hemin promoted erythroid colony formation in vitro.57,58 Based on those findings, it was suggested that similar to EPO, hemin can be an erythroid-stimulating agent. However, to the best of our knowledge, there have been no subsequent reports thus far to demonstrate that hemin can, indeed, stimulate erythropoiesis in vivo. In contrast to this early suggestion, here we show that hemin injection led to suppression of erythropoiesis in vivo. Our findings are in line with a more recent study showing impaired erythropoiesis in hemolytic conditions.59 Here, we further documented a novel mechanism that heme/hemolysis-induced suppression of erythropoiesis in vivo is in part via the induction of IFNα expression. Given the toxic nature of free hemin as a potent oxidative molecule, it seems unlikely that hemin is an erythropoiesis-stimulating agent.
Previous studies have shown that IFN-1 inhibits erythropoiesis,40-44 but the underlying mechanisms were unknown. Thus, another novel finding of this study, to our knowledge, is the demonstration that IFN-1 suppresses erythropoiesis by inhibiting EPO/EPOR signaling via upregulation of CISH, an EPO/EPOR-negative regulator in erythroid cells. Moreover, the finding that hemolysis through induction of IFN-1 suppresses erythropoiesis may have implications in understanding the mechanisms of other hemolytic anemias or anemia of inflammation when levels of blood heme or/and IFN-1 are increased. Understanding the molecular basis of IFN-1–mediated downregulation of EPO response may lead to development of novel strategies to improve EPO hyporesponsiveness not only for SCD but also for other settings besides SCD, such as anemia of chronic disease.60,61
Although our data clearly showed that hemin or hemolysis led to impaired erythropoiesis via upregulation of IFNα, it should be noted that deletion of Ifnar1 attenuated but did not abolish the hemin-induced suppression of BM erythropoiesis in the Ifnar1−/− mice, suggesting the existence of IFNα-independent mechanisms for the hemin or hemolysis-induced suppression of erythropoiesis. In addition to IFNα, other proinflammatory cytokines, such as interleukin-6 (IL-6) and tumor necrosis factor α are also increased in SCD.62-65 Given that IL-6 can be induced by hemin66 and that IL-6 has been reported to impair erythropoiesis as well as induce hepcidin, it is likely that hemin or hemolysis-induced upregulation of IL-6 also contributes to the impaired erythropoiesis in SCD directly67,68 or/and through upregulation of hepcidin.69,70 Erythropoiesis occurs at the erythroblastic island where the central macrophages serve as niche cells to support proliferation, differentiation, and maturation of the erythroid cells.18,19,71-73 We and others have shown that hemin or hemolysis alters the functionality of macrophages.74,75 Thus, it is possible that hemin or hemolysis can also damage the ability of erythroblastic island macrophages to support erythropoiesis. Additionally, it has been reported that mesenchymal stromal cells may also support erythropoiesis.76,77 We have recently reported that murine BM mesenchymal stromal cells have reduced hematopoietic maintenance ability in SCD due to hemin/hemolysis-driven production of reactive oxygen species.78 Whether and how hemin/hemolysis may affect the ability of these niche cells to support erythropoiesis warrants further investigation.
In summary, we have shown impaired erythropoiesis in a mouse model of SCD along with diminished EPO response of erythroid cells. We have also identified hemolysis-induced IFNα as a potential underlying mechanism for the impaired EPO/EPOR in SCD, which could explain the need for higher doses of EPO in the setting of SCD.55,56,79 Although future studies are needed, optimal EPO dosing in SCD could be based on relative levels of circulating IFN-1 levels. Of note, increased IFN-1 activation can lead to exacerbated destruction of antibody sensitized RBCs.39 This raises the possibility that heightened IFN-1 signaling may lead to increased erythrophagocytosis as well as suppression of BM erythropoiesis, as seen in transfusion reactions associated with hyperhemolysis80,81 and even viral infections.82 Selective targeting of the IFN-1 pathway may, thus, offer new treatment options to reverse the anemia not only in SCD hyperhemolysis but also in viral infections with elevated IFN-1 levels.
Acknowledgments
This work was supported in part by National Institutes of Health, National Heart, Lung and Blood Institute grants P01HL149626 (K.Y., X.A.), R01HL140625 (C.L., X.A.), R56HL165202 (X.A., H. Zhong), R01HL165202 (X.A., H. Zhong), and R35HL161239 (K.Y.), BNY Mellon (C.L., K.Y.), and the Rose M Badgeley Residuary Charitable Trust.
Authorship
Contribution: Y.H., C.G., Y.L., and H. Zhang designed and performed experiments and analyzed the data; H. Zhang drafted materials and methods; S.W., X.G., H. Zhao, and W.B. performed experiments; F.V., C.L., P.S., A.M., L.L., and H. Zhong analyzed the data and edited the manuscript; and K.Y. and X.A. designed experiments, analyzed data, and wrote the manuscript.
Conflict-of-interest disclosure: The authors declare no competing financial interests.
Correspondence: Karina Yazdanbakhsh, New York Blood Center, 310 East 67th St, New York, NY 10065; email: kyazdanbakhsh@nybc.org; and Xiuli An, New York Blood Center, 310 East, 67th St, New York, NY 10065; email: xan@nybc.org.
References
Author notes
Y.H., C.G., Y.L., and H. Zhang contributed equally to this work.
Original data are available on request from corresponding author Xiuli An (xan@nybc.org).
The online version of this article contains a data supplement.
There is a Blood Commentary on this article in this issue.
The publication costs of this article were defrayed in part by page charge payment. Therefore, and solely to indicate this fact, this article is hereby marked “advertisement” in accordance with 18 USC section 1734.

This feature is available to Subscribers Only
Sign In or Create an Account Close Modal