

In Figure 4 on page 3000, the red curves should be blue and the blue curves should be red. In the color key in the upper right corner, a mavorixafor dose of 300 mg should be represented by a blue triangle and a dose of 400 mg by a red square. The corrected Figure 4 is shown below. The error does not affect the conclusions of the study.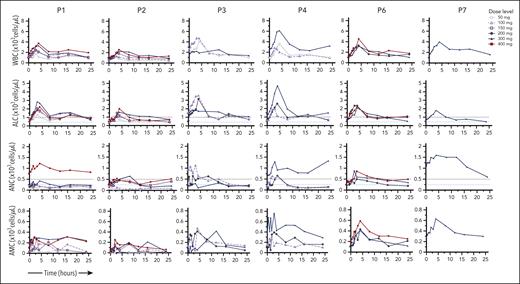 Close modal
Figure 4.

Dose-dependent hematologic improvement. Mavorixafor produces an initial peak elevation in WBC count, ALC, ANC, and AMC at ∼4 hours postdose. The ALC threshold of 1000 cells per microliter and the ANC threshold of 500 neutrophils per microliter are indicated by dashed lines.
Figure 4.
Dose-dependent hematologic improvement. Mavorixafor produces an initial peak elevation in WBC count, ALC, ANC, and AMC at ∼4 hours postdose. The ALC threshold of 1000 cells per microliter and the ANC threshold of 500 neutrophils per microliter are indicated by dashed lines.
In the HTML version of the article, Figure 4 is erroneously placed before Figure 3.

This feature is available to Subscribers Only
Sign In or Create an Account Close Modal