

Key Points
Emulating hypothetical randomized trials using large real-world data may be well suited to address the issues of prior RBC transfusion RCTs.
Our study suggests that transfusing RBC units stored for >1 or 2 weeks increases recipient mortality.

Abstract
Randomized controlled trials (RCTs) have found no evidence that the storage time of transfused red blood cell (RBC) units affects recipient survival. However, inherent difficulties in conducting RBC transfusion RCTs have prompted critique of their design, analyses, and interpretation. Here, we address these issues by emulating hypothetical randomized trials using large real-world data to further clarify the adverse effects of storage time. We estimated the comparative effect of transfusing exclusively older vs fresher RBC units on the primary outcome of death, and the secondary composite end point of thromboembolic events, or death, using inverse probability weighting. Thresholds were defined as 1, 2, 3, and 4 weeks of storage. A large Danish blood transfusion database from the period 2008 to 2018 comprising >900 000 transfusion events defined the observational data. A total of 89 799 patients receiving >340 000 RBC transfusions during 28 days of follow-up met the eligibility criteria. Treatment with RBC units exclusively fresher than 1, 2, 3, and 4 weeks of storage was found to decrease the 28-day recipient mortality with 2.44 percentage points (pp) (0.86 pp, 4.02 pp), 1.93 pp (0.85 pp, 3.02 pp), 1.06 pp (–0.20 pp, 2.33 pp), and −0.26 pp (–1.78 pp, 1.25 pp) compared with transfusing exclusively older RBC units, respectively. The 28-day risk differences for the composite end point were similar. This study suggests that transfusing exclusively older RBC units stored for >1 or 2 weeks increases the 28-day recipient mortality and risk of thromboembolism or death compared with transfusing fresher RBC units.
Introduction
Blood transfusion is an integral part of health care, with >100 million red blood cell (RBC) units transfused worldwide annually.1 RBCs undergo biochemical and physical changes during storage known as “storage lesions.”2,3 The clinical impact of the RBC storage lesion concept has been a matter of controversy since its introduction in the early 1980s. Numerous observational studies and meta-analyses have documented posttransfusion complications of older RBC units, including multiple organ failure, sepsis, and increased mortality.4-6 Unfortunately, these studies do not provide sufficient information regarding storage thresholds and when RBC units become hazardous.7
Several randomized controlled trials (RCT) have studied the effect of RBC storage time on transfused patient outcomes.8-11 A recent systematic review and meta-analysis identified 16 RCTs including a total of 31 359 patients.7 Transfusing older RBC units was not found to be statistically significantly associated with death (relative risk, 1.04: 95% confidence interval, 0.98-1.09; P = .20). Critique of these RCTs has directed focus on inherent clinical, methodologic, and statistical problems that may have affected interpretation of the results.12-14 A fundamental question that remains unanswered is when the RBC storage phenotype may become detrimental to survival. Ideally, large RCTs could answer this question; however, performing multiple RCTs with different storage duration thresholds for fresher and older RBC units would be challenging and likely unfeasible. Furthermore, the RBC stock levels are beyond the complete control of researchers, which complicates appropriate execution and analyses of such trials.12 Moreover, the power of previous RCTs may have been insufficient to detect small effects.13 Nevertheless, small effects may impose a significant impact considering the large number of RBC transfusions performed annually.2 Large longitudinal observational studies may be a potential alternative.15
Here we propose that inverse probability weighting and the approach of emulating hypothetical randomized trials from the field of causal inference may be well suited to address the issues of prior RBC transfusion studies.15-18 We use extensive real-world data and marginal structural models to estimate the causal effect of transfusing RBC units with different storage durations.
Methods
Emulated randomized trials and outcomes
This longitudinal observational study followed up patients up to 28 days after their first in-hospital RBC transfusion. Inverse probability weighting was used to emulate several hypothetical trials in which patients were randomized to treatment with exclusively older or fresher RBC units. The thresholds defining older and fresher RBC units were set at 1, 2, 3, and 4 weeks of storage, respectively. Under each trial emulation, the patients received the same number of RBC units as they had actually received. The primary outcome was all-cause mortality, and the secondary outcome was the composite end point of death or development of thromboembolic events. We defined posttransfusion thromboembolic events as recipients assigned any International Classification of Diseases, 10th Revision, diagnosis of I26, I74, I81, or I82 after the baseline transfusion.19 Average treatment effects (ATEs) were estimated between treatments with exclusively older vs fresher RBC units.
Data sources
The cohort was based on a blood transfusion database of the Capital Region of Denmark, the Danish National Patient Registry,20 and the Danish Registry of Causes of Death (DRCD).21 The unique national registration number (ie, the CPR) enabled linkage between the databases and registries.22 The study period was from 1 January 2008 to 10 April 2018. The blood transfusion database provided: the CPR, age, sex, and ABO/RhD blood group of RBC donors and recipients; the time of transfusions and donations (year, date, and hour); and at which hospital the transfusions were performed. The Danish National Patient Registry provided diagnosis dates back in time until 1 January 1977. The DRCD provided the dates of the recipient's deaths.
Eligibility criteria
We included patients aged ≥18 years, receiving at least one RBC transfusion between 2009 and 2018, with no history of RBC transfusions within the past year. A washout period of 1 year was chosen to limit any potential remaining effects of previous transfusions. The earliest transfusion episode meeting the eligibility criteria was defined as the baseline transfusion. All transfusion episodes onward from the baseline transfusion and up to 28 days of follow-up were included and defined a transfusion history. The current transfusion practice in the Capital Region of Denmark is to use massive transfusion packages (MTPs)23 with RBC units stored for <10 days to patients experiencing massive bleedings. Patients requiring transfusion with an MTP upon their baseline transfusion were therefore not included in the study. Patients were only allowed to participate once. If the eligibility criteria were met multiple times, the earliest baseline transfusion episode meeting the eligibility criteria was included. Inclusion ended 1 month before the end of the transfusion database (10 March 2018) to enable complete follow-up. Follow-up ended if an MTP was prescribed, at the occurrence of the outcome, or after 28 days, whichever occurred first. Only leukoreduced RBC transfusions were included in the study (implemented on 1 January 2009). Transfusion episodes with missing data for the hospital of admission were excluded from the analyses.
Study assumptions
When emulating randomization of treatment (exchangeability), it is necessary to make assumptions about what affects the selection of fresher or older RBC units in the blood banks.15,18 We visualized our study assumptions by using a causal directed acyclic graph (DAG) from which study confounding was identified (supplemental Figure 1, available on the Blood Web site).24,25 The confounding visualized in the DAG is, for example, that the hospital of admission is linked to both patient mortality and treatment with fresher or older RBC units because both the patients’ disease severity and blood-banking storage capacities vary across hospitals. This “center effect” is illustrated in supplemental Table 1.
RBC unit allocation follows the first-in-first-out (FIFO) policy in which the oldest blood type–compatible RBC unit is selected.26 The only exception is patients with severe bleedings who, in some cases, are transfused with an MTP of 4 or 5 RBC units, each with a storage time <10 days.23 Therefore, receiving an MTP is strongly associated with RBC storage time and mortality. Transfusion episodes with MTPs at baseline were thus excluded, and follow-up was censored upon transfusion of an MTP. Because this exclusion happened at baseline, no bias was introduced, and we further adjusted for potential differences from MTP censoring between the trial arms using inverse probability of censoring weighting.27 Fresher MTPs were implemented on 10 October 2014, and thus not applicable to the entire study period. The FIFO policy further implies that patients receiving many transfusions on the same day are more likely to receive fresher RBC units, which, if not adjusted for, could bias the analyses because receiving many transfusions is also associated with disease severity and death.
Except for MTPs, the Danish blood banks do not prioritize fresher RBC units based on any patient characteristics. However, indirectly, the patient’s blood type may affect the storage time of the transfused RBC units because blood type rarity can affect the stock levels of matching RBC units. Furthermore, the ABO blood group has been associated with differences in susceptibility to cardiovascular disease.28
Using the DAG, we identified that the minimal sufficient adjustment set29 of covariates that should be adjusted for to obtain unbiased estimates was: calendar period, patient blood type, the hospital of transfusion, MTP prescription on day k, the number of RBC units received on day k, and the number of transfusions received on day k of a different ABO/RhD blood type than that of the recipient (supplemental Figure 1). Furthermore, to increase robustness from potential random variability when estimating the inverse probability weights, we adjusted for additional covariates as listed in the following sections.
Marginal structural models
Marginal structural models were used to estimate the causal effects of the older and fresher RBC treatment strategies on the cumulative risk of death and the composite event of thromboembolic events or death up to 28 days after the baseline transfusion. Inverse probability weighting was used to adjust for confounding and MTP censoring as identified by the DAG (supplemental Figure 1). The data set was arranged so that each transfusion history of the patients was split into consecutive person-day periods, one per day k until the end of follow-up.
Inverse probability of treatment weights (IPTWs) were estimated by assuming that the selection of RBC units in the blood banks follows a binomial distribution in which either a fresher or an older RBC unit can be selected. On each day where transfusions were received, a logistic regression model was used to estimate the probability of choosing a fresher RBC unit given the baseline covariates: ABO/RhD blood group of the recipient (each blood group as a separate categorical), recipient sex, the year and month of the baseline transfusion (using a cosine and sine transformation for the month covariate), recipient age at baseline, and the time-varying covariates (hospital of transfusion [as categorical], Charlson comorbidity score, the number of transfusions received on day k, the number of transfusions received on day k of a different ABO/RhD blood type than that of the recipient, and the total number of transfusions received up until day k).30 Continuous covariates were modeled as restricted cubic splines with 3 to 5 knots. We estimated the patient-specific probability of the treatment received on each day k using a binomial probability mass function given the estimated probability of receiving a fresher RBC unit, the number of transfusions received on day k, and the number of fresher RBC units received on day k. These estimated probabilities of treatment were used to obtain time-varying stabilized IPTWs (supplementary Methods).31
Inverse probability of censoring weights (IPCWs) were estimated by using a logistic regression model adjusting for the same confounding as when estimating the IPTWs.27 In addition, the model also included the regressors: time of follow-up (as a linear and a quadratic term)16 and a fresher/older RBC ratio difference defined as the difference between the number of fresher and older RBC units received up to day k divided by the total number of transfusion received up to day k (supplementary Methods). The IPTWs and IPCWs were truncated at the second and the 98th percentile.32 We verified that the mean of the stabilized IPWs approximated 1.
Hereafter, a logistic regression model weighted with the IPTWs and IPCWs (a marginal structural model) was used to estimate the conditional probability of remaining free of the outcomes at each day k given the time of follow-up, the fresher/older RBC ratio difference, and the total number of transfusions received until day k. We allowed for time-varying risks by adding a product term between the treatment covariates and time of follow-up. Lastly, we predicted the cumulative probability of remaining free of the outcomes under each treatment strategy on each day of follow-up, regardless of the patients’ actual exposure. Bootstrapping with 500 iterations was used to obtain 95% confidence intervals for all estimates.
Sensitivity analysis
For sensitivity analyses, we replicated the main analyses with different variations (eg, where the total number of transfusions received was modeled with spline knots placed at higher values)33 (supplementary Methods). In addition, to validate the statistical approach, we repeated the analyses on a data set in which the number of fresher RBC units received at each day k was manipulated by assigning it entirely at random instead of using the actual storage time.
Statistical analyses were performed in R (version 3.6.2) and data processing in python (anaconda3/4.4.0) using Snakemake (version 6.9.1).34 DAGitty25 was used to draw DAGs and to estimate the minimal sufficient adjustment set. The analyses code is available through github.com/peterbruun/RBC_storage_time.
Data sharing
The study was conducted by using anonymized personal sensitive patient data not publicly accessible. The study was approved by the Danish Patient Safety Authority (3–3013–1731), the Danish Data Protection Agency (DT SUND 2016–50 and 2017–57), and the Danish Health Data Authority (FSEID 00003092 and FSEID 00003724).
Results
In total, 89 799 patients receiving 342 296 transfusions met the eligibility criteria for the mortality analyses (Figure 1). About 0.15% of transfusions had missing data for the hospital of admission and were excluded from the analyses. Death occurred in 12.7% of the patients during a mean ± standard deviation follow-up of 26.7 ± 6.67 days (Table 1). Censoring of follow-up due to the prescription of an MTP was applied to 0.2% of patients. The study population characteristics for the composite end point analyses were similar (supplemental Table 2). The RBC storage distributions in each of the emulated trial arms are shown in supplemental Figure 2.
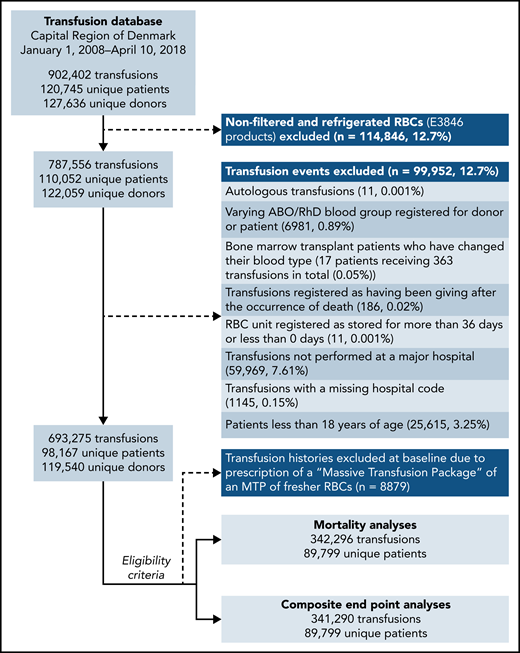
Flowchart of eligible patients and transfusion records, the Capital Region of Denmark transfusion database, 2008 to 2018.
Flowchart of eligible patients and transfusion records, the Capital Region of Denmark transfusion database, 2008 to 2018.
Study population characteristics for the mortality analyses (N = 89 799)
| Characteristic | Value |
|---|---|
| Patient age, y | |
| Mean ± SD | 68.8 ± 16.6 |
| Median [1st, 99th] | 71.0 [23.0, 96.0] |
| Patient sex | |
| Male | 40 490 (45.1%) |
| Female | 49 309 (54.9%) |
| Patient Charlson comorbidity score | |
| Mean ± SD | 2.68 ± 2.46 |
| Median [1st, 99th] | 2.00 [0, 10.0] |
| ABO blood group patient | |
| 0 | 37 022 (41.2%) |
| A | 39 101 (43.5%) |
| AB | 3879 (4.3%) |
| B | 9797 (10.9%) |
| RhD blood group patient | |
| Negative | 14 108 (15.7%) |
| Positive | 75 691 (84.3%) |
| Hospital | |
| Bispebjerg | 11 192 (12.5%) |
| Bornholms | 2208 (2.5%) |
| Herlev | 19 589 (21.8%) |
| Hvidovre | 16 628 (18.5%) |
| Nordsjaellands | 13 628 (15.2%) |
| Rigshospitalet | 26 554 (29.6%) |
| Type of patient | |
| Hematology | 3843 (4.3%) |
| Oncology | 5914 (6.6%) |
| Thoracic surgery | 5205 (5.8%) |
| Other | 74 837 (83.3%) |
| Follow-up time | |
| Mean ± SD | 26.7 ± 6.67 |
| Median [1st, 99th] | 29.0 [1.00, 29.0] |
| MTP censoring | |
| Yes | 180 (0.2%) |
| No | 89 619 (99.8%) |
| Outcome within follow-up | |
| Yes | 11 408 (12.7%) |
| No | 78 391 (87.3%) |
| Total no. of RBCs received | |
| Mean ± SD | 3.81 ± 5.07 |
| Median [1st, 99th] | 2.00 [1.00, 23.0] |
| Percentage of RBCs stored for maximum 1 wk | |
| Mean ± SD | 5.14 ± 18.3 |
| Median [1st, 99th] | 0 [0, 100] |
| Percentage of RBCs stored for maximum 2 wk | |
| Mean ± SD | 41.2 ± 44.1 |
| Median [1st, 99th] | 25.0 [0, 100] |
| Percentage of RBCs stored for maximum 3 wk | |
| Mean ± SD | 72.9 ± 40.2 |
| Median [1st, 99th] | 100 [0, 100] |
| Percentage of RBCs stored for maximum 4 wk | |
| Mean ± SD | 88.8 ± 28.0 |
| Median [1st, 99th] | 100 [0, 100] |
SD, standard deviation.
The average 28-day mortality was 2.44 percentage points (pp) (0.86 pp, 4.02 pp) higher when transfusing RBC units stored for >1 week compared with RBC units stored for ≤1 week (Table 2; supplemental Figures 3-4). For the trials with storage thresholds of 2, 3, and 4 weeks, the 28-day mortality difference was 1.93 pp (0.85 pp, 3.02 pp), 1.06 pp (–0.20 pp, 2.33 pp), and −0.26 pp (–1.78 pp, 1.25 pp), respectively (Figures 2-3; Table 2). The 28-day mortality differences estimated from the 1- and 2-week threshold trials correspond to a number-needed-to-harm of 41 (117, 25) and 52 (119, 34) (supplemental Table 3). The 28-day risk differences estimated for the composite end point were similar to those of the mortality analyses (supplemental Figures 3-4; supplemental Tables 4-5). The sensitivity analyses where the actual storage time had been manipulated showed no statistically significant ATEs (supplemental Figures 5-6). The sensitivity analyses with variations to the main analyses obtained similar estimates (supplemental Figures 7-9). The sensitivity analysis using splines with knots placed at higher values was not a good fit for our data (supplemental Figure 10).33
Estimated average treatment effect between treatment with exclusively fresher vs older RBC units in the mortality analyses on days 7, 14, 21, and 28 after the baseline transfusion
| Day | Risk difference (pp) (95% CI) | |||
|---|---|---|---|---|
| 1-Week threshold | 2-Week threshold | 3-Week threshold | 4-Week threshold | |
| 7 | 0.07 (–0.94, 1.08) | −0.11 (–0.68, 0.46) | 0.02 (–0.66, 0.70) | −0.28 (–1.18, 0.61) |
| 14 | 1.07 (–0.17, 2.32) | 0.54 (–0.22, 1.30) | 0.48 (–0.43, 1.39) | −0.39 (–1.55, 0.76) |
| 21 | 1.91 (0.48, 3.34) | 1.24 (0.30, 2.18) | 0.87 (–0.25, 1.98) | −0.39 (–1.74, 0.96) |
| 28 | 2.44 (0.86, 4.02) | 1.93 (0.85, 3.02) | 1.06 (–0.20, 2.33) | −0.26 (–1.78, 1.25) |
Boldfaced risk difference estimates indicate statistical significance at a 95% confidence level.
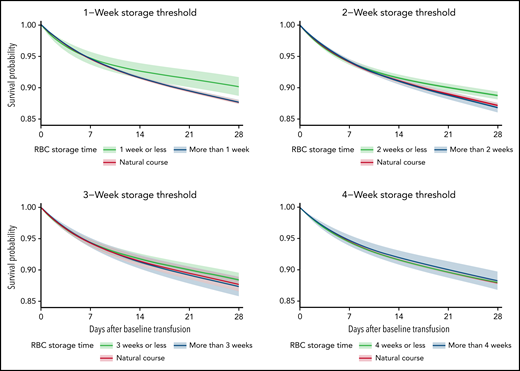
The estimated average survival probability under each treatment strategy (fresher vs older RBC units) and for the current practice (natural course) up to 28 days after the baseline transfusion with 95% confidence intervals for the mortality analyses.
The estimated average survival probability under each treatment strategy (fresher vs older RBC units) and for the current practice (natural course) up to 28 days after the baseline transfusion with 95% confidence intervals for the mortality analyses.

The estimated average treatment effect between treatment with exclusively fresher vs older RBC units up to 28 days after the baseline transfusion with 95% confidence intervals for the mortality analyses.
The estimated average treatment effect between treatment with exclusively fresher vs older RBC units up to 28 days after the baseline transfusion with 95% confidence intervals for the mortality analyses.
Discussion
Real-world data from an extensive Danish transfusion database were used to emulate hypothetical randomized trials comparing the safety of transfusing older RBC units vs fresher RBC units. Our results suggest that transfusing exclusively older RBC units increases the 28-day mortality and risk of thromboembolism or death in recipients when the storage threshold for older RBC units is defined as >1 or 2 weeks.
Our results are not in agreement with previous RCTs and meta-analyses, which found no evidence of adverse storage time effects.7-11,35 However, as emphasized by Trivella et al,12 these RCTs suffer from study design and analysis issues that question their results. These issues are mainly attributed to inherent difficulties in conducting RBC transfusion RCTs, which is the rationale for this study. In most previous RCTs, the storage time distributions in the 2 trial arms were overlapping, leading to reduced statistical power.12 This is attributed to the unavoidable variability of blood bank stock levels. Emulating hypothetical randomized trials enables complete control of the treatment in both trial arms, hereby improving the statistical power (supplemental Figure 2). Furthermore, because our methodology does not rely on the performance of expensive and time-consuming RCTs, we could leverage the statistical power of large observational data. This enabled us to detect small but clinically relevant effects, which may not have been possible with the study sizes of previous RCTs.13 Importantly, the power of the RCTs also depends on how the risk varies by RBC storage duration; for example, the risk could increase linearly with longer storage duration or follow a sharp or smooth sigmoid-shaped curve centered after a specific length of storage, as shown by Pereira.13 However, because the temporal risk pattern is unknown, the power of previous RCTs will have been compromised if a suboptimal storage threshold was used. Furthermore, the difference in thresholds used in previous RCTs complicates the interpretation of any meta-analysis.7 Our methodology enabled easy replication of trials in which various storage time thresholds were used, thus addressing the issue of suboptimal threshold selection. Lastly, the RCTs included different patient groups (eg, cardiac surgery or critical care patients) and used different exclusion criteria, which may explain the contrasting results. We used real-world data with broad inclusion criteria where, compared with previous RCTs, the patients’ participation was not decided based on a treating physician’s medical evaluation and numerous exclusion criteria.8,11
A previous large observational study found no association between RBC storage and mortality.36 The difference in results may be attributed to the use of a causal inference methodology in our analyses. Furthermore, Halmin et al reported hazard ratios, which complicates causal interpretation.37,38
The estimated risk differences and corresponding number-needed-to-harm are clinically relevant when considering the large number of patients treated with RBC transfusions yearly. In the United States, where ∼5 million people are transfused with RBCs every year,2 the increased mortality observed in the trial arm of patients transfused with older RBC units would correspond to ∼122 000 (43 000, 201 000) and 96 500 (42 500, 151 000) more deaths 28 days after baseline for the 1- and 2-week thresholds, respectively. In comparison, nearly 270 000 Americans die of sepsis annually.39
Given that the shelf life of RBC units is 42 days in the United States and only 35 days in Denmark, the effects might be more prominent. It is unknown if the observed effect is attributed to older RBCs being harmful or fresher RBCs having more beneficial effects. Importantly, our findings may not generalize to patients with very severe bleeding requiring an MTP as they were excluded from our analyses.
We assumed that all confounding was contained within the DAG and, therefore, that no unmeasured confounding affected the estimates after adjustment. However, if the adjustment by inverse probability weighting was insufficient, our estimates will be biased. Because RBC units of specific storage duration are not restricted to certain patient groups but allocated by the FIFO policy (except for MTPs), we assumed that any level of treatment (fresher/older RBCs) was available to all patients (the positivity condition). However, some random violation of positivity was observed, leading to a few very large and small IPTWs that were handled by truncating the estimated IPWs.32 All transfused RBC units in the study were cleaned, packed, and stored following the same standards (RBC product code E3846), and we therefore assumed consistency in treatment (the consistency condition). We assumed that any patient not registered in the DRCD survived the follow-up period.21 We also assumed that the RBC storage time had no measurement error as the registration of RBC storage time is handled automatically by scanning bar codes. We sought to reduce any potential bias from model misspecification by using splines to model all continuous covariates and the time-axis as linear and quadratic terms.16,18
Given that our study assumptions hold true, the estimated effects will have a causal interpretation. However, it is not possible to test whether our assumptions are correct, and if unrecognized confounding, severe model misspecifications, measurement errors, or selection bias exists, our claim of causality will not apply.18,40
In conclusion, by emulating randomized trials using real-world data, we found that transfusing exclusively older RBC units stored for >1 or 2 weeks increases the 28-day recipient mortality and risk of thromboembolism or death compared with transfusing fresher RBC units.
Acknowledgments
This study was performed as a part of the CAG (Clinical Academic Group) Center for Endotheliomics under the Greater Copenhagen Health Science Partners.
The study was supported by the Novo Nordisk Foundation (grants NNF14CC0001 and NNF17OC0027594) and the Innovation Fund Denmark (grant 5153-00002B). The funders played no role in the conduct of the study.
Authorship
Contribution: P.B.-R. and P.I.J. conceived of the presented idea; P.B.-R. and P.K.A. designed the research; P.B.-R. analyzed the data and wrote the manuscript with support from all coauthors; and all authors discussed the results and contributed to the final manuscript.
Conflict-of-interest disclosure: P.I.J. reports ownership in Trial-Laboratory AB, Endothel Pharma ApS, TissueLink ApS, and MoxieLab ApS outside the submitted work. S.B. reports ownerships in Intomics A/S, Hoba Therapeutics Aps, Novo Nordisk A/S, Lundbeck A/S, and ALK A/S; and managing board memberships in Proscion A/S and Intomics A/S. The remaining authors declare no competing financial interests.
Correspondence: Pär Ingemar Johansson, Capital Region Blood Bank, Rigshospitalet, Blegdamsvej 9, 2100 Copenhagen, Denmark; e-mail: per.johansson@regionh.dk.
Data access can be granted by contacting the following authorities: the Danish Patient Safety Authority, the Danish Data Protection Agency, and the Danish Health Data Authority.
The online version of this article contains a data supplement.
The publication costs of this article were defrayed in part by page charge payment. Therefore, and solely to indicate this fact, this article is hereby marked “advertisement” in accordance with 18 USC section 1734.

This feature is available to Subscribers Only
Sign In or Create an Account Close Modal