

Key points
Igf2bp2 regulates the metabolism- and protein synthesis–related genes necessary for the full function of HSCs in young adult mice.
Both the activity of Igf2bp2 at young age and the aging-related loss of Igf2bp2 gene function contribute to HSC aging.

Abstract
Increasing evidence links metabolism, protein synthesis, and growth signaling to impairments in the function of hematopoietic stem and progenitor cells (HSPCs) during aging. The Lin28b/Hmga2 pathway controls tissue development, and the postnatal downregulation of this pathway limits the self-renewal of adult vs fetal hematopoietic stem cells (HSCs). Igf2bp2 is an RNA binding protein downstream of Lin28b/Hmga2, which regulates messenger RNA stability and translation. The role of Igf2bp2 in HSC aging is unknown. In this study, an analysis of wild-type and Igf2bp2 knockout mice showed that Igf2bp2 regulates oxidative metabolism in HSPCs and the expression of metabolism, protein synthesis, and stemness-related genes in HSCs of young mice. Interestingly, Igf2bp2 expression and function strongly declined in aging HSCs. In young mice, Igf2bp2 deletion mimicked aging-related changes in HSCs, including changes in Igf2bp2 target gene expression and impairment of colony formation and repopulation capacity. In aged mice, Igf2bp2 gene status had no effect on these parameters in HSCs. Unexpectedly, Igf2bp2-deficient mice exhibited an amelioration of the aging-associated increase in HSCs and myeloid-skewed differentiation. The results suggest that Igf2bp2 controls mitochondrial metabolism, protein synthesis, growth, and stemness of young HSCs, which is necessary for full HSC function during young adult age. However, Igf2bp2 gene function is lost during aging, and it appears to contribute to HSC aging in 2 ways: the aging-related loss of Igf2bp2 gene function impairs the growth and repopulation capacity of aging HSCs, and the activity of Igf2bp2 at a young age contributes to aging-associated HSC expansion and myeloid skewing.
Introduction
Metabolic activity contributes to the maintenance of stem cell function by controlling cell proliferation or quiescence, self-renewal, and differentiation.1-3 However, metabolism, cell growth–controlling pathways, and protein synthesis4-6 can also lead to functional exhaustion of hematopoietic stem cells (HSCs). Pathways that control metabolism, growth, and protein synthesis may thus have an ambivalent role, in that they control the full functionality of HSCs but at the cost of driving HSC aging. One of the upstream regulators of metabolic activity is the Lin28/let-7 pathway that controls the expression of cell cycle regulators, mitochondrial protein encoding genes, and glucose metabolism.7,8 The pathway controls the induction of metabolic pathways and growth signaling, such as IGF, phosphatidylinositol 3-kinase (PI3K), and mTOR.9 Downstream effectors of the Lin28/let-7 pathway are Hmga2 (encoding for a chromatin modifier) and Igf2bp2 (also known as Imp2), which was originally identified as a fetal growth factor and a binding partner of Igf2 messenger RNA (mRNA).10,11 Additional targets of IGF2BP2 have been identified, including major regulators of cellular metabolism and mitochondrial function, such as Igf1r, c-myc, Sp1,12Lamb2,13 and Ucp1,14 as well as various noncoding RNAs.15,16
In the hematopoietic system, Lin28 is expressed during development but declines in adult hematopoiesis.17 The postnatal suppression of Lin28 limits self-renewal and changes differentiation of HSCs at the transition from fetal to adult hematopoiesis. Overexpression of Lin28a/b or its downstream target Hmga2 enhances the self-renewal capacity of adult HSCs to levels similar to those of fetal HSCs, whereas Hmga2 knockout abrogates the elevated self-renewal of fetal HSCs.18,19 In addition, Lin28 controls fetal B-lymphopoiesis17 and the differentiation of adult HSCs.20 However, the possible role of this pathway in HSC aging has not been explored. In this study, we investigated the aging of HSCs in homozygous germline Igf2bp2-knockout mice (Igf2bp2−/−) and wild-type mice (Igf2bp2+/+). The results reveal a new role of Igf2bp2 in regulating the expression of metabolism, protein synthesis, and stemness-related genes in HSCs of young mice, which is necessary for young HSCs to have full colony-forming capacity in culture or to repopulate hematopoiesis in transplant-recipient mice. Igf2bp2 expression and its gene regulatory function is almost completely lost during aging. The analysis of Igf2bp2−/− mice indicates that both Igf2bp2-dependent gene regulation in young HSCs and the decline of Igf2bp2-dependent function in aged HSCs contribute to the development of distinct phenotypes of HSC aging.
Materials and methods
Mice
Igf2bp2-knockout (Igf2bp2−/−) mice carry an inverted exon 3, which leads to a frameshift, a premature stop codon, and a complete knockout of the gene-encoded protein expression (supplemental Figure 1; available on the Blood Web site).
Flow cytometry
Details of the procedures for cell isolation and staining combination are provided in the supplemental Methods and supplemental Figure 2.
In vivo transplantation assay
Freshly purified HSCs (with marker combinations: 100 HSCs from a young donor or 1000 HSCs from an old donor; CD45.2+) were transplanted into lethally γ-irradiated (12 Gy) recipients (CD45.2+; 4 months old) by IV injection, along with 1 × 10⁶ bone marrow (BM) cells from age-matched competitor mice (CD45.1+). After transplantation, all recipients were treated with antibiotic water (0.01%; enrofloxacin [Baytril]) for 1 week. The chimerism and lineage composition of peripheral blood (PB) and BM of recipient mice was analyzed by fluorescence-activated cell sorting at various time points.
HSC colony-forming assay
Freshly isolated HSCs were seeded in methylcellulose medium (1.2 mL per well in a 6-well plate; M3434; Stem Cell Technologies) at 500 cells per duplicate. For serial rounds of plating, cells harvested from the previous plating were seeded at 5000 cells per duplicate. The number of colonies was scored after 10 days.
Homing assay
A previous protocol21 was used to examine the homing potential of myeloid-biased HSCs. Details are provided in the supplemental Methods.
Respirometry analysis
Freshly purified HSPCs were used for the Seahorse Cell Mito Stress assay and Real-time ATP Production Assay (Agilent), according to the manufacturer’s protocols (supplemental Methods).
Bulk and scRNA-seq
Bulk and single-cell RNA sequencing (scRNA-seq) were performed by the Core Facility Sequencing at Fritz Lipmann Institute (details in supplemental Methods).
Statistical analysis
The numbers of biological replicates and experimental repetitions are stated in the figure legends. Statistical tests and corrections for multiple testing were performed as indicated in the figure legends. The normality of the data, whenever required by the test method, was determined by the Shapiro-Wilk test. The significance level was set at P ≤ .05 for test results, unless otherwise specified. All statistical analyses were performed with GraphPad Prism 7.01 software, except for RNA-seq and proteomic analysis (supplemental Methods) or as specifically indicated.
Lentivirus infection of HSCs, cell culture and inhibitor treatment, MitoRed measurement, and proteomics analysis of Igf2bp2-overexpressing stem cells
Details of these experiments and analyses are provided in supplemental Methods.
Results
Lin28b/Hmga2/Igf2bp2 expression and downstream pathways decline in HSPCs during aging
mRNA expression was analyzed in freshly isolated CD150+ (high and low) HSCs (CD150+CD34−LSK) and multipotent progenitors (MPPs; CD34+LSK) of young and old C57Bl/6JRj mice. Lin28b, Hmga2, and Igf2bp2 mRNAs were expressed in HSCs and MPPs of young mice, but strongly declined during aging (Figure 1A-B). Igf2bp2 is a mediator of Lin28/Hmga2-regulated metabolic activity and growth.7 In line with the Igf2bp2 expression data, immunofluorescence staining of HSPCs revealed a significant reduction in p-AKT in the HSCs and MPPs during aging (Figure 1C-F). In addition, fluorescence-activated cell sorting analysis of p-mTOR expression showed a significant decrease in mTOR activity in aging HSCs but not in MPPs (Figure 1G-H).
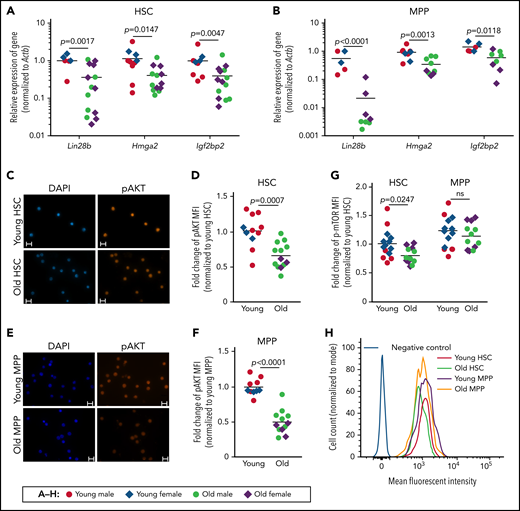
Aged HSCs exhibit decreased expression of Lin28b-Hmga2-Igf2bp2 mRNAs and reduced activity of the PI3K/AKT/mTOR pathway. Quantitative reverse transcription-polymerase chain reaction (qRT-PCR), immunofluorescence, and fluorescence-activated cell sorting (FACS) analyses of freshly isolated total CD150+ (high and low) HSCs (CD150+CD34−LSK) and MPPs (CD34+LSK) from young mice (range: 3-6 months) and old mice (range: 22-28 months). (A-B) The relative mRNA expression of Lin28b, Hmga2, and Igf2bp2 (relative to Actb) was analyzed by qRT-PCR in HSCs (A) and MPPs (B). Five to 14 mice per group were analyzed in 2 independent experiments. For each gene and cell type, one sample of young wild-type mice was set to 1 and used as callibrator. Data were log2 transformed and analyzed by Welch’s t test. (C-F) Representative micrographs and quantification of the MFI of p-AKT staining in HSCs (C-D) and MPPs (E-F). The MFI of young mice was normalized to 1 for each of the 2 cell populations. A total of 10 to 13 mice per age group were analyzed in 2 independent experiments. Statistical significance was assessed by Welch’s t test. (C,E) Bars represent 10 μm. (G-H) Quantification and representative FACS profiles of the fluorescence intensity of p-mTOR in HSCs and MPPs. (G) The mean of the MFI of HSCs from young mice was set to 1. A total of 12 to 14 mice per group were analyzed in 2 independent experiments. Statistical significance was assessed by 2-way analysis of variance on log-transformed data followed by pairwise t tests with Sidak’s correction for multiple comparisons. (H) Representative FACS profiles of HSCs and MPPs from young and old mice. (A-B,D,F-G) Horizontal lines represent the mean of the indicated group. MFI, mean fluorescence intensity; ns, nonsignificant.
Aged HSCs exhibit decreased expression of Lin28b-Hmga2-Igf2bp2 mRNAs and reduced activity of the PI3K/AKT/mTOR pathway. Quantitative reverse transcription-polymerase chain reaction (qRT-PCR), immunofluorescence, and fluorescence-activated cell sorting (FACS) analyses of freshly isolated total CD150+ (high and low) HSCs (CD150+CD34−LSK) and MPPs (CD34+LSK) from young mice (range: 3-6 months) and old mice (range: 22-28 months). (A-B) The relative mRNA expression of Lin28b, Hmga2, and Igf2bp2 (relative to Actb) was analyzed by qRT-PCR in HSCs (A) and MPPs (B). Five to 14 mice per group were analyzed in 2 independent experiments. For each gene and cell type, one sample of young wild-type mice was set to 1 and used as callibrator. Data were log2 transformed and analyzed by Welch’s t test. (C-F) Representative micrographs and quantification of the MFI of p-AKT staining in HSCs (C-D) and MPPs (E-F). The MFI of young mice was normalized to 1 for each of the 2 cell populations. A total of 10 to 13 mice per age group were analyzed in 2 independent experiments. Statistical significance was assessed by Welch’s t test. (C,E) Bars represent 10 μm. (G-H) Quantification and representative FACS profiles of the fluorescence intensity of p-mTOR in HSCs and MPPs. (G) The mean of the MFI of HSCs from young mice was set to 1. A total of 12 to 14 mice per group were analyzed in 2 independent experiments. Statistical significance was assessed by 2-way analysis of variance on log-transformed data followed by pairwise t tests with Sidak’s correction for multiple comparisons. (H) Representative FACS profiles of HSCs and MPPs from young and old mice. (A-B,D,F-G) Horizontal lines represent the mean of the indicated group. MFI, mean fluorescence intensity; ns, nonsignificant.
Igf2bp2 controls metabolism, protein synthesis, and stemness-related genes in HSCs of young mice, but its function is lost in HSCs of aged mice
In mice, the total population of CD150+ HSCs (CD150+CD34-LSK) can be further separated, based on the level of CD150 expression, into HSCs with myeloid-biased differentiation (CD150highCD34−LSK) or balanced (lymphoid/myeloid) differentiation (CD150lowCD34−LSK). Studies have revealed that myeloid-biased (CD150high) HSCs exhibit a more latent repopulation but enhanced self-renewal compared with balanced (CD150low) HSCs.22 To identify Igf2bp2-controlled genes in HSCs, mRNA sequencing was conducted on myeloid-biased HSCs from young and aged Igf2bp2−/− vs Igf2bp2+/+ mice. This subpopulation of HSCs was chosen because it showed the highest expression of Igf2bp2 (supplemental Figure 3A). In line with results of a previous study,23 mRNA profiles showed clustering separation of myeloid-biased HSCs from old vs young mice (Figure 2A). Interestingly, Igf2bp2 gene status separated the clustering of myeloid-biased HSCs from the young mice but not those from the old mice (Figure 2A). Concordantly, a much larger number of differentially expressed genes (DEGs) was identified in myeloid-biased HSCs of Igf2bp2−/− vs Igf2bp2+/+ mice at a young age (1421 DEGs) compared with old age (26 DEGs) (Figure 2B). These data indicate that Igf2bp2 regulated mRNA expression in myeloid-biased HSCs of the young mice, but its gene regulatory function was lost during aging.
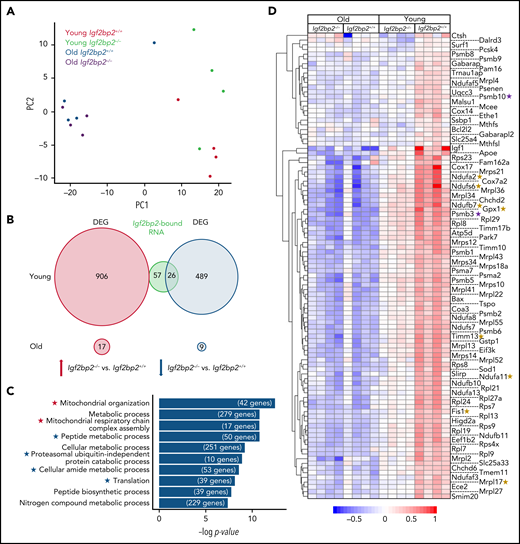
Igf2bp2 deletion decreases the expression of genes related to mitochondrial metabolism and protein synthesis in young myeloid-biased HSCs. Myeloid-biased HSCs (CD150highCD34−LSK) were isolated from young (3 months) and aged (range: 22-26 months) Igf2bp2+/+ and Igf2bp2−/− male mice. HSCs from individual mice were analyzed by RNA-seq (n = 4 mice per group). DEGs were identified by the DESeq2 R package (v1.28.1), using the Benjamini-Hochberg–adjusted P < .05 as a cutoff. In myeloid-biased HSCs from young Igf2bp2−/− vs Igf2bp2+/+ mice, 1421 DEGs were identified, compared with only 26 DEGs in myeloid-biased HSCs from old Igf2bp2−/− vs Igf2bp2+/+ mice. (A) Principal component analysis (PCA) found that the first PC separated the HSC transcriptomes based on age and that the second PC separated Igf2bp2 gene status in young mice, but not in the HSCs from old mice. (B) A Venn diagram depicting the number of upregulated (red circle) and downregulated (blue circle) DEGs in myeloid-biased HSCs of Igf2bp2−/− vs Igf2bp2+/+ from young (top) or old (bottom) mice. The DEGs in myeloid-biased HSCs of young Igf2bp2−/− vs Igf2bp2+/+ mice overlapped with 83 mRNAs (green circle) that had been identified to be directly bound by IGF2BP2 in brown fat.14 Note that mRNA species that are bound by IGF2BP2 exclusively overlapped the downregulated DEGs in myeloid-biased HSCs of Igf2bp2−/− vs Igf2bp2+/+ mice. (C) Bar graph depicts the top 10 GO terms enriched for downregulated DEGs in young Igf2bp2−/− mice vs Igf2bp2+/+ mice (Benjamini-Hochberg correction). The gene number enriched in each term is shown at the end of the bar. Asterisks highlight mitochondria metabolism (red) and protein synthesis-related (blue) GO terms. (D) The heat map shows the expression pattern of all DEGs included in GO terms related to mitochondria metabolism and protein synthesis, as marked by asterisks in panel C. The color scale indicates the expression level. The heat map includes 10 target genes that have been shown to be bound by IGF2BP2 in brown adipose tissue14 (green circle in panel B) including 8 genes related to mitochondrial metabolism (marked by yellow asterisks) and 2 genes related to protein synthesis (marked by purple asterisks). An analysis of variance was applied to compare the expression of genes shown in the heat map of young Igf2bp2−/− myeloid-biased HSCs with old Igf2bp2−/− myeloid-biased HSCs (P = .26); of young Igf2bp2+/+ myeloid-biased HSCs with old Igf2bp2+/+ myeloid-biased HSCs (P = .048); or of young Igf2bp2−/− myeloid-biased HSCs with old Igf2bp2+/+ myeloid-biased HSCs (P = .49). The Igf2bp2 deletion makes the expression profile of mitochondria metabolism and protein synthesis–related genes of young myeloid-biased HSCs more similar to that of old myeloid-biased HSCs.
Igf2bp2 deletion decreases the expression of genes related to mitochondrial metabolism and protein synthesis in young myeloid-biased HSCs. Myeloid-biased HSCs (CD150highCD34−LSK) were isolated from young (3 months) and aged (range: 22-26 months) Igf2bp2+/+ and Igf2bp2−/− male mice. HSCs from individual mice were analyzed by RNA-seq (n = 4 mice per group). DEGs were identified by the DESeq2 R package (v1.28.1), using the Benjamini-Hochberg–adjusted P < .05 as a cutoff. In myeloid-biased HSCs from young Igf2bp2−/− vs Igf2bp2+/+ mice, 1421 DEGs were identified, compared with only 26 DEGs in myeloid-biased HSCs from old Igf2bp2−/− vs Igf2bp2+/+ mice. (A) Principal component analysis (PCA) found that the first PC separated the HSC transcriptomes based on age and that the second PC separated Igf2bp2 gene status in young mice, but not in the HSCs from old mice. (B) A Venn diagram depicting the number of upregulated (red circle) and downregulated (blue circle) DEGs in myeloid-biased HSCs of Igf2bp2−/− vs Igf2bp2+/+ from young (top) or old (bottom) mice. The DEGs in myeloid-biased HSCs of young Igf2bp2−/− vs Igf2bp2+/+ mice overlapped with 83 mRNAs (green circle) that had been identified to be directly bound by IGF2BP2 in brown fat.14 Note that mRNA species that are bound by IGF2BP2 exclusively overlapped the downregulated DEGs in myeloid-biased HSCs of Igf2bp2−/− vs Igf2bp2+/+ mice. (C) Bar graph depicts the top 10 GO terms enriched for downregulated DEGs in young Igf2bp2−/− mice vs Igf2bp2+/+ mice (Benjamini-Hochberg correction). The gene number enriched in each term is shown at the end of the bar. Asterisks highlight mitochondria metabolism (red) and protein synthesis-related (blue) GO terms. (D) The heat map shows the expression pattern of all DEGs included in GO terms related to mitochondria metabolism and protein synthesis, as marked by asterisks in panel C. The color scale indicates the expression level. The heat map includes 10 target genes that have been shown to be bound by IGF2BP2 in brown adipose tissue14 (green circle in panel B) including 8 genes related to mitochondrial metabolism (marked by yellow asterisks) and 2 genes related to protein synthesis (marked by purple asterisks). An analysis of variance was applied to compare the expression of genes shown in the heat map of young Igf2bp2−/− myeloid-biased HSCs with old Igf2bp2−/− myeloid-biased HSCs (P = .26); of young Igf2bp2+/+ myeloid-biased HSCs with old Igf2bp2+/+ myeloid-biased HSCs (P = .048); or of young Igf2bp2−/− myeloid-biased HSCs with old Igf2bp2+/+ myeloid-biased HSCs (P = .49). The Igf2bp2 deletion makes the expression profile of mitochondria metabolism and protein synthesis–related genes of young myeloid-biased HSCs more similar to that of old myeloid-biased HSCs.
Because IGF2BP2 is an RNA binding protein that regulates gene expression, we compared the DEGs in myeloid-biased HSCs from Igf2bp2−/− vs Igf2bp2+/+ young mice with the mRNAs that were directly bound to IGF2BP2 in mouse brown fat.14 We found that they exclusively overlapped with downregulated but not with upregulated DEGs in myeloid-biased HSCs of young Igf2bp2−/− vs Igf2bp2+/+ mice (Figure 2B), suggesting that upregulated genes in response to Igf2bp2 deletion may represent secondary responses and not direct IGF2BP2 targets. Further analysis focused on mRNA that showed decreased expression in Igf2bp2−/− vs Igf2bp2+/+ myeloid-biased HSCs. Gene Ontology (GO) analysis revealed a significant reduction in the expression of genes related to the GO terms “mitochondrial metabolism” and “protein synthesis” in Igf2bp2−/− vs Igf2bp2+/+ myeloid-biased HSCs of young mice, but not in those of old mice (Figure 2C-D). Analysis of variance (ANOVA) of this DEG subset showed that the expression of these genes significantly declined in myeloid-biased HSCs from aged vs young Igf2bp2+/+ mice (Figure 2D; P = .048). However, there was no significant difference in the expression of these genes in myeloid-biased HSCs from aged Igf2bp2+/+ vs Igf2bp2−/− mice (P = .49). These data indicate that Igf2bp2 controls the expression of genes related to metabolism and protein synthesis in myeloid-biased HSCs of young mice, but this gene regulatory function of Igf2bp2 is lost during aging.
Igf2bp2 expression is enriched in a subcluster of HSCs from young mice cosegregating with expression of Lin28, Igf/Pi3k, and stemness-related genes
scRNA-seq was conducted on freshly isolated myeloid-biased HSCs from a pool of 6-week-old, male, wild-type mice (n = 5). Mice of this age and sex were chosen, because they showed the highest expression of Igf2bp2 (supplemental Figure 3B-C). Through cell clustering (via the Louvain algorithm in Seurat), scRNA-seq identified a subcluster (cluster 3) of myeloid-biased HSCs that had an increased percentage of Igf2bp2-expressing cells compared with the other 8 subclusters that were identified by specific markers of each cluster (Figure 3A-C; supplemental Figure 4A). In agreement with this observation, cluster 3 was also enriched for an increased percentage of cells expressing other components of the Lin28 pathway (Figure 3D-E; supplemental Figure 4B-C), as well as downstream targets that are known to be bound and regulated by Igf2bp2 (Figure 3F-I).
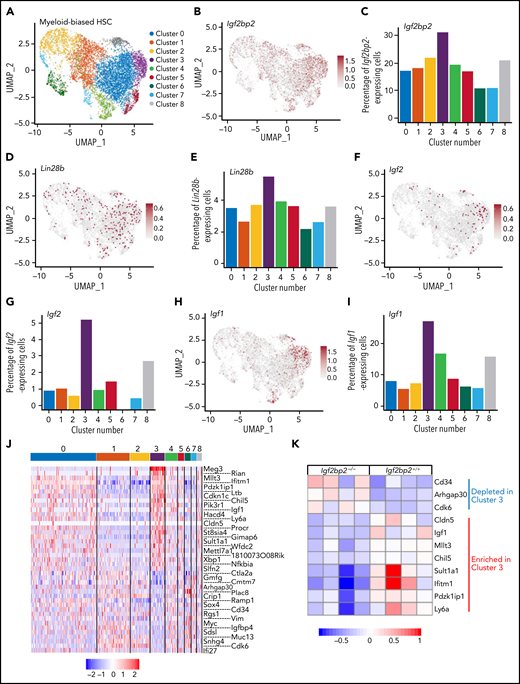
Igf2bp2 expression in young HSCs cosegregates with Lin28b, Igf/Pi3k, and stemness-related gene expression signatures. Freshly purified myeloid-biased HSCs (CD150highCD34−LSK) from 6-week-old male wild-type mice were analyzed by scRNA-seq (single-pool analysis of n = 5 mice). (A) UMAP plot with Seurat clustering analysis revealing 9 distinct clusters (0-8). (B-I) Feature plots and histograms on target genes of the Lin28/Igf2bp2 pathway depicting the expression levels and the percentage of positive cells in the HSC subclusters for Igf2bp2 (B-C), Lin28b (D-E), Igf2 (F-G), and Igf1 (H-I). Gray dots indicate no expression, and the intensity of the red dots indicates the expression level of each gene. (J) Heat map of DEGs in myeloid-biased HSCs from cluster 3 (enriched for Igf2bp2 expressing cells) compared with myeloid-biased HSCs from clusters 0, 4, 5, and 8 (Bonferroni-adjusted P < .01). The color scale indicates gene expression level. The cluster is enriched for expression of known stemness-related genes (Mllt3, Cdkn1c, Procr, Xbp1, and Slfn2); for imprinted genes expressed in quiescent-enriched, long-term HSCs33 (Meg3, Rian, and Cdkn1c); and for positive regulators of Igf/Akt signaling (Pik3r1 and Igf1), but is depleted for the expression of inhibitors of Igf/Akt signaling (Cmtm7 and Igfbp4). (K) Heat map of the expression pattern of marker DEGs of myeloid-biased HSCs from cluster 3 in panel J that overlapped with the DEGs in young Igf2bp2−/− myeloid-biased HSCs vs Igf2bp2+/+ myeloid-biased HSCs from bulk RNA sequencing analysis (Figure 2). UMAP, Uniform Manifold Approximation and Projection.
Igf2bp2 expression in young HSCs cosegregates with Lin28b, Igf/Pi3k, and stemness-related gene expression signatures. Freshly purified myeloid-biased HSCs (CD150highCD34−LSK) from 6-week-old male wild-type mice were analyzed by scRNA-seq (single-pool analysis of n = 5 mice). (A) UMAP plot with Seurat clustering analysis revealing 9 distinct clusters (0-8). (B-I) Feature plots and histograms on target genes of the Lin28/Igf2bp2 pathway depicting the expression levels and the percentage of positive cells in the HSC subclusters for Igf2bp2 (B-C), Lin28b (D-E), Igf2 (F-G), and Igf1 (H-I). Gray dots indicate no expression, and the intensity of the red dots indicates the expression level of each gene. (J) Heat map of DEGs in myeloid-biased HSCs from cluster 3 (enriched for Igf2bp2 expressing cells) compared with myeloid-biased HSCs from clusters 0, 4, 5, and 8 (Bonferroni-adjusted P < .01). The color scale indicates gene expression level. The cluster is enriched for expression of known stemness-related genes (Mllt3, Cdkn1c, Procr, Xbp1, and Slfn2); for imprinted genes expressed in quiescent-enriched, long-term HSCs33 (Meg3, Rian, and Cdkn1c); and for positive regulators of Igf/Akt signaling (Pik3r1 and Igf1), but is depleted for the expression of inhibitors of Igf/Akt signaling (Cmtm7 and Igfbp4). (K) Heat map of the expression pattern of marker DEGs of myeloid-biased HSCs from cluster 3 in panel J that overlapped with the DEGs in young Igf2bp2−/− myeloid-biased HSCs vs Igf2bp2+/+ myeloid-biased HSCs from bulk RNA sequencing analysis (Figure 2). UMAP, Uniform Manifold Approximation and Projection.
Next, the gene expression in cluster 3 was compared with that in 4 other clusters (0, 4, 5, and 8; Figure 3A). These clusters were selected based on their similarity to cluster 3 as unbiased and unprimed toward particular hematopoietic lineages. The 4 remaining clusters (1, 2, 6, and 7) were excluded from the comparison, as they expressed genes that indicate priming toward lineage commitment (megakaryocyte/thrombocyte and erythroid lineages; supplemental Figure 5A-H). Igf2bp2 expression in cluster 3 was significantly upregulated (P = 4.142 × 10⁻⁹; supplemental Figure 5I) when compared with individual, unprimed clusters 0 (P = 2.6 × 10⁻⁹), 4 (P = 6.6 × 10⁻⁴), and 5 (P = 8.7 × 10⁻⁴). Only when compared with cluster 8 was the difference not significant (P = .07), but interestingly, cluster 8 had an expression profile of genes that was more similar to that of cluster 3 than to that of the other clusters (Figure 3J). Compared with the unprimed HSC clusters (0, 4, 5, and 8), the expression signature of cluster 3 showed an upregulation of IGF/PI3K signaling (Igf1, Pik3r1) and a downregulation of inhibitors of AKT signaling (Igfbp4 and Cmtm7; Figure 3J). IGF/PI3K/AKT represent major regulators of cellular metabolism and growth that are known to be activated by Igf2bp2-mediated RNA expression.24-27 Interestingly, cluster 3 was also enriched for the expression of genes related to quiescence and stemness of HSCs, including Mllt3,28Cdkn1c/p57,29Procr,30Xbp1,31 and Slfn232 (Figure 3J). Moreover, cluster 3 showed enrichment for genes that are known to be regulated by imprinting and highly expressed in quiescent-enriched, long-term HSCs,33 including Rian, Cdkn1c/p57, H19, and Meg334 (Figure 3J; supplemental Figure 4D-I). The connection between Igf2bp2 expression in cluster 3 with the marker genes in this cluster was supported by a comparison of the cluster 3 marker genes with the pooled RNA-seq data on myeloid-biased HSCs of young Igf2bp2−/− vs Igf2bp2+/+ mice (Figure 2). This analysis revealed that the marker genes of cluster 3 that overlapped with DEGs in the RNA-seq analysis of pooled myeloid-biased HSCs from Igf2bp2−/− vs Igf2bp2+/+ mice were all regulated in the expected direction (Figure 3K).
Igf2bp2 deletion impairs the functional capacity of HSCs from young mice more than HSCs from aged mice
The colony-forming capacity of HSCs was determined by using freshly isolated myeloid-biased HSCs and balanced HSCs from Igf2bp2−/− and Igf2bp2+/+ young and old male mice. Igf2bp2 deletion inhibited the colony-forming capacity of myeloid-biased HSCs, and the effect size of Igf2bp2 deletion on inhibition of colony-forming capacity was higher for myeloid-biased HSCs from young than for aged mice (Figure 4A). Similar results were obtained for balanced HSCs, albeit the effect size of the Igf2bp2 genotype was reduced overall (supplemental Figure 6).
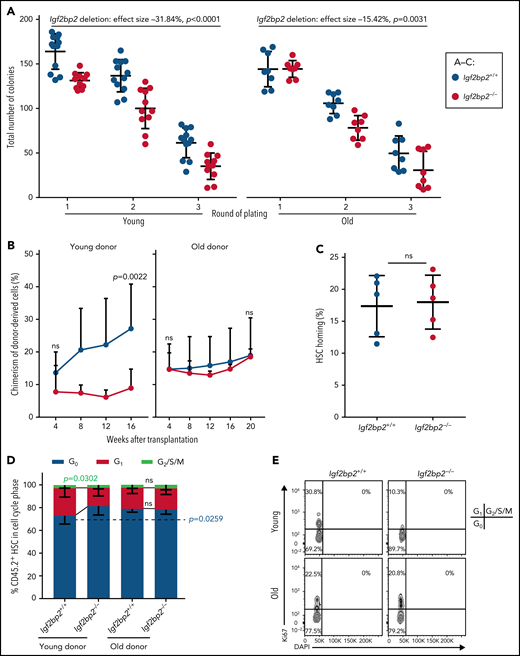
Igf2bp2 deletion impairs repopulation and colony-forming capacity of young but not old HSCs. Freshly isolated HSCs from Igf2bp2+/+ and Igf2bp2−/− mice were analyzed. (A) Myeloid-biased HSCs (CD150highCD34−LSK; n = 500) from male mice at young age (range: 3-6 months) and old age (range: 22-26 months) were plated for 3 rounds to determine the colony-forming capacity (8-12 mice per group). Statistical analysis by 3-way analysis of variance (ANOVA; using "program package R v3.6.3, function aov()") revealed that age (P < .0001), genotype (P < .0001), and round of plating (P < .0001) significantly affected the colony-forming capacity. Moreover, age and genotype had a significant combinatorial effect (P = .0119). Post hoc testing with 2-way ANOVA for separate age groups indicated that Igf2bp2 deletion had a stronger effect on impairing the colony-forming capacity of myeloid-biased HSCs from young mice (effect size: −31.84 units; P < .0001) compared with aged mice (effect size: −15.42 units; P = .0031). (B,D-E) Myeloid-biased HSCs (CD150highCD34−LSK; n = 100) from young donors (3-6 months) or 1000 total CD150+ (high and low) HSCs (CD150+CD34−LSK) from old donors (27 months) were transplanted along with 1 × 10⁶ competitor BM cells (CD45.1). Young HSCs, 9-10 donors and recipients (1:1 transplantation) per group; old HSCs, 4 to 5 recipient per group. (B) Analysis of the total chimerism of donor-derived cells in PB at the indicated time points after transplantation. (D-E) Donors were analyzed 16 or 20 weeks after transplantation. Cell cycle status of donor-derived HSCs: quantification (D) and representative fluorescence-activated cell sorting plots (E). (C) Percentage of homed myeloid-biased HSCs (CD150highCD34−LSK) from 3-month-old Igf2bp2−/− vs Igf2bp2+/+ donor mice (n = 5 mice per group). (B-D) Statistical significance of genotype-dependent difference in young or old donors was determined by Welch’s t test. All data are expressed as the mean ± SD; ns, nonsignificant.
Igf2bp2 deletion impairs repopulation and colony-forming capacity of young but not old HSCs. Freshly isolated HSCs from Igf2bp2+/+ and Igf2bp2−/− mice were analyzed. (A) Myeloid-biased HSCs (CD150highCD34−LSK; n = 500) from male mice at young age (range: 3-6 months) and old age (range: 22-26 months) were plated for 3 rounds to determine the colony-forming capacity (8-12 mice per group). Statistical analysis by 3-way analysis of variance (ANOVA; using "program package R v3.6.3, function aov()") revealed that age (P < .0001), genotype (P < .0001), and round of plating (P < .0001) significantly affected the colony-forming capacity. Moreover, age and genotype had a significant combinatorial effect (P = .0119). Post hoc testing with 2-way ANOVA for separate age groups indicated that Igf2bp2 deletion had a stronger effect on impairing the colony-forming capacity of myeloid-biased HSCs from young mice (effect size: −31.84 units; P < .0001) compared with aged mice (effect size: −15.42 units; P = .0031). (B,D-E) Myeloid-biased HSCs (CD150highCD34−LSK; n = 100) from young donors (3-6 months) or 1000 total CD150+ (high and low) HSCs (CD150+CD34−LSK) from old donors (27 months) were transplanted along with 1 × 10⁶ competitor BM cells (CD45.1). Young HSCs, 9-10 donors and recipients (1:1 transplantation) per group; old HSCs, 4 to 5 recipient per group. (B) Analysis of the total chimerism of donor-derived cells in PB at the indicated time points after transplantation. (D-E) Donors were analyzed 16 or 20 weeks after transplantation. Cell cycle status of donor-derived HSCs: quantification (D) and representative fluorescence-activated cell sorting plots (E). (C) Percentage of homed myeloid-biased HSCs (CD150highCD34−LSK) from 3-month-old Igf2bp2−/− vs Igf2bp2+/+ donor mice (n = 5 mice per group). (B-D) Statistical significance of genotype-dependent difference in young or old donors was determined by Welch’s t test. All data are expressed as the mean ± SD; ns, nonsignificant.
The in vivo repopulation capacity of HSCs was assessed by transplantation of freshly isolated myeloid-biased HSCs from young mice. For old mice, CD150+ (high and low) HSCs were used. Igf2bp2 deletion significantly reduced the repopulation capacity of young myeloid-biased HSCs during long-term engraftment in primary recipients (Figure 4B; left). In contrast, Igf2bp2 gene status did not affect the long-term repopulating capacity of CD150+ HSCs of aged mice (Figure 4B; right). Based on the difference in purification of test donor HSCs, we cannot exclude that the transplantation of purified myeloid-biased (CD150high) HSCs could have revealed an inhibitory effect of Igf2bp2 deletion on the repopulation function of myeloid-biased HSCs from old mice. However, the analysis of colony-forming capacity demonstrated that Igf2bp2 deletion had a stronger inhibitory effect on the function of myeloid-biased HSCs from young mice vs those from old mice. Igf2bp2 gene status had no effect on the homing capacity of myeloid-biased HSCs (Figure 4C), as measured by previously established protocols.21 However, Igf2bp2 deletion led to an increase in the fraction of young donor–derived HSCs (CD150+) in quiescence (G0) and a decrease in those in G1 (Figure 4D-E). In aged donor HSCs (CD150+), Igf2bp2 gene status had no effect on those cell cycle parameters (Figure 4D-E). Together, these data indicate that Igf2bp2 is necessary for full repopulation function and colony-forming capacity of young, myeloid-biased HSCs, but the deletion of Igf2bp2 has lesser effects on the function of aged HSCs.
Igf2bp2 regulates mitochondrial metabolism and protein synthesis of HSCs
The experiments described so far showed that Igf2bp2 activated the expression of genes necessary for mitochondria metabolism and protein synthesis in HSCs (Figure 2). To further validate this result, we conducted a proteomics analysis on Igf2bp2-overexpressing vs control HSCs (supplemental Figure 7A-B) on HSCs of aged mice, given that we had observed a reduction in Igf2bp2 gene expression and a loss of its gene regulatory function during HSC aging (Figures 1 and 2). Ingenuity Pathway Analysis of differentially expressed proteins identified EIF2 activation as the single, significantly enriched pathway in Igf2bp2 cDNA-expressing HSCs vs controls (P = .026). EIF2 controls a rate-limiting step in translation initiation.35 Downregulation of protein synthesis is essential for maintenance of BM HSCs.6,36 Ingenuity Pathway Analysis of enriched terms related to biological functions in the set of differentially expressed proteins confirmed a strong induction of the term protein synthesis in Igf2bp2-overexpressing HSCs vs controls and, in addition, an enrichment of metabolism-related terms (Figure 5A-B).
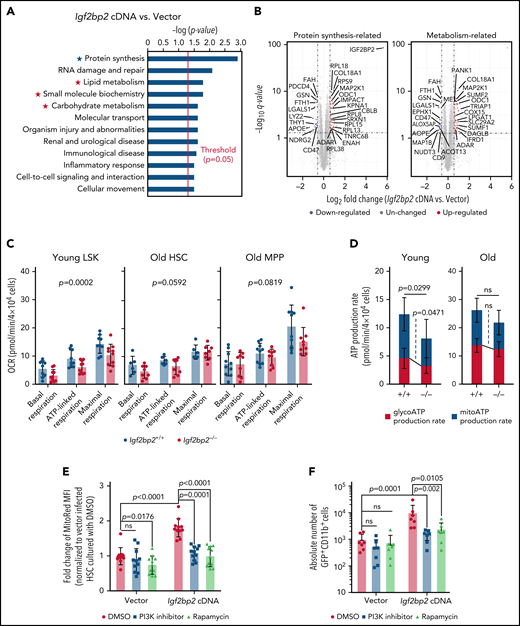
Igf2bp2 regulates mitochondrial activity in HSPCs of mice. (A-B) Freshly isolated, total CD150+ (high and low) HSCs (CD150+CD34−LSK) from wild-type males (range: 24-27 months) were virally infected with Igf2bp2 cDNA or an empty vector (control). After transduction (2.5 days), transduced cells (CD48−LSKs) were re-sorted for proteomics analysis (n = 5 replicates per group). (A) Ingenuity Pathway Analysis (IPA) on differentially expressed proteins, Fisher’s exact test with Benjamini-Hochberg–corrected P values. (B) The differentially expressed proteins related to protein synthesis (marked by blue asterisks) metabolism (marked by red asterisks). Volcano plots on differentially expressed proteins related to protein synthesis (left, marked by blue asterisks in panel A) and metabolism (right, marked by red asterisks in panel A) in Igf2bp2-overexpressing cells compared with control cells. Relative quantification was performed in Spectronaut for each pairwise comparison using the replicate samples from each condition. (C-D) Freshly isolated LSK (lineage−cKit+Sca1+) from young mice (range: 3-6 months) and total CD150+ (high and low) HSCs (CD150+CD34−LSK) and multipotent progenitors (CD34+LSKs = MPPs) from old mice (range: 22-26 months) were used for respirometry analysis of Igf2bp2−/− vs Igf2bp2+/+ mice. (C) Quantification of oxygen consumption rates (OCRs) for basal respiration, ATP-linked respiration and maximal respiration of cells of the indicated genotype and age (young LSK cells, 9-10 mice per genotype, 2 independent experiments; old HSCs, 6 to 8 mice per genotype, 2 independent experiments; and old MPPs, 9 to 10 mice per genotype, 3 independent experiments). Linear modeling and analysis of variance (ANOVA; using "program package R v3.6.3, function aov()") on genotype and all respirometric parameters revealed a significant reduction of the OCR in LSK cells of young mice (P = .0002) but not in HSCs (P = .0592) or MPPs (P = .0819) of old mice. (D) Histogram of the ATP production rate. Young LSKs (left): 11 to 13 mice per genotype, 4 independent experiments; old HSCs (right), 8 to 11 mice per genotype, 3 independent experiments. Statistical analysis was performed with Welch’s t test. (E-F) Transduced HSCs were cultured with dimethyl sulfoxide (DMSO; control; circles) or inhibitors of PI3K (squares) or rapamycin (triangles) starting 12 hours after transduction. (E) The mitochondrial potential of transduced CD48− LSK cells was determined 2 days after culture initiation by MitoRed fluorescence-activated cell sorting (FACS) analysis. The mean fluorescence intensity of MitoRed was normalized to DMSO treated, vector-transduced cells set to 1. A total of 11 mice per group in 3 independent experiments. (F) The absolute number of DAPI−GFP+CD11b+ cells in the indicated groups was analyzed 7 days after culture initiation by FACS (n = 7 mice per group in 3 independent experiments). (E-F) Statistical analysis by 2-way ANOVA on log-transformed data followed by pairwise t tests with Sidak’s correction for multiple comparisons. All data are expressed as the mean ± SD; ns, nonsignificant.
Igf2bp2 regulates mitochondrial activity in HSPCs of mice. (A-B) Freshly isolated, total CD150+ (high and low) HSCs (CD150+CD34−LSK) from wild-type males (range: 24-27 months) were virally infected with Igf2bp2 cDNA or an empty vector (control). After transduction (2.5 days), transduced cells (CD48−LSKs) were re-sorted for proteomics analysis (n = 5 replicates per group). (A) Ingenuity Pathway Analysis (IPA) on differentially expressed proteins, Fisher’s exact test with Benjamini-Hochberg–corrected P values. (B) The differentially expressed proteins related to protein synthesis (marked by blue asterisks) metabolism (marked by red asterisks). Volcano plots on differentially expressed proteins related to protein synthesis (left, marked by blue asterisks in panel A) and metabolism (right, marked by red asterisks in panel A) in Igf2bp2-overexpressing cells compared with control cells. Relative quantification was performed in Spectronaut for each pairwise comparison using the replicate samples from each condition. (C-D) Freshly isolated LSK (lineage−cKit+Sca1+) from young mice (range: 3-6 months) and total CD150+ (high and low) HSCs (CD150+CD34−LSK) and multipotent progenitors (CD34+LSKs = MPPs) from old mice (range: 22-26 months) were used for respirometry analysis of Igf2bp2−/− vs Igf2bp2+/+ mice. (C) Quantification of oxygen consumption rates (OCRs) for basal respiration, ATP-linked respiration and maximal respiration of cells of the indicated genotype and age (young LSK cells, 9-10 mice per genotype, 2 independent experiments; old HSCs, 6 to 8 mice per genotype, 2 independent experiments; and old MPPs, 9 to 10 mice per genotype, 3 independent experiments). Linear modeling and analysis of variance (ANOVA; using "program package R v3.6.3, function aov()") on genotype and all respirometric parameters revealed a significant reduction of the OCR in LSK cells of young mice (P = .0002) but not in HSCs (P = .0592) or MPPs (P = .0819) of old mice. (D) Histogram of the ATP production rate. Young LSKs (left): 11 to 13 mice per genotype, 4 independent experiments; old HSCs (right), 8 to 11 mice per genotype, 3 independent experiments. Statistical analysis was performed with Welch’s t test. (E-F) Transduced HSCs were cultured with dimethyl sulfoxide (DMSO; control; circles) or inhibitors of PI3K (squares) or rapamycin (triangles) starting 12 hours after transduction. (E) The mitochondrial potential of transduced CD48− LSK cells was determined 2 days after culture initiation by MitoRed fluorescence-activated cell sorting (FACS) analysis. The mean fluorescence intensity of MitoRed was normalized to DMSO treated, vector-transduced cells set to 1. A total of 11 mice per group in 3 independent experiments. (F) The absolute number of DAPI−GFP+CD11b+ cells in the indicated groups was analyzed 7 days after culture initiation by FACS (n = 7 mice per group in 3 independent experiments). (E-F) Statistical analysis by 2-way ANOVA on log-transformed data followed by pairwise t tests with Sidak’s correction for multiple comparisons. All data are expressed as the mean ± SD; ns, nonsignificant.
To determine the functional impact of the endogenous expression level of Igf2bp2 on mitochondria metabolism, respirometry analysis was conducted on freshly isolated HSPCs from young and aged Igf2bp2−/− and Igf2bp2+/+ mice. Because of the number of cells needed, this experiment was conducted on LSK cells from young mice (containing a mean of 90% MPPs and 7% HSCs in this experiment) and on CD150+ (high and low) HSCs and MPPs from old mice. Igf2bp2 depletion had a stronger effect on lowering the mitochondrial respiration (basal, ATP-linked, and maximal) of young LSK cells (3.117 ± 1.081 units; P = .0002) compared with that of aged HSCs (1.548 ± 1.113 units; P = .0592) or MPPs (2.339 ± 1.835 units; P = .0819; Figure 5C; supplemental Figure 7C). Igf2bp2 deletion also led to a reduction of adenosine triphosphate (ATP) production in LSK cells of mice, which was not seen at a significant level in aged HSCs (Figure 5D). Igf2bp2-dependent lowering of the oxygen consumption rate of young LSK cells did not lead to changes in ROS levels (supplemental Figure 7D). However, GO terms that were significantly enriched and downregulated overall in the bulk RNA sequencing of myeloid-biased HSCs of young Igf2bp2−/− vs Igf2bp2+/+ mice (Figure 2) included 20 GO terms in the list of the top 200 significant GO terms that were related to mitochondrial stress (supplemental Figure 7E; supplemental Table 1; for GO-terms that were significantly enriched and upregulated overall in the same experiment, see supplemental Table 2). Together, it appears that mitochondrial stress was enhanced in young Igf2bp2+/+ vs Igf2bp2−/− myeloid-biased HSCs, despite the lack of detectable, genotype-related differences in ROS, possibly because of the lack of sensitivity of the currently used dye-based methodology. Interestingly, intracellular ATP concentration also did not show a reduction in CD150+ (high and low) HSCs and in MPPs of young Igf2bp2−/− mice vs wild-type mice (supplemental Figure 7F), despite the observed genotype-dependent differences in ATP production rates (Figure 5D). It is possible that the inhibitory effect of Igf2bp2 deletion on protein synthesis (Figure 2) reduces ATP consumption, thus outweighing reduction in ATP synthesis in Igf2bp2 depleted cells.
The Lin28/let-7 pathway is upstream of Hmga2/Igf2bp2 in regulating cell growth, protein synthesis, and metabolism by activation of mTOR and PI3K pathways.9 To test whether this pathway contributes to Igf2bp2-mediated differentiation of HSCs in culture, Igf2bp2-cDNA vs control vector–infected CD150+ (high and low) HSCs were treated with inhibitors of mTOR (by rapamycin) or PI3K signaling (by LY294002). In culture, freshly isolated HSCs differentiate mainly into the myeloid lineage (CD11b+), thus reflecting the HSC’s capacity for such differentiation. Both inhibitors abrogated Igf2bp2-overexpression–induced increases in the mitochondrial membrane potential (Figure 5E) and in the induction myeloid differentiation of HSCs (Figure 5F). Together, these results showed that iatrogenic induction of Igf2bp2 activates mitochondria, protein synthesis pathways, and differentiation of HSCs in an mTOR/PI3K-dependent manner.
Enhanced mitochondrial and mTOR activity can lead to loss of HSC maintenance.37,38 To determine consequences of Igf2bp2 overexpression, freshly isolated CD150+ (high and low) HSCs from young and aged mice were transplanted, along with competitor cells, into lethally irradiated recipients. Twelve weeks after transplantation, PB analysis revealed a significant loss of repopulation capacity (supplemental Figure 8A-B) and aggravated myeloid skewing (supplemental Figure 8C) in recipients of HSCs overexpressing Igf2bp2 compared with controls, especially when HSCs from aged mice were transplanted. These results indicate that overexpression of Igf2bp2 cannot rescue the function of HSC from aged mice but leads to HSC exhaustion, possibly related to the supraphysiological induction of mitochondria and PI3K/mTOR activity.
Igf2bp2 deletion ameliorates aging-associated HSC expansion and myeloid skewing
Increases in the number of phenotypic HSCs represent a hallmark of the aging hematopoietic system in mice and humans.39-42 In this study, the number of phenotypic-defined HSCs was investigated in young (range: 3-6 months), middle (range: 9-15 months), and old (range: 18-27 months) Igf2bp2+/+ and Igf2bp2−/− mice. In agreement with previous results,14 there was a reduction in body weight and an elongated lifespan in Igf2bp2−/− mice vs Igf2bp2+/+ littermate controls (supplemental Figure 9).
Analysis of the number of CD150+ (high and low) HSCs revealed the expected increase in the number of HSCs during aging (Figure 6A-B). Igf2bp2 deletion significantly reduced this age-related increase in HSCs in male and female mice (Figure 6A-B). In addition, the slope of the increase in HSC numbers from young adult to old age was also significantly lower in Igf2bp2−/− vs Igf2bp2+/+ mice (Figure 6C), implying that Igf2bp2 gene status affects aging-related increases in the number of HSCs. Moreover, Igf2bp2 deletion ameliorated aging-associated increases in CD41+ HSCs (Figure 6D-F), a subpopulation of myeloid-primed HSCs exhibiting megakaryocyte-erythroid–directed differentiation and strong aging-associated increases.43-45 Similarly, Igf2bp2 deletion reduced the aging-related increase in the number of myeloid-biased (CD150high) HSCs46 in mice of both sexes (Figure 6G). Igf2bp2 gene status did not affect the aging-related increase in balanced HSCs (CD150low) and reduced the age-dependent increase in the number of CD41− HSCs only in male mice (supplemental Figure 10A-B). Igf2bp2 deletion also led to a significant reduction in the ratio of myeloid-biased HSCs vs balanced HSCs in aged Igf2bp2−/− vs Igf2bp2+/+ mice of both sexes (Figure 6H-I). Igf2bp2 gene status had no effect on progenitor cell populations, such as MPPs, MPP subpopulations, common myeloid progenitors (CMP), and total BM cells (supplemental Figure 10C-F). Only the number of common lymphoid progenitors (CLP) was reduced in young (both sexes) and middle-aged (male) Igf2bp2−/− vs Igf2bp2+/+ mice (supplemental Figure 10G). Igf2bp2−/− vs Igf2bp2+/+ mice did not show a reduction in MPP4 cells (supplemental Figure 10D). Because MPP4s represent a subpopulation of MPPs primed to undergo lymphoid differentiation,47,48 it is conceivable that Igf2bp2 is necessary for MPP4s to generate CLP.
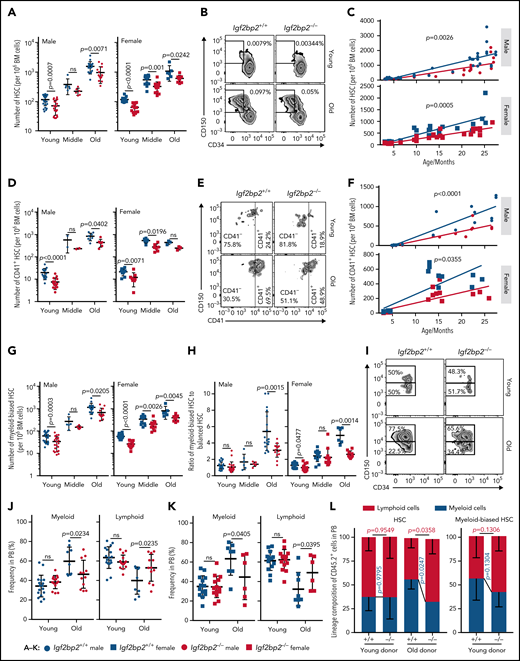
Igf2bp2 deletion ameliorates aging-associated myeloid-biased HSC expansion and myeloid skewing in PB. Fluorescence-activated cell sorting (FACS) analysis of the frequencies of CD150+ (high and low) HSCs (CD150+CD34−LSK) (A-C), myeloid-restricted HSCs (CD41+CD150+CD34−LSK) (D-F), and myeloid-biased (CD150highCD34−LSK) (G-H) vs balanced HSCs (CD150lowCD34−LSK) in total BM cells from Igf2bp2+/+ and Igf2bp2−/− mice at young (range: 3-6 months), middle (range: 9-15 months), and old (range: 18-27 months) age. (A,D,G) Graphs show the number of HSCs per 106 total BM cells. Data points represent 6 to 24 individual mice per group. (B,E,I) Representative FACS plots. (C,F) Scatter plots depict the number of HSCs per 106 total BM cells. The slopes were analyzed by linear regression; group-wise (dis)agreement of models was determined with a Wald test (C), regression coefficients R2 = 0.7517 for Igf2bp2+/+ male mice, R2 = 0.7174 for Igf2bp2−/− male mice; R2 = 0.709 for Igf2bp2+/+ female mice, and R2 = 0.8576 for Igf2bp2−/− female mice; (F) R2 = 0.851 for Igf2bp2+/+ male mice, R2 = 0.8504 for Igf2bp2−/− male mice R2 = 0.6363 for Igf2bp2+/+ female mice, and R2 = 0.5988 for Igf2bp2−/− female mice. (H) Ratio of myeloid-biased HSCs to balanced HSCs of mice of the indicated age group, sex, and genotype. (J-K) The frequency of myeloid cells (including Gr1+ cells and CD11b+ cells) and lymphoid cells (including B220+, CD4+, and CD8+ cells) in PB of the indicated genotypes of male (J) and female (K) mice at young (range: 3-6 months) and old (range: 22-27 months) ages. Data points represent 6 to 17 mice per genotype per age. (A,D,G-H,J-K) Statistics were calculated by 2-way analysis of variance on log-transformed data (A,D,G), on logit-transformed data (H), or on original data (J-K), followed by Sidak’s test for multiple comparisons. The y-axes of panels A, D, and G are in log scale. (L) HSCs from young (range: 3-6 months) or old (27 months) donors were transplanted along with competitor total BM cells (CD45.1). Analysis of myeloid cells (including Gr1+ and CD11b+ cells) vs lymphoid cells (including B220+, CD4+, and CD8+ cells) in donor-derived cells in PB 16 or 20 weeks after transplantation. Lineage composition in donor-derived PB of recipients of CD150+ (high and low) HSCs from young and old donors (4-5 mice per group; left). Lineage composition in donor-derived PB of recipients of myeloid-biased HSCs (right; CD150high) from young donors (9-10 mice per group; right). Note the myeloid skewing in transplantation of CD150+ (high and low) HSCs from old donors was rescued by Igf2bp2 depletion. Statistical significance of genotype-dependent differences between young and old donors was calculated by Welch’s t test. Data are expressed as the mean ± SD. ns, nonsignificant.
Igf2bp2 deletion ameliorates aging-associated myeloid-biased HSC expansion and myeloid skewing in PB. Fluorescence-activated cell sorting (FACS) analysis of the frequencies of CD150+ (high and low) HSCs (CD150+CD34−LSK) (A-C), myeloid-restricted HSCs (CD41+CD150+CD34−LSK) (D-F), and myeloid-biased (CD150highCD34−LSK) (G-H) vs balanced HSCs (CD150lowCD34−LSK) in total BM cells from Igf2bp2+/+ and Igf2bp2−/− mice at young (range: 3-6 months), middle (range: 9-15 months), and old (range: 18-27 months) age. (A,D,G) Graphs show the number of HSCs per 106 total BM cells. Data points represent 6 to 24 individual mice per group. (B,E,I) Representative FACS plots. (C,F) Scatter plots depict the number of HSCs per 106 total BM cells. The slopes were analyzed by linear regression; group-wise (dis)agreement of models was determined with a Wald test (C), regression coefficients R2 = 0.7517 for Igf2bp2+/+ male mice, R2 = 0.7174 for Igf2bp2−/− male mice; R2 = 0.709 for Igf2bp2+/+ female mice, and R2 = 0.8576 for Igf2bp2−/− female mice; (F) R2 = 0.851 for Igf2bp2+/+ male mice, R2 = 0.8504 for Igf2bp2−/− male mice R2 = 0.6363 for Igf2bp2+/+ female mice, and R2 = 0.5988 for Igf2bp2−/− female mice. (H) Ratio of myeloid-biased HSCs to balanced HSCs of mice of the indicated age group, sex, and genotype. (J-K) The frequency of myeloid cells (including Gr1+ cells and CD11b+ cells) and lymphoid cells (including B220+, CD4+, and CD8+ cells) in PB of the indicated genotypes of male (J) and female (K) mice at young (range: 3-6 months) and old (range: 22-27 months) ages. Data points represent 6 to 17 mice per genotype per age. (A,D,G-H,J-K) Statistics were calculated by 2-way analysis of variance on log-transformed data (A,D,G), on logit-transformed data (H), or on original data (J-K), followed by Sidak’s test for multiple comparisons. The y-axes of panels A, D, and G are in log scale. (L) HSCs from young (range: 3-6 months) or old (27 months) donors were transplanted along with competitor total BM cells (CD45.1). Analysis of myeloid cells (including Gr1+ and CD11b+ cells) vs lymphoid cells (including B220+, CD4+, and CD8+ cells) in donor-derived cells in PB 16 or 20 weeks after transplantation. Lineage composition in donor-derived PB of recipients of CD150+ (high and low) HSCs from young and old donors (4-5 mice per group; left). Lineage composition in donor-derived PB of recipients of myeloid-biased HSCs (right; CD150high) from young donors (9-10 mice per group; right). Note the myeloid skewing in transplantation of CD150+ (high and low) HSCs from old donors was rescued by Igf2bp2 depletion. Statistical significance of genotype-dependent differences between young and old donors was calculated by Welch’s t test. Data are expressed as the mean ± SD. ns, nonsignificant.
To analyze consequences of Igf2bp2 deletion on myeloid skewing, PB samples from young and aged Igf2bp2−/− vs Igf2bp2+/+ mice were analyzed. Igf2bp2 deletion partially rescued aging-associated myeloid skewing in blood cell production resulting in an improved balance of myeloid-to-lymphoid cells in the PB of aged mice of both sexes (Figure 6J-K). To determine whether HSC-intrinsic mechanisms contribute to this rescue, an HSC transplantation experiment was conducted using CD150+ (high and low) HSCs. As expected from previous studies,43,45 the ratio of myeloid to lymphoid cells was elevated after transplantation of CD150+ (high and low) HSCs from aged vs young donor mice (Figure 6L; left graph). Although it did not affect the ratio of myeloid to lymphoid cells in recipients of HSCs from young donors, Igf2bp2 deletion rescued myeloid skewing in donor-derived PB cells of recipients of HSCs from old donors (Figure 6L; left; supplemental Figure 10H). When purified, myeloid-biased (CD150high) HSCs from young donors were used for transplantation (Figure 6L; right), the myeloid skewing in transplant recipients was similar to that in recipients of CD150+ HSCs from aged mice (Figure 6L; left), and it was not significantly altered by Igf2bp2 deletion (Figure 6L; right graph). Together, these results indicate that the ameliorated increase in the ratio of myeloid-biased to balanced HSCs in aged Igf2bp2−/− vs Igf2bp2+/+ mice (Figure 6H) contributes to the reduction in myeloid skewing in the PB of Igf2bp2−/− vs Igf2bp2+/+ mice.
Discussion
This study reveals experimental evidence that in young HSCs, the endogenous physiological expression level of Igf2bp2 regulates mitochondrial metabolism and the expression of genes related to metabolism and protein synthesis. Igf2bp2 is necessary for the full function of young myeloid-biased HSCs to form colonies in culture and to repopulate recipients in transplantation experiments. The effect of Igf2bp2 gene status on these functional parameters of HSCs is strongly reduced during aging, which coincides with age-related downregulation of Igf2bp2 expression. Importantly, germline knockout of Igf2bp2 leads to aging-like phenotypes of HSCs in young mice, including the loss of Igf2bp2-dependent gene regulation and impairments in colony forming and in vivo repopulation capacity of HSCs. Mechanistically, the loss of Igf2bp2-dependent regulation of metabolism-, cell growth–, and protein synthesis–related genes appears to contribute to the functional decline of Igf2bp2−/− vs Igf2bp2+/+ HSCs at young age, as well as to the reduction in HSC function in aged mice. In line with this interpretation, the study revealed significant effects of the endogenous Igf2bp2 gene status on mitochondrial respiration of freshly isolated HSPCs of young mice but not of old mice. Together, the age-dependent loss of gene regulatory function of Igf2bp2 may contribute to the aging-related impairments of HSC function related to declines in metabolism and protein synthesis. In contrast to our study, Igf2bp2 has been reported to suppress the expression of mitochondrial protein–encoding mRNA in HSCs of young mice via stabilization of the m6A RNA of Bmi1.49 However, our reanalysis of the publicly available RNA sequencing data of that study49 did not verify the conclusion that Igf2bp2 suppresses mitochondria protein–encoding genes (supplemental Figure 11).
Unexpectedly, despite the loss of Igf2bp2 gene function in aging, this study shows that Igf2bp2-deletion ameliorates 2 of the other hallmark phenotypes of HSC aging: the aging-associated increase in myeloid-biased HSCs and the bias of aged HSCs to regenerate myeloid blood cells in aged mice and in recipient mice of transplanted HSC from aged mice of both genotypes. We cannot exclude the possibility that the deletion of the remaining activity of Igf2bp2 in HSC of aged knockout mice could have an effect on these HSC aging phenotypes. However, the strong reduction of the gene regulatory function of Igf2bp2 in HSCs of aged mice supports the conclusion that Igf2bp2 activity in young HSCs contributes to the development of HSC aging phenotypes at old age. In the current study, we used a germline Igf2bp2 knockout model; the observed effect of Igf2bp2 gene status on HSC aging may even involve effects of Igf2bp2 on fetal HSCs. The results of the current study indicate that residual activity of the developmental Lin28/Hmga2/Igf2bp2 pathway contributes to HSC function at young adult age, but the activity of this pathway is lost during aging, and this decline by itself represents an integral component of HSC aging. Moreover, the findings support the concept that the activity of developmental pathways during early life influences the development of aging phenotypes in late life.
Acknowledgment
The authors thank the FLI Core Facilities Flow Cytometry, Animal Facility, DNA Genomics, and Norman Rahnis for excellent support in running the proteomics analysis; all members of the Rudolph Laboratory for critical discussion; Sabrina Eichwald for excellent technical support; Sonja Schätzlein, Jennifer Freymann, and Alexa Hagedorn for great help in organizing animal documentation; and André Scherag for statistical guidance related to the planning of the in vivo transplantation experiments.
Funding support for this article was provided by the the German Research Foundation (DFG) within the collaborative research center “PolyTarget” (to K.L.R.) and by an Ong Tiong Tat Professorship financed by Ministry of Education, Singapore (to B.O.B.). SFB1278, project ID: 316213987.
Authorship
Contribution: M.S. designed and performed the majority of experiments and analyses with help from E.M.A., Z.C., and Y.C; Z.C. performed in vivo transplantation with old donor mice; E.M.A. and B.H. performed in vivo transplantation with young donor mice; M.K.R. and A.L.M. performed computational data analyses of bulk and scRNA-seq; K.S. gave support in statistical analysis; S.R.C. generated the knockout-construct for genome targeting in embryonic stem cells, and B.O.B. designed and supported the study; and K.L.R. designed and supervised the study and wrote the manuscript.
Conflict-of-interest disclosure: The authors declare no competing financial interests.
The current affiliation for S.R.C. is Department of Health Research-Multidisciplinary Research Unit (DHR-MRU), Dr. A.L.M. Postgraduate (PG) Institute of Basic Medical Sciences, University of Madras, Chennai, India.
Correspondence: K. Lenhard Rudolph, Leibniz Institute on Aging, Fritz Lipmann Institute (FLI), Beutenbergstr. 11, 07745 Jena, Germany; e-mail: lenhard.rudolph@leibniz-fli.de.
The online version of this article contains a data supplement.
Bulk and scRNA-seq are deposited and available for shared usage in the National Center for Biotechnology Information’s Gene Expression Omnibus (accession number: GSE166176). The mass spectrometry proteomics data are deposited in the ProteomeXchange Consortium via the PRIDE50 partner repository (dataset identifier: PXD018535).
Original data are available by request to the corresponding author (lenhard.rudolph@leibniz-fli.de).
The publication costs of this article were defrayed in part by page charge payment. Therefore, and solely to indicate this fact, this article is hereby marked “advertisement” in accordance with 18 USC section 1734.

This feature is available to Subscribers Only
Sign In or Create an Account Close Modal